Ab Initio Calculations of Hydroxyl Impurities in CaF2
Ab Initio Calculations of Hydroxyl Impurities in CaF2
Ab Initio Calculations of Hydroxyl Impurities in CaF2

Create successful ePaper yourself
Turn your PDF publications into a flip-book with our unique Google optimized e-Paper software.
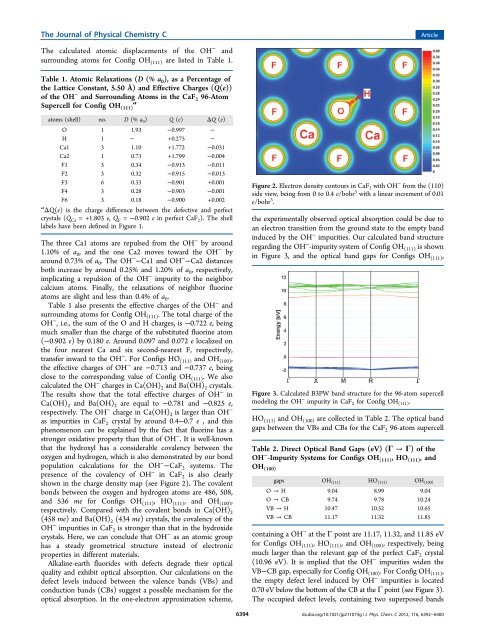
The Journal <strong>of</strong> Physical Chemistry CArticleThe calculated atomic displacements <strong>of</strong> the OH − andsurround<strong>in</strong>g atoms for Config OH (111) are listed <strong>in</strong> Table 1.Table 1. Atomic Relaxations (D (% a 0 ), as a Percentage <strong>of</strong>the Lattice Constant, 5.50 Å) and Effective Charges (Q(e))<strong>of</strong> the OH − and Surround<strong>in</strong>g Atoms <strong>in</strong> the CaF 2 96-AtomSupercell for Config OH (111)aatoms (shell) no. D (% a 0 ) Q (e) ΔQ (e)O 1 1.93 −0.997 −H 1 − +0.275 −Ca1 3 1.10 +1.772 −0.031Ca2 1 0.73 +1.799 −0.004F1 3 0.34 −0.913 −0.011F2 3 0.32 −0.915 −0.013F3 6 0.33 −0.901 +0.001F4 3 0.28 −0.903 −0.001F6 3 0.18 −0.900 +0.002a ΔQ(e) is the charge difference between the defective and perfectcrystals (Q Ca = +1.803 e, Q F = −0.902 e <strong>in</strong> perfect CaF 2 ). The shelllabels have been def<strong>in</strong>ed <strong>in</strong> Figure 1.The three Ca1 atoms are repulsed from the OH − by around1.10% <strong>of</strong> a 0 , and the one Ca2 moves toward the OH − byaround 0.73% <strong>of</strong> a 0 . The OH − −Ca1 and OH − −Ca2 distancesboth <strong>in</strong>crease by around 0.25% and 1.20% <strong>of</strong> a 0 , respectively,implicat<strong>in</strong>g a repulsion <strong>of</strong> the OH − impurity to the neighborcalcium atoms. F<strong>in</strong>ally, the relaxations <strong>of</strong> neighbor fluor<strong>in</strong>eatoms are slight and less than 0.4% <strong>of</strong> a 0 .Table 1 also presents the effective charges <strong>of</strong> the OH − andsurround<strong>in</strong>g atoms for Config OH (111) . The total charge <strong>of</strong> theOH − , i.e., the sum <strong>of</strong> the O and H charges, is −0.722 e, be<strong>in</strong>gmuch smaller than the charge <strong>of</strong> the substituted fluor<strong>in</strong>e atom(−0.902 e) by 0.180 e. Around 0.097 and 0.072 e localized onthe four nearest Ca and six second-nearest F, respectively,transfer <strong>in</strong>ward to the OH − . For Configs HO (111) and OH (100) ,the effective charges <strong>of</strong> OH − are −0.713 and −0.737 e, be<strong>in</strong>gclose to the correspond<strong>in</strong>g value <strong>of</strong> Config OH (111) . We alsocalculated the OH − charges <strong>in</strong> Ca(OH) 2 and Ba(OH) 2 crystals.The results show that the total effective charges <strong>of</strong> OH − <strong>in</strong>Ca(OH) 2 and Ba(OH) 2 are equal to −0.781 and −0.825 e,respectively. The OH − charge <strong>in</strong> Ca(OH) 2 is larger than OH −as impurities <strong>in</strong> CaF 2 crystal by around 0.4−0.7 e , and thisphenomenon can be expla<strong>in</strong>ed by the fact that fluor<strong>in</strong>e has astronger oxidative property than that <strong>of</strong> OH − . It is well-knownthat the hydroxyl has a considerable covalency between theoxygen and hydrogen, which is also demonstrated by our bondpopulation calculations for the OH − −CaF 2 systems. Thepresence <strong>of</strong> the covalency <strong>of</strong> OH − <strong>in</strong> CaF 2 is also clearlyshown <strong>in</strong> the charge density map (see Figure 2). The covalentbonds between the oxygen and hydrogen atoms are 486, 508,and 536 me for Configs OH (111) , HO (111) , and OH (100) ,respectively. Compared with the covalent bonds <strong>in</strong> Ca(OH) 2(458 me) and Ba(OH) 2 (434 me) crystals, the covalency <strong>of</strong> theOH − impurities <strong>in</strong> CaF 2 is stronger than that <strong>in</strong> the hydroxidecrystals. Here, we can conclude that OH − as an atomic grouphas a steady geometrical structure <strong>in</strong>stead <strong>of</strong> electronicproperties <strong>in</strong> different materials.Alkal<strong>in</strong>e-earth fluorides with defects degrade their opticalquality and exhibit optical absorption. Our calculations on thedefect levels <strong>in</strong>duced between the valence bands (VBs) andconduction bands (CBs) suggest a possible mechanism for theoptical absorption. In the one-electron approximation scheme,Figure 2. Electron density contours <strong>in</strong> CaF 2 with OH − from the (110)side view, be<strong>in</strong>g from 0 to 0.4 e/bohr 3 with a l<strong>in</strong>ear <strong>in</strong>crement <strong>of</strong> 0.01e/bohr 3 .the experimentally observed optical absorption could be due toan electron transition from the ground state to the empty band<strong>in</strong>duced by the OH − impurities. Our calculated band structureregard<strong>in</strong>g the OH − -impurity system <strong>of</strong> Config OH (111) is shown<strong>in</strong> Figure 3, and the optical band gaps for Configs OH (111) ,Figure 3. Calculated B3PW band structure for the 96-atom supercellmodel<strong>in</strong>g the OH − impurity <strong>in</strong> CaF 2 for Config OH (111) .HO (111) and OH (100) are collected <strong>in</strong> Table 2. The optical bandgaps between the VBs and CBs for the CaF 2 96-atom supercellTable 2. Direct Optical Band Gaps (eV) (Γ → Γ) <strong>of</strong> theOH − -Impurity Systems for Configs OH (111) ,HO (111) , andOH (100)gaps OH (111) HO (111) OH (100)O → H 9.04 8.99 9.04O → CB 9.74 9.78 10.24VB → H 10.47 10.52 10.65VB → CB 11.17 11.32 11.85conta<strong>in</strong><strong>in</strong>g a OH − at the Γ po<strong>in</strong>t are 11.17, 11.32, and 11.85 eVfor Configs OH (111) ,HO (111) , and OH (100) , respectively, be<strong>in</strong>gmuch larger than the relevant gap <strong>of</strong> the perfect CaF 2 crystal(10.96 eV). It is implied that the OH − impurities widen theVB−CB gap, especially for Config OH (100) . For Config OH (111) ,the empty defect level <strong>in</strong>duced by OH − impurities is located0.70 eV below the bottom <strong>of</strong> the CB at the Γ po<strong>in</strong>t (see Figure 3).The occupied defect levels, conta<strong>in</strong><strong>in</strong>g two superposed bands6394dx.doi.org/10.1021/jp211075g | J. Phys. Chem. C 2012, 116, 6392−6400