Ab Initio Calculations of Hydroxyl Impurities in CaF2
Ab Initio Calculations of Hydroxyl Impurities in CaF2
Ab Initio Calculations of Hydroxyl Impurities in CaF2

Create successful ePaper yourself
Turn your PDF publications into a flip-book with our unique Google optimized e-Paper software.
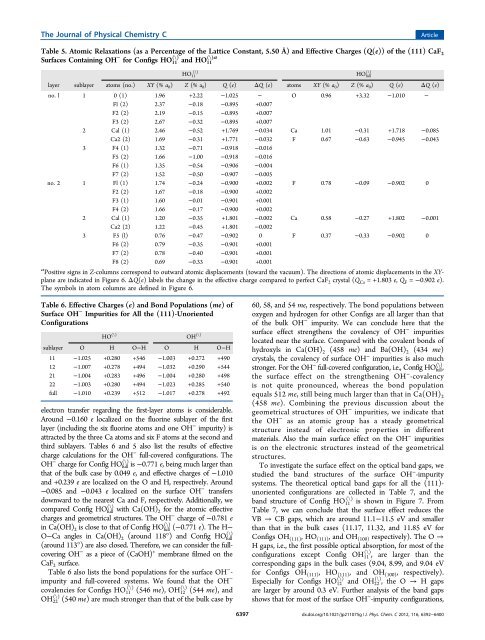
The Journal <strong>of</strong> Physical Chemistry CArticleTable 5. Atomic Relaxations (as a Percentage <strong>of</strong> the Lattice Constant, 5.50 Å) and Effective Charges (Q(e)) <strong>of</strong> the (111) CaF 2Surfaces Conta<strong>in</strong><strong>in</strong>g OH − for Configs HO (\) (\)a11 and HO 11HO 11(\)layer sublayer atoms (no.) XY (% a 0 ) Z (% a 0 ) Q (e) ΔQ (e) atoms XY (% a 0 ) Z (% a 0 ) Q (e) ΔQ (e)no. l 1 0 (1) 1.96 +2.22 −1.025 − O 0.96 +3.32 −1.010 −Fl (2) 2.37 −0.18 −0.895 +0.007F2 (2) 2.19 −0.15 −0.895 +0.007F3 (2) 2.67 −0.32 −0.895 +0.0072 Cal (1) 2.46 −0.52 +1.769 −0.034 Ca 1.01 −0.31 +1.718 −0.085Ca2 (2) 1.69 −0.31 +1.771 −0.032 F 0.67 −0.63 −0.945 −0.0433 F4 (1) 1.32 −0.71 −0.918 −0.016F5 (2) 1.66 −1.00 −0.918 −0.016F6 (1) 1.35 −0.54 −0.906 −0.004F7 (2) 1.52 −0.50 −0.907 −0.005no. 2 1 Fl (1) 1.74 −0.24 −0.900 +0.002 F 0.78 −0.09 −0.902 0F2 (2) 1.67 −0.18 −0.900 +0.002F3 (1) 1.60 −0.01 −0.901 +0.001F4 (2) 1.66 −0.17 −0.900 +0.0022 Cal (1) 1.20 −0.35 +1.801 −0.002 Ca 0.58 −0.27 +1.802 −0.001Ca2 (2) 1.22 −0.45 +1.801 −0.0023 F5 (l) 0.76 −0.47 −0.902 0 F 0.37 −0.33 −0.902 0F6 (2) 0.79 −0.35 −0.901 +0.001F7 (2) 0.78 −0.40 −0.901 +0.001F8 (2) 0.69 −0.33 −0.901 +0.001a Positive signs <strong>in</strong> Z-columns correspond to outward atomic displacements (toward the vacuum). The directions <strong>of</strong> atomic displacements <strong>in</strong> the XYplaneare <strong>in</strong>dicated <strong>in</strong> Figure 6. ΔQ(e) labels the change <strong>in</strong> the effective charge compared to perfect CaF 2 crystal (Q Ca = +1.803 e, Q F = −0.902 e).The symbols <strong>in</strong> atom columns are def<strong>in</strong>ed <strong>in</strong> Figure 6.(\)HO fullTable 6. Effective Charges (e) and Bond Populations (me)<strong>of</strong>Surface OH − <strong>Impurities</strong> for All the (111)-UnorientedConfigurationselectron transfer regard<strong>in</strong>g the first-layer atoms is considerable.Around −0.160 e localized on the fluor<strong>in</strong>e sublayer <strong>of</strong> the firstlayer (<strong>in</strong>clud<strong>in</strong>g the six fluor<strong>in</strong>e atoms and one OH − impurity) isattracted by the three Ca atoms and six F atoms at the second andthird sublayers. Tables 6 and 5 also list the results <strong>of</strong> effectivecharge calculations for the OH − full-covered configurations. TheOH − charge for Config HO (\) full is −0.771 e, be<strong>in</strong>g much larger thanthat <strong>of</strong> the bulk case by 0.049 e, and effective charges <strong>of</strong> −1.010and +0.239 e are localized on the O and H, respectively. Around−0.085 and −0.043 e localized on the surface OH − transfersdownward to the nearest Ca and F, respectively. Additionally, wecompared Config HO (\) full with Ca(OH) 2 for the atomic effectivecharges and geometrical structures. The OH − charge <strong>of</strong> −0.781 e<strong>in</strong> Ca(OH) 2 is close to that <strong>of</strong> Config HO (\) full (−0.771 e). The H−(\)O−Ca angles <strong>in</strong> Ca(OH) 2 (around 118°) and Config HO full(around 113°) are also closed. Therefore, we can consider the fullcover<strong>in</strong>gOH − as a piece <strong>of</strong> (CaOH) + membrane filmed on theCaF 2 surface.Table 6 also lists the bond populations for the surface OH − -impurity and full-covered systems. We found that the OH −covalencies for Configs HO (\) 11 (546 me), OH (\) 12 (544 me), and(\) (540 me) are much stronger than that <strong>of</strong> the bulk case byOH 22HO (\) OH (\)sublayer O H O−H O H O−H11 −1.025 +0.280 +546 −1.003 +0.272 +49012 −1.007 +0.278 +494 −1.032 +0.290 +54421 −1.004 +0.283 +496 −1.004 +0.280 +49822 −1.003 +0.280 +494 −1.023 +0.285 +540full −1.010 +0.239 +512 −1.017 +0.278 +492639760, 58, and 54 me, respectively. The bond populations betweenoxygen and hydrogen for other Configs are all larger than that<strong>of</strong> the bulk OH − impurity. We can conclude here that thesurface effect strengthens the covalency <strong>of</strong> OH − impuritieslocated near the surface. Compared with the covalent bonds <strong>of</strong>hydroxyls <strong>in</strong> Ca(OH) 2 (458 me) and Ba(OH) 2 (434 me)crystals, the covalency <strong>of</strong> surface OH − impurities is also muchstronger. For the OH − full-covered configuration, i.e., Config HO (\) full ,the surface effect on the strengthen<strong>in</strong>g OH − -covalencyis not quite pronounced, whereas the bond populationequals 512 me, still be<strong>in</strong>g much larger than that <strong>in</strong> Ca(OH) 2(458 me). Comb<strong>in</strong><strong>in</strong>g the previous discussion about thegeometrical structures <strong>of</strong> OH − impurities,we<strong>in</strong>dicatethatthe OH − as an atomic group has a steady geometricalstructure <strong>in</strong>stead <strong>of</strong> electronic properties <strong>in</strong> differentmaterials. Also the ma<strong>in</strong> surface effect on the OH − impuritiesis on the electronic structures <strong>in</strong>stead <strong>of</strong> the geometricalstructures.To <strong>in</strong>vestigate the surface effect on the optical band gaps, westudied the band structures <strong>of</strong> the surface OH − -impuritysystems. The theoretical optical band gaps for all the (111)-unoriented configurations are collected <strong>in</strong> Table 7, and theband structure <strong>of</strong> Config HO (\) 11 is shown <strong>in</strong> Figure 7. FromTable 7, we can conclude that the surface effect reduces theVB → CB gaps, which are around 11.1−11.5 eV and smallerthan that <strong>in</strong> the bulk cases (11.17, 11.32, and 11.85 eV forConfigs OH (111) ,HO (111) , and OH (100) respectively). The O →H gaps, i.e., the first possible optical absorption, for most <strong>of</strong> theconfigurations except Config OH (\) 11 , are larger than thecorrespond<strong>in</strong>g gaps <strong>in</strong> the bulk cases (9.04, 8.99, and 9.04 eVfor Configs OH (111) , HO (111) , and OH (100) , respectively).Especially for Configs HO (\) 12 and OH (\) 22 , the O → H gapsare larger by around 0.3 eV. Further analysis <strong>of</strong> the band gapsshows that for most <strong>of</strong> the surface OH − -impurity configurations,dx.doi.org/10.1021/jp211075g | J. Phys. Chem. C 2012, 116, 6392−6400