2013 Annual Report - Investor Relations - Darden Restaurants
2013 Annual Report - Investor Relations - Darden Restaurants
2013 Annual Report - Investor Relations - Darden Restaurants

You also want an ePaper? Increase the reach of your titles
YUMPU automatically turns print PDFs into web optimized ePapers that Google loves.
It ComesWith HighExpectations• Expectations from guests who wantfresh, exciting new experiences and,in many cases, more for less• Expectations from employees whowant us to support their aspirationsand remain a compelling placeto work• Expectations from business partnersand other stakeholders who want usto create social value• Expectations from shareholderswho want continued financialvalue creation
Our Leading BrandsOur Newest BrandBeer is the hook,but the soul of Yard House is the food.To successfully compete in the New Era, we know change is required,and we’re committed to thoughtful change. One of our most visiblechanges is the reshaping of our brand portfolio. Today, <strong>Darden</strong>’sportfolio is well-positioned to drive profitable market share growthand generate competitively superior returns for the next decade.Adding Yard House ® to our Specialty Restaurant Group (SRG) providesus with greater exposure to new guests and new occasions. And itgives SRG the scale and scope to make an even more meaningfulcontribution to our sales and earnings growth going forward.130handles of draft beerYard House combines contemporary American cuisine based onchef-inspired recipes and ethnic flavors with a wide range of draftbeers and other beverages in a stylish and energetic setting. It’s oneof the most distinctive and exciting restaurant brands in Americatoday, and has average unit volumes and returns on capital thatare among the highest in the industry.
Red Lobster ®We’re passionate about serving great seafood. Our fishermen take pride in bringing us onlythe freshest, highest-quality product. Our grill masters expertly perfect the flavors, cookingthe wide variety we offer over our wood fire grill. And our servers pull out all the stops toensure it all adds up to an exceptional dining experience. It’s our passion. It’s our pride.Because at Red Lobster, we Sea Food Differently SM .• $2.6 Billion in Sales• 705 Units• $3.7 Million Average Unit SalesOlive Garden ®Our family of restaurants is committed to providing every guest with a genuine Italian diningexperience. We’re proud to serve fresh, delicious Italian food, paired with great wine, in acomfortable, home-like setting where everyone is welcomed as a member of our family.• $3.7 Billion in Sales• 828 Units• $4.6 Million Average Unit SalesLongHorn Steakhouse ®Known for a passion for grilling fresh, hand-seasoned steaks, we provide guests witha cut-above steakhouse dining experience. Unlike many others, we offer the widestvariety of steak cuts and preparations, including a signature bone-in Outlaw Ribeye ® –all served in a relaxed, warm atmosphere inspired by a rancher’s home.• $1.2 Billion in Sales• 430 Units• $3.0 Million Average Unit Sales®The Specialty Restaurant GroupThe SRG, with its five distinctive brands, adds breadth and provides us with valuableexpertise. That expertise and breadth has been augmented considerably with theaddition of Eddie V’s ® in luxury seafood and Yard House in polished casual dining.Each of the group’s brands is firmly grounded in culinary and beverage innovationand exceptional service.• $986 Million in Sales• 169 Units• $6.7 Million Average Unit Sales
It’s an Era Defined by...ConnectionsOur guests lead increasingly digital lives,giving us more opportunities to connectwith them.QualityGuests aren’t willing to compromise on quality, demanding better offersand experiences.2 <strong>Darden</strong> <strong>Restaurants</strong>, Inc. <strong>2013</strong> <strong>Annual</strong> <strong>Report</strong>AffordabilityMany guests are financiallyconstrained, leaving themwanting more for less.
ConvenienceOur guests lead busy lives,and honoring their preferences fordining experience, whether enjoyingour food in restaurant orat home through takeout,is important.New Guest BehaviorThe growing number of Millennial and multicultural guests is influencing taste andguest experience preferences.<strong>Darden</strong> <strong>Restaurants</strong>, Inc. <strong>2013</strong> <strong>Annual</strong> <strong>Report</strong> 3
To OurShareholders,Employeesand GuestsClarence Otis, Jr.Chairman andChief Executive OfficerOur financial performance in fiscal <strong>2013</strong>was certainly disappointing, with salesand earnings results that were wellbelow what we expected when the yearbegan. As we emerge from the year,however, we have greater clarity aboutwhat we have to do to regain operatingmomentum in fiscal 2014 and remain theleader in our industry long term. We haveto achieve consistent guest traffic growthin existing restaurants. And to do that,we have to deliver guest experiences thatare more responsive to several importantconsumer and competitive realities.We will review our fiscal <strong>2013</strong> financialperformance, then discuss the strengthswe bring to the challenge of reignitingtraffic growth, the consumer and industrydynamics driving the need for change andour response to those dynamics.Fiscal <strong>2013</strong> Financial HighlightsDespite blended same-restaurant salesand traffic declines at our three largebrands (Olive Garden, Red Lobster andLongHorn Steakhouse), we had significanttotal sales growth in fiscal <strong>2013</strong>, due togrowth in sales from new restaurants,same-restaurant sales growth at ourSpecialty Restaurant Group (SRG) andour acquisition of Yard House USA, Inc.on August 29, 2012. However, some ofthe steps we took to mitigate samerestaurantsales and traffic erosion atOlive Garden and Red Lobster and supportcontinued same-restaurant sales andtraffic growth at LongHorn Steakhouseadversely affected margins. In addition,we incurred costs in connection with ouracquisition of Yard House. Because ofthese and other factors, our diluted netearnings per share from continuingoperations declined in fiscal <strong>2013</strong>.• Total sales from continuing operationswere $8.6 billion, a 6.9 percent increasefrom the $8.0 billion generated infiscal 2012. Excluding sales fromYard House, total sales from continuingoperations were $8.3 billion, a 3.7 percentincrease from fiscal 2012.4 <strong>Darden</strong> <strong>Restaurants</strong>, Inc. <strong>2013</strong> <strong>Annual</strong> <strong>Report</strong>
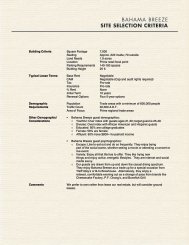
• Total sales growth from continuingoperations in fiscal <strong>2013</strong> reflected acombined U.S. same-restaurant salesdecrease of 1.3 percent for Olive Garden,Red Lobster and LongHorn Steakhouse;a combined U.S. same-restaurant salesincrease of 2.1 percent for our SpecialtyRestaurant Group, including The CapitalGrille ® , Bahama Breeze ® and Seasons 52 ® ,but excluding Eddie V’s and Yard House;3.6 percent of growth compared tofiscal 2012, due to the acquisition of40 Yard House restaurants and fouradditional Yard House openings; and4.4 percent of growth due to the netaddition of 100 other new restaurants.• Net earnings from continuing operationswere $412.6 million in fiscal <strong>2013</strong>, a13.4 percent decrease from net earningsfrom continuing operations of $476.5million in fiscal 2012. Diluted net earningsper share from continuing operationswere $3.14 in fiscal <strong>2013</strong>, a 12.3 percentdecrease from diluted net earningsper share of $3.58 in fiscal 2012. Infiscal <strong>2013</strong>, costs associated with theYard House acquisition reduced netearnings from continuing operations by$12.3 million (on an after-tax basis) anddiluted net earnings per share by $0.09.• Olive Garden’s total sales were $3.68billion, up 2.9 percent from fiscal 2012.This reflected average annual sales perrestaurant of $4.6 million, the additionof 36 net new restaurants and a U.S.same-restaurant sales decrease of1.5 percent.• Red Lobster’s total sales were $2.62billion, a 1.7 percent decrease from fiscal2012. This reflected average annualsales per restaurant of $3.7 million, theaddition of one net new restaurant anda U.S. same-restaurant sales decreaseof 2.2 percent.• LongHorn Steakhouse’s total sales were$1.23 billion, up 10.3 percent from fiscal2012. This reflected average annualsales per restaurant of $3.0 million, theaddition of 44 net new restaurants anda U.S. same-restaurant sales increaseof 1.2 percent.• The Specialty Restaurant Group’s totalsales were $986 million, a 58.3 percentincrease from fiscal 2012, and reflectedstrong growth from our legacy brandsas well as the addition of Yard House.Total sales increased 8.5 percent atThe Capital Grille to $332 million, basedon same-restaurant sales growth of3.3 percent and the addition of threenew restaurants. Total sales increased12.6 percent for Bahama Breeze to$174 million, based on same-restaurantsales growth of 0.2 percent and theaddition of three new restaurants.Total sales increased 23.3 percent atSeasons 52 to $158 million, based onsame-restaurant sales growth of1.2 percent and the addition of eightnew restaurants. Total sales increased84.4 percent at Eddie V’s to $65 million,based on same-restaurant growth of0.7 percent, the addition of one newrestaurant and approximately five monthsof incremental sales compared to fiscal2012 because our acquisition of Eddie V’soccurred in November of fiscal 2012. Inaddition, the acquisition of 40 YardHouse restaurants and opening of anotherfour Yard House restaurants followingAndrew H. MadsenPresident and ChiefOperating Officer<strong>Darden</strong> <strong>Restaurants</strong>, Inc. <strong>2013</strong> <strong>Annual</strong> <strong>Report</strong> 5
<strong>2013</strong> Financial Highlights:Fiscal Year Ended(In Millions, Except Per Share Amounts) May 26, <strong>2013</strong> May 27, 2012 May 29, 2011Sales $ 8,551.9 $ 7,998.7 $ 7,500.2Earnings from Continuing Operations $ 412.6 $ 476.5 $ 478.7Losses from Discontinued Operations, net of tax $ (0.7) $ (1.0) $ (2.4)Net Earnings $ 411.9 $ 475.5 $ 476.3Earnings per Share from Continuing Operations:Basic $ 3.20 $ 3.66 $ 3.50Diluted $ 3.14 $ 3.58 $ 3.41Net Earnings per Share:Basic $ 3.19 $ 3.65 $ 3.48Diluted $ 3.13 $ 3.57 $ 3.39Dividends Paid per Share $ 2.00 $ 1.72 $ 1.28Average Shares Outstanding:Basic 129.0 130.1 136.8Diluted 131.6 133.2 140.3the acquisition added $258 million insales in fiscal <strong>2013</strong>.• We continued to buy back <strong>Darden</strong>common stock, spending $52 millionin fiscal <strong>2013</strong> to repurchase 1 millionshares, before postponing share repurchasein August 2012 because of theacquisition of Yard House. Since ourshare repurchase program began in1995, we have repurchased nearly172 million shares of our commonstock for $3.82 billion.A Strong FoundationAs we look forward, we approach thechallenges ahead with a very strongfoundation. The most important foundationalstrength is our brands, starting withthe three largest. Each has enduring andbroad consumer appeal, which shows intheir number of restaurants, average annualsales per restaurant and restaurant-levelreturns. With respect to average sales perrestaurant, Olive Garden and Red Lobsterhave long been leaders on this importantmeasure, compared to other nationallyadvertised casual dining chains. Thatcontinues to be true, despite a difficultfiscal <strong>2013</strong>. At LongHorn Steakhouse,average sales per restaurant are solid aswell, especially considering that theamount the brand spends on televisionadvertising is a fraction of the amount spentby most nationally advertised chains,including Olive Garden and Red Lobster.In addition, within our Specialty RestaurantGroup, each brand’s average salesper restaurant is among the highest in therestaurant industry, regardless of industrysegment. Importantly, all our brands are ableto translate competitively strong averagesales per restaurant into competitivelysuperior restaurant-level returns.In addition to strong brands, we have acost-effective operating support platform.It is the product of considerable collectiveexpertise and experience in areas that arecritical to success in our business, includingbrand management, restaurant operations,supply chain, talent management andinformation technology. With appealingbrands that have strong restaurant-level6.9%increase in total salesin fiscal <strong>2013</strong>returns and are supported by a costeffectiveoperating platform, we have acompetitively superior operating profitmargin compared to other major chainrestaurant operators with comparable,primarily company-owned businessmodels. The net result is that we havesubstantial and durable operating cashflow. Our operating cash flow has nearlydoubled over the past 10 years, growingto $950 million in fiscal <strong>2013</strong> – or $515,000in pre-tax cash per restaurant – despiteour setbacks during the year. Together,these strengths provide us with a strongfoundation as we respond to the importantconsumer and competitive reali ties that,we believe, amount to a New Era.Operating in a New EraKey Consumer And Competitive DynamicsThe consumer and competitive dynamicsdriving the need for change have been areality for several years. One importantdynamic is that many guests are financiallyconstrained. For some, this is amatter of life stage. These are guestswho are more budget conscious becausethey are young and just entering theworkplace or, at the other end of thespectrum, because they have recentlyretired and are beginning to live on fixedincomes. For other guests, financialconstraint is due to macroeconomic6 <strong>Darden</strong> <strong>Restaurants</strong>, Inc. <strong>2013</strong> <strong>Annual</strong> <strong>Report</strong>
factors having nothing to do with lifestage that are weighing on employmentand income growth. Whatever the reason,the result is a significant number of guestswho increasingly base their restaurantchoices on affordability.At the same time, many other guests arefar from financially constrained. They havechanging tastes and preferences thatreflect rising household incomes and areincreasingly interested in higher-quality,on-trend menu offerings and flexibleexperiences that fit their schedules. Inaddition, both sets of guests – thefinancially constrained and the financiallycomfortable – are increasingly multiculturaland multigenerational, developments thatare also driving meaningful changes intastes and preferences.Given these dynamics, as we enteredfiscal <strong>2013</strong> there had been an approximate2 percent a year decline in totalcasual dining traffic between fiscal 2008,when the most recent recession started,and fiscal 2012. Importantly, major casualdining chains had held up better thancasual dining overall, with cumulativetotal traffic growth of 0.6 percent over thisperiod, fueled in part by a sharp increasein price incentives. In addition, duringthis period <strong>Darden</strong> achieved a significantgain in market share, with our three largebrands experiencing cumulative totaltraffic growth of 10.1 percent.However, below the total traffic growthlevel, a concerning development for majorchains and for us was the steady erosionin same-restaurant traffic over this period.Between fiscal 2008 and fiscal 2012, majorchains had an 18.2 percent decline insame-restaurant traffic on a cumulativebasis. And, while our three large brandsdid better, on a blended basis our samerestauranttraffic declined 7.7 percent ona cumulative basis.…both sets of guests –the financially constrained andthe financially comfortable – areincreasingly multicultural andmultigenerational, developmentsthat are also driving meaningfulchanges in tastes andpreferences.Responding To The DynamicsAs fiscal <strong>2013</strong> began, we had alreadymade a number of changes to address thecon sumer realities behind the samerestauranttraffic erosion the casualdining industry and we were experiencing,and we were planning additional steps.To broaden our guest base, especiallywith more affluent guests and Millenialand Gen X guests, we had been adding toour Specialty Restaurant Group – firstwith the acquisition of Eddie V’s in fiscal2012 and, more significantly, with theacquisition of Yard House, which was inthe due diligence stage early in fiscal <strong>2013</strong>and completed at the very beginning ofthe second quarter. In addition, each ofour three large casual dining brands hadaffordability initiatives planned for fiscal<strong>2013</strong>, with a focus on both our promotionaloffers and core menus.At the <strong>Darden</strong> level, we had launchedseveral initiatives to address consumerinterests beyond affordability thatcontinued during fiscal <strong>2013</strong>. In fiscal2012, for example, we developed amultiyear plan to enhance our technologycapabilities so we will be able to engageas fully as possible with guests as theylead increasingly digital lifestyles, andwe planned to begin implementing thefirst phase in fiscal <strong>2013</strong>. We had alsoestablished an enterprise Marketinggroup to focus on developing moreextensive, multiyear initiatives to reshapethe guest experiences we offer, andplanned to begin implementing severalof these in fiscal <strong>2013</strong> as well. We alsorecognized the need to reshape ourMarketing and Operations teams at eachbrand so that we could be brilliant withthe basics today, while also moving fasterto make enduring changes to the guestexperiences we offer in the future. As aresult, coming into fiscal <strong>2013</strong> we wererethinking how we should organizeour large brands’ Marketing andOperations teams.Accelerating Change In Fiscal <strong>2013</strong>As fiscal <strong>2013</strong> unfolded, it quicklybecame clear that the degree and paceof change we had planned for the yearwas insufficient. In the fourth quarter offiscal 2012, for the first quarter since thestart of the recent recession in fiscal2008, blended same-restaurant traffic atour three large brands lagged the industry.As we continued to have weaker than theindustry results on this important profitablesales growth driver in the first twoquarters of fiscal <strong>2013</strong>, we moved withadded urgency on a number of fronts.We began to match competitive promotionalintensity around affordability,which involved being more aggressivewith the pricing of our offers, placinggreater emphasis on price in our advertisingmessages and being more active in theuse of tactics such as daily and weeklydigital specials to support our offers.We also stepped up the emphasis onaffordability in our core menus, whichincluded launching with heavy mediasupport of a new core menu at Red Lobsterthat has a significant affordabilitycomponent and accelerating theintroduction of new, more affordablypriced core menu offerings at Olive Gardenand LongHorn Steakhouse.Just as importantly, we increased theresources dedicated to reshaping ourguest experiences to respond to whatguests want beyond affordability. Amongother things, this included moving forward<strong>Darden</strong> <strong>Restaurants</strong>, Inc. <strong>2013</strong> <strong>Annual</strong> <strong>Report</strong> 7
more quickly with the reorganization ofthe Marketing and Operations teams atour three large brands and ramping upinvestment in enhancing our digital andtargeted marketing capabilities.Our same-restaurant traffic results in thethird and fourth quarters of fiscal <strong>2013</strong>are evidence that these steps provided uswith some traction. In the third quarter,our results matched the results for theindustry, although it was not a strongquarter, given the magnitude of the trafficdecline for us and for the industry. In thefourth quarter, however, we achievedsolid same-restaurant traffic growth, andour results were well ahead of those forthe industry, which had a decline.There is no question that there wasconsiderable cost associated with thechanges we made. Many of our promotionaland core menu affordability effortsinvolved margin pressure and, in somecases, there was more pressure than weinitially anticipated. In addition, as wereorganized Marketing and Operations,which involved putting tenured leaders innew places and adding new leaders, therewas some adverse effect on execution thatlikely resulted in meaningful but difficultto-measurecost. And, of course, therewere the direct costs of the technologyand other investments in additionalcapabilities that we made. However,we firmly believe that, given the criticalityof arresting the same-restaurant trafficerosion we have been experiencing,these were costs worth incurring.Looking ForwardAs we look forward to fiscal 2014 andbeyond, our top priority is to reestablishconsistent same-restaurant traffic growth.And to achieve this goal we must respondmore quickly and more effectively to theconsumer and competitive dynamics thatdefine our industry today.…we are investing in aselect few initiatives to reshapethe guest experiences we providein ways that further respondto the dynamics that arethe New Era.As a result, we are tempering checkaverage growth in fiscal 2014 becausewe think that is necessary to supporttraffic growth in the near term. As we doso, we are refining our affordability tacticsbased on what we learned during fiscal<strong>2013</strong> to moderate the margin pressurethat often comes with lower check growth.In addition, we are significantly reducingnew restaurant expansion at Olive Garden,going from the 35 to 40 net new openingswe have had each year for the past fewyears to approximately 15. With thischange, we believe the brand can betterfocus on regaining same-restauranttraffic momentum and on making theguest experience changes required forsustained success.Finally, we are continuing to make otherinvestments in future success. Morespecifically, we are investing in a selectfew initiatives to reshape the guestexperiences we provide in ways that furtherrespond to the dynamics that are the NewEra. These include offering small plates atOlive Garden that can be enjoyed individuallyas a more affordable appetizer choiceor combined to create a customized meal,introducing more up-to-date seafoodoptions at Red Lobster like shrimp tacosand lobster tacos, and adding a newChef’s Showcase section at LongHornthat highlights innovative and distinctivenew items. In addition, we are investing totransition to the new healthcare landscapein a way that maintains strong employeeengagement. And, we are continuingto invest in commercializing lobsteraquaculture because such a breakthroughcan help preserve Red Lobster’s abilityto provide guests with price-accessibleofferings for years to come.ConclusionAs we make the changes required tooperate successfully in a New Era, wehave the needed resources. We havestrong brands, considerable collectiveexpertise and experience and a costeffectiveoperating support platform.Most important, we have a winning culture,with people who remain highly engageddespite a difficult fiscal <strong>2013</strong>. A measureof the strength of our culture is ourrecognition by FORTUNE magazine in<strong>2013</strong> for the third consecutive year as oneof the “100 Best Companies to Work For .”We are particularly proud because selectionrelies on an independently administeredsurvey of employees – which, in our case,are largely hourly restaurant employees –and <strong>Darden</strong> is the only restaurant companyto receive such recognition.Looking forward, the strong culture andwonderful people we have at <strong>Darden</strong> arethe single biggest reasons why we areconfident we will successfully make thechanges required to better compete todayand remain the industry leader tomorrow.Thank you for being a stakeholder.Clarence Otis, Jr.Chairman and Chief Executive OfficerAndrew MadsenPresident and Chief Operating Officer8 <strong>Darden</strong> <strong>Restaurants</strong>, Inc. <strong>2013</strong> <strong>Annual</strong> <strong>Report</strong>
What We Bringto the New Era...
We Bring Proven andStable Cash GenerationWith the considerable operating cash flow generated bytwo multibillion-dollar brands, not only is <strong>Darden</strong> able toappropriately reinvest in our business, but we are alsoable to return considerable capital to our shareholders.10 <strong>Darden</strong> <strong>Restaurants</strong>, Inc. <strong>2013</strong> <strong>Annual</strong> <strong>Report</strong>
Red LobsterRed Lobster is focusing moreon affordability and value in itspromotions and on its core menu.To win in the New Era, we have to reinvestto protect the broad appeal of our brandsand sustainably grow same-restauranttraffic. As we reinvest, Olive Garden andRed Lobster are guided by three broadstrategic priorities; 1) addressing theheightened market share contest withincasual dining by responding moreaggressively to the elevated guest needfor affordability – while being careful notto dilute our brands or guest experiences;2) delivering our current guest experiencesat a competitively superior level moreconsistently within each of our restaurantsand across our restaurant systems; and3) meaningfully innovating and redefiningour guest experiences in ways that makethem more attractive to new guests andfor new occasions.Olive Garden’s broad appeal and powerfulunit economics are the key reasons why ithas grown to over 800 locations generating$3.7 billion in total sales and average unitsales volumes of $4.6 million. As a result,Olive Garden’s annual cash contribution to<strong>Darden</strong> exceeds $455 million. In fiscal 2014,Olive Garden will reduce new restaurantexpansion to 15 net new restaurants fromthe 36 opened last year, in order to betterfocus on regaining sales momentumand consistently delivering a high-qualityguest experience in existing restaurants.Red Lobster continues to have a businessmodel that creates significant value, withannual sales of $2.6 billion and averageunit sales volumes of $3.7 million. As aresult, Red Lobster’s annual cash contributionto <strong>Darden</strong> is more than $200 million.In fiscal 2014, Red Lobster will continueits Bar Harbor remodel program, which itexpects to complete in early fiscal 2015,while opening one net new restaurant.Olive Garden and Red Lobster’s annualcash contributions, after appropriatereinvestment to ensure success in theNew Era, are the foundation for <strong>Darden</strong>’sstrong and consistent return of capitalto shareholders through the combinationof dividends and share repurchase.To win in the New Era,we have to reinvest toprotect the broad appealof our brands andsustainably growsame-restaurant traffic.Olive GardenOnline To Go ordering is oneway Olive Garden is evolvingthe guest experience.<strong>Darden</strong> <strong>Restaurants</strong>, Inc. <strong>2013</strong> <strong>Annual</strong> <strong>Report</strong> 11
We Bring Ready-to-GrowDining ConceptsWith our LongHorn and Specialty Restaurant Group (SRG) brands,we will continue to expand in the New Era.12 <strong>Darden</strong> <strong>Restaurants</strong>, Inc. <strong>2013</strong> <strong>Annual</strong> <strong>Report</strong>
Bahama BreezeBahama Breeze is well-positionedwith strong Gen X, Millennial andmulticultural appeal.With total sales of$986 million, SRG hasthe potential to deliver17 to 19 percenttotal sales growtheach year.LongHorn is well positioned to becomea national brand with 600 to 800 restaurantsgenerating $2 billion to $2.5billion in annual sales. Today, with morethan 400 restaurants, average unit salesvolumes of $3.0 million and $1.2 billionin annual sales, the brand is more thanhalfway there. And LongHorn generatesenough cash to not only fund its ownexpansion, but also reinvest in enhancingits brand and sustainably growingsame-restaurant traffic. In fiscal 2014,LongHorn will continue its journeytoward national penetration withapproximately 37 to 40 net newunit openings.With the recent additions of two populargrowth brands – Eddie V’s in luxuryseafood and Yard House in polishedcasual dining – SRG is positioned tomake a significant contribution to<strong>Darden</strong>’s annual sales and operatingprofit growth. Each brand in the groupgenerates high average unit salesvolumes – $8.2 million at Yard House,$7.0 million at The Capital Grille, $6.2million at Seasons 52, $5.8 million atEddie V’s and $5.5 million at BahamaBreeze – and collectively they producesufficient cash to fund nearly all thegroup’s new restaurant growth. Thegroup has nearly doubled the numberof restaurants from 89 to 169 with theaddition of Eddie V’s and Yard House,and plans to open 25 to 27 net newrestaurants in fiscal 2014.With total sales of $986 million, SRG hasthe potential to deliver 17 to 19 percenttotal sales growth each year, driven bysame-restaurant sales growth of 2 to4 percent and new restaurant growth of15 percent. We anticipate that this levelof sales growth will contribute 35 to40 percent of <strong>Darden</strong>’s total annual salesgrowth in the future. In fiscal 2014, totalsales for the group are expected to exceed$1.2 billion.Eddie V’sEddie V’s features classic, fine diningservice in a contemporary andvibrant atmosphere.Seasons 52Seasons 52’s seasonally inspired menu isthe foundation of an on-trend brand thatgenerates strong guest loyalty.<strong>Darden</strong> <strong>Restaurants</strong>, Inc. <strong>2013</strong> <strong>Annual</strong> <strong>Report</strong> 13
We Bring an Ever-EvolvingOperational BaseThe collective expertise of our talented restaurant operations teamsenables us to provide world-class service to over 1 million guestson a daily basis. As one of the world’s largest restaurant operatingcompanies, we understand that to provide outstanding guestexperiences, having top-notch support teams is vital for success.Operationally, our approach is to ensure we take full advantage of thecollective experience, knowledge, leadership and dedication ofour teams to consistently nourish and delight everyone we serve.14 <strong>Darden</strong> <strong>Restaurants</strong>, Inc. <strong>2013</strong> <strong>Annual</strong> <strong>Report</strong>
Restaurant Support CenterEmployees of our Restaurant SupportCenter are focused on ensuring ourrestaurant teams have what they needto succeed every day.Recently, we have taken steps to ensurethat, in an ever-changing operatingenvironment, we continue to have a highlevel of operational effectiveness. Duringthe first quarter of fiscal <strong>2013</strong>, we transitionedto a new operations leadershipstructure outside our restaurants thathas our Senior Vice Presidents leadingfewer but larger geographic divisions.While these leaders remain accountablefor competitively superior execution in ourrestaurants today, with the changes we’vemade they are also now able to spend moretime defining the operational changes,innovations and standards required torespond effectively to the elevated demandswe know our guests will have tomorrow.What provides our Senior Vice Presidentswith more time to spend ensuring we wintomorrow is the addition of a new leadershipposition, the Managing Director.Specialty Restaurant GroupThe Specialty Restaurant Groupleverages <strong>Darden</strong>’s supply chainexpertise to procure the most basicto the most sophisticated products.Each of these leaders is responsible for50 to 70 restaurants and is able to moreproactively provide timely coaching anddirection to our Directors of Operations,who each lead 7 to 10 restaurants.The management structure within ourrestaurants has been refined as well.There is now a full-time, dedicated Staffingand Training Manager in each restaurantwho is focused solely on ensuring therestaurant is fully staffed, employeesare effectively trained and schedules areconsistently aligned with the needs of thebusiness. This enables the restaurant’sCulinary and Service Manager to focusexclusively on ensuring we consistentlydelight our guests with exceptional foodand attentive service that exceeds expectations.We also created new full-timehourly roles within each restaurant to helpthe restaurant’s managers effectivelycover all shifts and that also providesmore formalized paths to management forour highest-potential hourly employees.We believe our enhanced operationalstructures, combined with the talentand experience levels of our restaurantoperations teams, positions us wellto elevate day-to-day operational excellencein our restaurants, respond moreeffectively to future guest demands andbuild an even stronger talent bench forthe future.Recently, we havetaken steps to ensure that,in an ever-changing operatingenvironment, we continue to havea high level of operationaleffectiveness.<strong>Darden</strong> <strong>Restaurants</strong>, Inc. <strong>2013</strong> <strong>Annual</strong> <strong>Report</strong> 15
We Bring a DemonstratedCommitment to Citizenship15%We seek to reduce our energy andwater use by 15 percent by 2015and one day send zero wasteto landfills.We aspire to be a company that positivelyaffects our guests, employees, communitiesand business partners – quite simply,to be a company that matters. With morethan 2,100 restaurants and 200,000employees, our scope and scale enableus to positively affect the economic, socialand environmental challenges facing ourcommunities and the world. Our effortsLOW RES PULLEDFROM WEBSITE -DARSUSTAINABILITY SITEWILL NEED HI RES ORREPLACEMeeting NeedsIn fiscal year <strong>2013</strong>,<strong>Darden</strong>’s 2,138 restaurantscontributed nearly 11 million poundsof food to local food banksacross the United Statesand Canada.16are anchored in several core pillar areaswhere we feel we can have the most impact.They include:• <strong>Darden</strong> Harvest Program: Hunger isan issue in every community where wedo business. Our restaurants donatewholesome, surplus food to local communityfood banks and soup kitchensacross the country. Since fiscal 2003,we’ve donated more than 66 millionpounds of food to those in need.• Good Neighbor Grants: We partnerwith local community organizations tohelp address priorities expressed byour guests and employees. The cornerstoneof this effort is our RestaurantCommunity Grants program where every<strong>Darden</strong> restaurant can help award a$1,000 grant to a non-profit organizationin its local community. In fiscal <strong>2013</strong>,we awarded $1.9 million to nearly 900non-profits.• Preservation of Natural Resources: Weare actively committed to sustainability –starting with our own operations. Wehave aggressive goals to reduce waterand electricity consumption in ourrestaurants by 15 percent by fiscal 2015.We’ve already exceeded our water goalwith a 17 percent reduction since makingthe commitment and we’re well on ourway to meeting our energy goal witha 12 percent reduction to date. Since2008, we also expanded recycling, fooddonations and grease recycling in aneffort to reach zero waste. We investedsignificant time and resources intoseafood sustainability and empowered10,000-plus restaurant employeesto identify new ways to improve thesustainability performance of ourrestaurants. <strong>Darden</strong> is also committedto partnering with others, includingour suppliers, policymakers and nongovernmentalorganizations to findcollective solutions for sustainability,and we have worked with the WorldBank, the New England Aquarium,Clinton Global Initiative, the SustainabilityConsortium and many others.Making sure we are transparent inour sustainability efforts is key as well,as demonstrated by our second Global<strong>Report</strong>ing Initiative report and thereporting we do via social media.• Health and Wellness: Our companyis addressing one of the top healthchallenges facing our society today –obesity. Working with the Partnershipfor a Healthier America, <strong>Darden</strong> hascommitted to reducing the overallcalorie and sodium footprints of ourmenus by 10 percent by fiscal 2016and 20 percent by fiscal 2021, andto enhance the nutrition credentialsof our children’s menus.
18Management’sDiscussion and Analysisof Financial Conditionand Results ofOperations32<strong>Report</strong> ofManagement’sResponsibilities<strong>2013</strong>FinancialReviewComparison of Five-Year Total Return for <strong>Darden</strong> <strong>Restaurants</strong>, Inc.,S&P 500 Stock Index and S&P <strong>Restaurants</strong> Index$300$ 0• <strong>Darden</strong> <strong>Restaurants</strong>, Inc. • S&P 500 Stock Index • S&P <strong>Restaurants</strong> Index$100.00$227.63$195.37$134.19May-08 May-09 May-10 May-11 May-12 May-135/25/08 5/31/09 5/30/10 5/29/11 5/27/12 5/26/13<strong>Darden</strong> <strong>Restaurants</strong>, Inc. $100.00 $ 117.12 $142.84 $174.55 $188.57 $195.37S&P 500 Stock Index $100.00 $ 68.65 $ 83.06 $103.52 $104.72 $ 134.19S&P <strong>Restaurants</strong> Index $100.00 $100.29 $126.24 $165.52 $206.02 $227.6332Management’s <strong>Report</strong>on Internal Control OverFinancial <strong>Report</strong>ing33<strong>Report</strong> of IndependentRegistered PublicAccounting Firmon Internal Control OverFinancial <strong>Report</strong>ing34<strong>Report</strong> of IndependentRegistered PublicAccounting Firm35ConsolidatedStatements ofEarnings35ConsolidatedStatements ofComprehensiveIncome36ConsolidatedBalance Sheets37ConsolidatedStatements of Changesin Stockholders’ Equity38ConsolidatedStatements ofCash Flows39Notes to ConsolidatedFinancial Statements66Five-Year FinancialSummary<strong>Darden</strong> <strong>Restaurants</strong>, Inc. <strong>2013</strong> <strong>Annual</strong> <strong>Report</strong> 17
Management’s Discussion and Analysisof Financial Condition and Results of Operations<strong>Darden</strong>This discussion and analysis below for <strong>Darden</strong> <strong>Restaurants</strong>, Inc. (<strong>Darden</strong>, theCompany, we, us or our) should be read in conjunction with our consolidatedfinancial statements and related financial statement notes found elsewhere inthis report. We operate on a 52/53 week fiscal year, which ends on the last Sundayin May. Fiscal <strong>2013</strong>, 2012 and 2011 each consisted of 52 weeks of operation.OVERVIEW OF OPERATIONSOur business operates in the full-service dining segment of the restaurant industry,primarily in the United States. At May 26, <strong>2013</strong>, we operated 2,138 Olive Garden®,Red Lobster®, LongHorn Steakhouse®, The Capital Grille®, Yard House®, BahamaBreeze®, Seasons 52®, Eddie V’s Prime Seafood® and Wildfish Seafood Grille®restaurants in the United States and Canada. Through subsidiaries, we own andoperate all of our restaurants in the United States and Canada, except for threerestaurants located in Central Florida and three restaurants in California that areowned jointly by us and third parties, and managed by us, and five franchisedrestaurants in Puerto Rico. We also have area development and franchise agreementswith unaffiliated operators to develop and operate our brands in Japan,the Middle East and Latin America. Pursuant to these agreements, as of May 26,<strong>2013</strong>, 37 franchised restaurants were in operation in Japan, the Middle East,Puerto Rico and Mexico.On August 29, 2012, we completed the acquisition of Yard House USA, Inc.(Yard House) for $585.0 million in cash. The acquired operations of Yard Houseincluded 40 restaurants that are included in the results of operations in ourconsolidated financial statements from the date of acquisition.Our mission is to be the best in full-service dining, now and for generations.We believe we can achieve this goal by continuing to build on our strategy to bea multi-brand restaurant growth company, which is grounded in:• Brand relevance;• Brand support;• A vibrant business model;• Competitively superior leadership; and• A unifying, motivating culture.We seek to increase profits by leveraging our fixed and semi-fixed costs withsales from new restaurants and increased guest traffic and sales at existing restaurants.To evaluate our operations and assess our financial performance, we monitora number of operating measures, with a special focus on two key factors:• Same-restaurant sales – which is a year-over-year comparison of eachperiod’s sales volumes for restaurants open at least 16 months, includingrecently acquired restaurants, regardless of when the restaurants wereacquired; and• Restaurant earnings – which is restaurant-level profitability (restaurantsales, less restaurant-level cost of sales, marketing and depreciation).Increasing same-restaurant sales can improve restaurant earnings becausethese incremental sales provide better leverage of our fixed and semi-fixedrestaurant-level costs. A restaurant brand can generate same-restaurant salesincreases through increases in guest traffic, increases in the average guest check,or a combination of the two. The average guest check can be impacted by menuprice changes and by the mix of menu items sold. For each restaurant brand, wegather daily sales data and regularly analyze the guest traffic counts and themix of menu items sold to aid in developing menu pricing, product offerings andpromotional strategies. We view same-restaurant guest counts as a measure ofthe long-term health of a restaurant brand, while increases in average check andmenu mix may contribute more significantly to near-term profitability. We focuson balancing our pricing and product offerings with other initiatives to producesustainable same-restaurant sales growth.We compute same-restaurant sales using restaurants open at least 16 monthsbecause this period is generally required for new restaurant sales levels to normalize.Sales at newly opened restaurants generally do not make a significantcontribution to profitability in their initial months of operation due to operatinginefficiencies. Our sales and expenses can be impacted significantly by the numberand timing of new restaurant openings and closings, relocation and remodeling ofexisting restaurants. Pre-opening expenses each period reflect the costs associatedwith opening new restaurants in current and future periods.Fiscal <strong>2013</strong> Financial HighlightsOur sales from continuing operations were $8.55 billion in fiscal <strong>2013</strong> comparedto $8.00 billion in fiscal 2012. The 6.9 percent increase was primarily driven bythe addition of 104 net new company-owned restaurants plus the addition of40 Yard House purchased restaurants and a 2.1 percent blended same-restaurantsales increase for The Capital Grille, Bahama Breeze and Seasons 52, partiallyoffset by the 1.3 percent blended same-restaurant sales decrease for Olive Garden,Red Lobster and LongHorn Steakhouse.Net earnings from continuing operations for fiscal <strong>2013</strong> were $412.6 million($3.14 per diluted share) compared with net earnings from continuing operationsfor fiscal 2012 of $476.5 million ($3.58 per diluted share). Net earningsfrom continuing operations for fiscal <strong>2013</strong> decreased 13.4 percent and dilutednet earnings per share from continuing operations decreased 12.3 percentcompared with fiscal 2012.Our net losses from discontinued operations were $0.7 million ($0.01 perdiluted share) for fiscal <strong>2013</strong>, compared with net losses from discontinuedoperations of $1.0 million ($0.01 per diluted share) for fiscal 2012. When combinedwith results from continuing operations, our diluted net earnings pershare were $3.13 and $3.57 for fiscal <strong>2013</strong> and 2012, respectively.Outlook and StrategyWe expect blended U.S. same-restaurant sales in fiscal 2014 to range from flat toan increase of 2.0 percent for Olive Garden, Red Lobster and LongHorn Steakhouse.Including the impact from operations of Yard House, we expect fiscal 2014 totalsales to increase between 6.0 percent and 8.0 percent. We expect food and beverageexpenses to be higher as a percent of sales based on our expectations of foodcost inflation. We also expect restaurant labor expenses to be higher as a percentof sales based on our expectations that manager incentive compensation willreturn to normal levels and the anticipated costs associated with implementationof the Affordable Care Act. We expect our remaining expense line items, restaurantexpenses, selling, general and administrative expenses and depreciation expense,to be relatively flat as a percent of sales. We expect diluted net earnings per share18 <strong>Darden</strong> <strong>Restaurants</strong>, Inc. <strong>2013</strong> <strong>Annual</strong> <strong>Report</strong>
Management’s Discussion and Analysisof Financial Condition and Results of Operations<strong>Darden</strong>from continuing operations for fiscal 2014 to be below fiscal <strong>2013</strong> by 3.0 percent to5.0 percent. In fiscal 2014, we expect to add approximately 80 net new restaurants,and we expect capital expenditures will be between $600.0 million and $650.0 million,including approximately $15.0 million in information technology initiatives.In June <strong>2013</strong>, we announced a quarterly dividend of $0.55 per share, payableon August 1, <strong>2013</strong>. Previously, our quarterly dividend was $0.50 per share, or $2.00per share on an annual basis. Based on the $0.55 quarterly dividend declaration,our expected annual dividend is $2.20 per share, a 10.0 percent increase. Dividendsare subject to the approval of the Company’s Board of Directors and, accordingly,the timing and amount of our dividends are subject to change.To support future growth, we are striving to change in two important ways:we are modifying our organizational structure so we can better leverage ourexisting experience and expertise, and we are adding new expertise in additionalareas that are critical to future success. In the past three years we have createdenterprise-level marketing and restaurant operations units and establishedforward-looking strategy units in certain functions. We have initiatives focusingon our Specialty Restaurant Group, enterprise-level sales building, digital guestand employee engagement, health and wellness, and centers of excellence. Tomaintain strong brand relevance and strengthen guest experience and loyalty,we are moving forward with a multi-year program to build and leverage a singledigital technology platform. We plan to grow by leveraging our expertise andnew capabilities to increase same-restaurant sales and increase the numberof restaurants in each of our existing brands. We also continue to pursue otheravenues of new business development, including franchising our restaurantsoutside of the U.S. and Canada, testing “synergy restaurants” and other formatsto expand our brands, and selling consumer packaged goods such as Olive Garden’ssalad dressing and Red Lobster’s Cheddar Bay Biscuit Mix.The total sales growth we envision should increase the cost-effectivenessof our support platform. However, we also plan to supplement our conventionalincremental year-to-year cost management efforts with an ongoing focus onidentifying and pursuing transformational multi-year cost reduction opportunities.In fiscal 2014, we plan to continue to implement three transformationalinitiatives – further automating our supply chain, significantly reducing theuse of energy, water and cleaning supplies in our restaurants and optimizinglabor costs within our restaurants.There are significant risks and challenges that could impact our operationsand ability to increase sales and earnings. The full-service restaurant industry isintensely competitive and sensitive to economic cycles and other business factors,including changes in consumer tastes and dietary habits. Other risks anduncertainties are discussed and referenced in the subsection below entitled“Forward-Looking Statements.”RESULTS OF OPERATIONS FOR FISCAL <strong>2013</strong>, 2012AND 2011The following table sets forth selected operating data as a percent of sales fromcontinuing operations for the fiscal years ended May 26, <strong>2013</strong>, May 27, 2012 andMay 29, 2011. This information is derived from the consolidated statements ofearnings found elsewhere in this report.Fiscal Years<strong>2013</strong> 2012 2011Sales 100.0% 100.0% 100.0%Costs and expenses:Cost of sales:Food and beverage 30.7 30.8 29.0Restaurant labor 31.5 31.3 32.0Restaurant expenses 15.7 15.0 15.1Total cost of sales, excluding restaurantdepreciation and amortization of4.4%, 4.1% and 3.9%, respectively 77.9% 77.1% 76.1%Selling, general and administrative 9.9 9.2 9.9Depreciation and amortization 4.6 4.4 4.2Interest, net 1.5 1.3 1.2Total costs and expenses 93.9% 92.0% 91.4%Earnings before income taxes 6.1 8.0 8.6Income taxes 1.3 2.0 2.2Earnings from continuing operations 4.8 6.0 6.4Losses from discontinued operations,net of taxes – (0.1) –Net earnings 4.8% 5.9% 6.4%The following table details the number of company-owned restaurantscurrently reported in continuing operations that were open at the end of fiscal<strong>2013</strong>, compared with the number open at the end of fiscal 2012 and the end offiscal 2011.May 26, <strong>2013</strong> May 27, 2012 May 29, 2011Red Lobster – USA 678 677 670Red Lobster – Canada 27 27 28Total 705 704 698Olive Garden – USA 822 786 748Olive Garden – Canada 6 6 6Total 828 792 754LongHorn Steakhouse 430 386 354The Capital Grille 49 46 44Bahama Breeze 33 30 26Seasons 52 31 23 17Eddie V’s (1) 12 11 –Yard House (1) 44 – –Other (2) 6 2 1Total 2,138 1,994 1,894(1) Includes the 11 Eddie V’s and Wildfish restaurants acquired on November 14, 2011 and the 40 Yard Houserestaurants acquired on August 29, 2012.(2) Represents synergy restaurants that combine two existing brands in one building.<strong>Darden</strong> <strong>Restaurants</strong>, Inc. <strong>2013</strong> <strong>Annual</strong> <strong>Report</strong> 19
Management’s Discussion and Analysisof Financial Condition and Results of Operations<strong>Darden</strong>improved wage-rate management and lower manager incentive compensation,partially offset by an increase in FICA taxes on higher reported tips. The increase inFICA tax expense on higher reported tips is fully offset in our consolidated earningsfrom continuing operations by a corresponding income tax credit, which reducesincome tax expense. Manager incentive compensation paid out at approximately65.0 percent of the targeted amount in fiscal <strong>2013</strong>, as compared to 84.0 percentand 93.0 percent in fiscal 2012 and 2011, respectively.Restaurant expenses (which include utilities, repairs and maintenance, creditcard, lease, property tax, workers’ compensation, new restaurant pre-opening andother restaurant-level operating expenses) increased $133.8 million, or 11.1 percent,from $1.20 billion in fiscal 2012 to $1.33 billion in fiscal <strong>2013</strong>. Restaurant expensesincreased $71.6 million, or 6.3 percent, from $1.13 billion in fiscal 2011 to$1.20 billion in fiscal 2012. As a percent of sales, restaurant expenses increasedin fiscal <strong>2013</strong> as compared to fiscal 2012 primarily as a result of Yard House’s higherrestaurant expenses as a percentage of sales compared to our consolidated averageprior to the acquisition. Additionally, restaurant expenses as a percentage of salesincreased due to lost sales leverage, partially offset by lower utilities expenses.As a percent of sales, restaurant expenses decreased in fiscal 2012 as comparedto fiscal 2011 primarily due to sales leveraging and lower credit card fees partiallyoffset by higher workers’ compensation costs.Selling, general and administrative expenses increased $101.0 million, or13.5 percent, from $746.8 million in fiscal 2012 to $847.8 million in fiscal <strong>2013</strong>.Selling, general and administrative expenses increased $4.1 million, or 0.6 percent,from $742.7 million in fiscal 2011 to $746.8 million in fiscal 2012. As a percent ofsales, selling, general and administrative expenses increased from fiscal 2012 tofiscal <strong>2013</strong> primarily due to higher media costs and acquisition and integrationcosts associated with the Yard House acquisition, partially offset by sales leverageand lower performance-based compensation. As a percent of sales, selling,general and administrative expenses decreased from fiscal 2011 to fiscal 2012primarily due to sales leveraging, lower performance incentive compensationand favorable market-driven changes in fair value related to our non-qualifieddeferred compensation plans, partially offset by higher media costs.Depreciation and amortization expense increased $45.7 million, or 13.1 percent,from $349.1 million in fiscal 2012 to $394.8 million in fiscal <strong>2013</strong>. Depreciation andamortization expense increased $32.3 million, or 10.2 percent, from $316.8 millionin fiscal 2011 to $349.1 million in fiscal 2012. As a percent of sales, depreciationand amortization expense increased in fiscal <strong>2013</strong> primarily due to an increase indepreciable assets related to new restaurants and remodel activities. As a percentof sales, depreciation and amortization expense increased in fiscal 2012 primarilydue to an increase in depreciable assets related to new restaurants and remodelactivities, partially offset by sales leveraging.Net interest expense increased $24.3 million, or 23.9 percent, from$101.6 million in fiscal 2012 to $125.9 million in fiscal <strong>2013</strong>. Net interest expenseincreased $8.0 million, or 8.5 percent, from $93.6 million in fiscal 2011 to$101.6 million in fiscal 2012. As a percent of sales, net interest expense increasedin fiscal <strong>2013</strong> compared to fiscal 2012 due to higher average debt balances in fiscal<strong>2013</strong> principally driven by the acquisition of Yard House. As a percent of sales, netinterest expense increased in fiscal 2012 compared to fiscal 2011 due to higheraverage debt balances in fiscal 2012, partially offset by sales leveraging.INCOME TAXESThe effective income tax rates for fiscal <strong>2013</strong>, 2012 and 2011 continuing operationswere 21.0 percent, 25.3 percent and 26.1 percent, respectively. The decrease in oureffective rate for fiscal <strong>2013</strong> is primarily attributable to an increase in the impactof FICA tax credits for employee reported tips due to a decrease in our earningsbefore income taxes and the impact of market-driven changes in the value of ourtrust-owned life insurance that are excluded for tax purposes, partially offset by adecrease in federal income tax credits related to the HIRE Act. The decrease in oureffective rate for fiscal 2012 is primarily attributable to an increase in federal incometax credits related to the HIRE Act, an increase in the impact of FICA tax credits foremployee reported tips, partially offset by the impact of market-driven changesin the value of our trust-owned life insurance that are excluded for tax purposes.NET EARNINGS AND NET EARNINGS PER SHAREFROM CONTINUING OPERATIONSNet earnings from continuing operations for fiscal <strong>2013</strong> were $412.6 million($3.14 per diluted share) compared with net earnings from continuing operationsfor fiscal 2012 of $476.5 million ($3.58 per diluted share) and net earnings fromcontinuing operations for fiscal 2011 of $478.7 million ($3.41 per diluted share).Net earnings from continuing operations for fiscal <strong>2013</strong> decreased 13.4 percentand diluted net earnings per share from continuing operations decreased 12.3 percentcompared with fiscal 2012, primarily due to higher selling, general andadministrative expenses, restaurant expenses, depreciation and amortizationexpenses and net interest expense as a percent of sales, partially offset by increasedsales and a lower effective income tax rate. Costs associated with the Yard Houseacquisition adversely affected diluted net earnings per share from continuingoperations by approximately $0.09.Net earnings from continuing operations for fiscal 2012 decreased 0.5 percentand diluted net earnings per share from continuing operations increased 5.0 percentcompared with fiscal 2011. The decrease in net earnings from continuing operationswas primarily due to higher food and beverage costs and depreciation andamortization expense as a percent of sales, which were partially offset by increasedsales, lower restaurant labor expenses, and selling, general and administrativeexpenses as a percent of sales, and a lower effective income tax rate. While netearnings from continuing operations decreased, diluted net earnings per sharefrom continuing operations increased for fiscal 2012 due to a reduction in theaverage diluted shares outstanding primarily as a result of the cumulative impactof our continuing repurchase of our common stock.LOSSES FROM DISCONTINUED OPERATIONSOn an after-tax basis, losses from discontinued operations for fiscal <strong>2013</strong> were$0.7 million ($0.01 per diluted share) compared with losses from discontinuedoperations for fiscal 2012 of $1.0 million ($0.01 per diluted share) and fiscal 2011of $2.4 million ($0.02 per diluted share).<strong>Darden</strong> <strong>Restaurants</strong>, Inc. <strong>2013</strong> <strong>Annual</strong> <strong>Report</strong> 21
Management’s Discussion and Analysisof Financial Condition and Results of Operations<strong>Darden</strong>SEASONALITYOur sales volumes fluctuate seasonally. During fiscal <strong>2013</strong>, our average sales perrestaurant were highest in the spring and winter, followed by the summer, andlowest in the fall. During fiscal 2012 and 2011, our average sales per restaurantwere highest in the winter and spring, followed by the summer, and lowest in thefall. Holidays, changes in the economy, severe weather and similar conditionsmay impact sales volumes seasonally in some operating regions. Because of theseasonality of our business, results for any quarter are not necessarily indicativeof the results that may be achieved for the full fiscal year.IMPACT OF INFLATIONWe attempt to minimize the annual effects of inflation through appropriate planning,operating practices and menu price increases. We do not believe inflation had asignificant overall effect on our annual results of operations during fiscal <strong>2013</strong>or fiscal 2011. However, we experienced higher than normal inflationary costsduring fiscal 2012 and were able to partially reduce the annual impact utilizingthese strategies.CRITICAL ACCOUNTING POLICIESWe prepare our consolidated financial statements in conformity with U.S. generallyaccepted accounting principles. The preparation of these financial statementsrequires us to make estimates and assumptions that affect the reported amountsof assets and liabilities and disclosure of contingent assets and liabilities at thedate of the financial statements and the reported amounts of sales and expensesduring the reporting period. Actual results could differ from those estimates.Our significant accounting policies are more fully described in Note 1 to theconsolidated financial statements. However, certain of our accounting policiesthat are considered critical are those we believe are both most important to theportrayal of our financial condition and operating results and require our mostdifficult, subjective or complex judgments, often as a result of the need to makeestimates about the effect of matters that are inherently uncertain. Judgments anduncertainties affecting the application of those policies may result in materiallydifferent amounts being reported under different conditions or using differentassumptions. We consider the following policies to be most critical in understandingthe judgments that are involved in preparing our consolidated financial statements.Land, Buildings and EquipmentLand, buildings and equipment are recorded at cost less accumulated depreciation.Building components are depreciated over estimated useful lives ranging from7 to 40 years using the straight-line method. Leasehold improvements, which arereflected on our consolidated balance sheets as a component of buildings in land,buildings and equipment, net, are amortized over the lesser of the expected leaseterm, including cancelable option periods, or the estimated useful lives of the relatedassets using the straight-line method. Equipment is depreciated over estimateduseful lives ranging from 2 to 10 years, also using the straight-line method.Our accounting policies regarding land, buildings and equipment, includingleasehold improvements, include our judgments regarding the estimated usefullives of these assets, the residual values to which the assets are depreciated oramortized, the determination of what constitutes expected lease term and thedetermination as to what constitutes enhancing the value of or increasing thelife of existing assets. These judgments and estimates may produce materiallydifferent amounts of reported depreciation and amortization expense if differentassumptions were used. As discussed further below, these judgments mayalso impact our need to recognize an impairment charge on the carrying amountof these assets as the cash flows associated with the assets are realized, or as ourexpectations of estimated future cash flows change.LeasesWe are obligated under various lease agreements for certain restaurants. Foroperating leases, we recognize rent expense on a straight-line basis over theexpected lease term, including option periods as described below. Capital leasesare recorded as an asset and an obligation at an amount equal to the presentvalue of the minimum lease payments during the lease term.Within the provisions of certain of our leases, there are rent holidays andescalations in payments over the base lease term, as well as renewal periods. Theeffects of the holidays and escalations have been reflected in rent expense on astraight-line basis over the expected lease term, which includes cancelable optionperiods we are reasonably assured to exercise because failure to exercise suchoptions would result in an economic penalty to the Company. The lease termcommences on the date when we have the right to control the use of the leasedproperty, which is typically before rent payments are due under the terms of thelease. The leasehold improvements and property held under capital leases for eachrestaurant facility are amortized on the straight-line method over the shorter of theestimated life of the asset or the same expected lease term used for lease accountingpurposes. Many of our leases have renewal periods totaling 5 to 20 years,exercisable at our option, and require payment of property taxes, insurance andmaintenance costs in addition to the rent payments. The consolidated financialstatements reflect the same lease term for amortizing leasehold improvements aswe use to determine capital versus operating lease classifications and in calculatingstraight-line rent expense for each restaurant. Percentage rent expense isgenerally based upon sales levels and is accrued when we determine that it isprobable that such sales levels will be achieved. Landlord allowances are recordedbased on contractual terms and are included in accounts receivable, net and as adeferred rent liability and amortized as a reduction of rent expense on a straightlinebasis over the expected lease term.Our judgments related to the probable term for each restaurant affect theclassification and accounting for leases as capital versus operating, the rent holidaysand escalation in payments that are included in the calculation of straight-line rentand the term over which leasehold improvements for each restaurant facilityare amortized. These judgments may produce materially different amounts ofdepreciation, amortization and rent expense than would be reported if differentassumed lease terms were used.Impairment of Long-Lived AssetsLand, buildings and equipment and certain other assets, including definite-livedintangible assets, are reviewed for impairment whenever events or changes incircumstances indicate that the carrying amount of an asset may not be recoverable.Recoverability of assets to be held and used is measured by a comparisonof the carrying amount of the assets to the future undiscounted net cash flowsexpected to be generated by the assets. Identifiable cash flows are measured atthe lowest level for which they are largely independent of the cash flows of othergroups of assets and liabilities, generally at the restaurant level. If these assets are22 <strong>Darden</strong> <strong>Restaurants</strong>, Inc. <strong>2013</strong> <strong>Annual</strong> <strong>Report</strong>
Management’s Discussion and Analysisof Financial Condition and Results of Operations<strong>Darden</strong>determined to be impaired, the amount of impairment recognized is measuredby the amount by which the carrying amount of the assets exceeds their fair value.Fair value is generally determined by appraisals or sales prices of comparable assets.Restaurant sites and certain other assets to be disposed of are reported at the lowerof their carrying amount or fair value, less estimated costs to sell. Restaurant sitesand certain other assets to be disposed of are included in assets held for sale withinprepaid expenses and other current assets in our consolidated balance sheets whencertain criteria are met. These criteria include the requirement that the likelihoodof disposing of these assets within one year is probable. For assets that meet theheld-for-sale criteria, we separately evaluate whether those assets also meet therequirements to be reported as discontinued operations. Principally, if we discontinuecash flows and no longer have any significant continuing involvement withrespect to the operations of the assets, we classify the assets and related resultsof operations as discontinued. We consider guest transfer (an increase in guestsat another location as a result of the closure of a location) as continuing cashflows and evaluate the significance of expected guest transfer when evaluatinga restaurant for discontinued operations reporting. To the extent we dispose ofenough assets where classification between continuing operations and discontinuedoperations would be material to our consolidated financial statements,we utilize the reporting provisions for discontinued operations. Assets whosedisposal is not probable within one year remain in land, buildings and equipmentuntil their disposal within one year is probable.We account for exit or disposal activities, including restaurant closures, inaccordance with Financial Accounting Standards Board (FASB) Accounting StandardsCodification (ASC) Topic 420, Exit or Disposal Cost Obligations. Such costs includethe cost of disposing of the assets as well as other facility-related expenses frompreviously closed restaurants. These costs are generally expensed as incurred.Additionally, at the date we cease using a property under an operating lease, werecord a liability for the net present value of any remaining lease obligations, netof estimated sublease income. Any subsequent adjustments to that liability as aresult of lease termination or changes in estimates of sublease income are recordedin the period incurred. Upon disposal of the assets, primarily land, associated witha closed restaurant, any gain or loss is recorded in the same caption within ourconsolidated statements of earnings as the original impairment.The judgments we make related to the expected useful lives of long-livedassets and our ability to realize undiscounted cash flows in excess of the carryingamounts of these assets are affected by factors such as the ongoing maintenanceand improvements of the assets, changes in economic conditions, changes in usageor operating performance, desirability of the restaurant sites and other factors,such as our ability to sell our assets held for sale. As we assess the ongoing expectedcash flows and carrying amounts of our long-lived assets, significant adversechanges in these factors could cause us to realize a material impairment loss. Duringfiscal <strong>2013</strong>, we recognized long-lived asset impairment charges of $0.8 million($0.5 million net of tax), primarily related to the write-down of assets held fordisposition based on updated valuations. During fiscal 2012, we recognizedlong-lived asset impairment charges of $0.5 million ($0.3 million net of tax),primarily related to the permanent closure of one Red Lobster restaurant, and thewrite-down of assets held for disposition based on updated valuations. Duringfiscal 2011 we recognized long-lived asset impairment charges of $4.7 million($2.9 million net of tax), primarily related to the permanent closure of two RedLobster restaurants, the write-down of another Red Lobster restaurant based onan evaluation of expected cash flows, and the write-down of assets held fordisposition based on updated valuations. These costs are included in selling,general and administrative expenses as a component of earnings from continuingoperations in the accompanying consolidated statements of earnings for fiscal<strong>2013</strong>, 2012 and 2011. Impairment charges were measured based on the amountby which the carrying amount of these assets exceeded their fair value.Valuation and Recoverability of Goodwill and TrademarksWe review our goodwill and trademarks for impairment annually, as of the firstday of our fiscal fourth quarter, or more frequently if indicators of impairment exist.Goodwill and trademarks are not subject to amortization and have been assignedto reporting units for purposes of impairment testing. The reporting units areour restaurant brands. At May 26, <strong>2013</strong> and May 27, 2012, we had goodwill of$908.3 million and $538.6 million, respectively. At May 26, <strong>2013</strong> and May 27, 2012,we had trademarks of $573.8 million and $464.9 million, respectively.A significant amount of judgment is involved in determining if an indicator ofimpairment has occurred. Such indicators may include, among others: a significantdecline in our expected future cash flows; a sustained, significant decline inour stock price and market capitalization; a significant adverse change in legalfactors or in the business climate; unanticipated competition; the testing forrecoverability of a significant asset group within a reporting unit; and slowergrowth rates. Any adverse change in these factors could have a significant impacton the recoverability of these assets and could have a material impact on ourconsolidated financial statements.The goodwill impairment test involves a two-step process. The first step is acomparison of each reporting unit’s fair value to its carrying value. We estimatefair value using the best information available, including market information anddiscounted cash flow projections (also referred to as the income approach). Theincome approach uses a reporting unit’s projection of estimated operating resultsand cash flows that is discounted using a weighted-average cost of capital thatreflects current market conditions. The projection uses management’s best estimatesof economic and market conditions over the projected period includinggrowth rates in sales, costs and number of units, estimates of future expectedchanges in operating margins and cash expenditures. Other significant estimatesand assumptions include terminal value growth rates, future estimates of capitalexpenditures and changes in future working capital requirements. We validate ourestimates of fair value under the income approach by comparing the values tofair value estimates using a market approach. A market approach estimates fairvalue by applying cash flow and sales multiples to the reporting unit’s operatingperformance. The multiples are derived from comparable publicly traded companieswith similar operating and investment characteristics of the reporting units.If the fair value of the reporting unit is higher than its carrying value, goodwillis deemed not to be impaired, and no further testing is required. If the carryingvalue of the reporting unit is higher than its fair value, there is an indication thatimpairment may exist and the second step must be performed to measure theamount of impairment loss. The amount of impairment is determined by comparingthe implied fair value of reporting unit goodwill to the carrying value ofthe goodwill in the same manner as if the reporting unit was being acquired in abusiness combination. Specifically, we would allocate the fair value to all of theassets and liabilities of the reporting unit, including any unrecognized intangibleassets, in a hypothetical analysis that would calculate the implied fair value ofgoodwill. If the implied fair value of goodwill is less than the recorded goodwill,we would record an impairment loss for the difference.<strong>Darden</strong> <strong>Restaurants</strong>, Inc. <strong>2013</strong> <strong>Annual</strong> <strong>Report</strong> 23
Management’s Discussion and Analysisof Financial Condition and Results of Operations<strong>Darden</strong>Unearned RevenuesUnearned revenues represent our liability for gift cards that have been sold butnot yet redeemed. We recognize sales from our gift cards when the gift card isredeemed by the customer. Although there are no expiration dates or dormancyfees for our gift cards, based on our historical gift card redemption patterns, wecan reasonably estimate the amount of gift cards for which redemption isremote, which is referred to as “breakage.” We recognize breakage within salesfor unused gift card amounts in proportion to actual gift card redemptions,which is also referred to as the “redemption recognition” method. The estimatedvalue of gift cards expected to go unused is recognized over the expected periodof redemption as the remaining gift card values are redeemed. Utilizing thismethod, we estimate both the amount of breakage and the time period ofredemption. If actual redemption patterns vary from our estimates, actual giftcard breakage income may differ from the amounts recorded. We update ourestimate of our breakage rate periodically and apply that rate to gift cardredemptions. Changing our breakage-rate assumption on unredeemed giftcards by 10.0 percent of the current rate would result in an adjustment in ourunearned revenues of approximately $28.0 million.Income TaxesWe estimate certain components of our provision for income taxes. These estimatesinclude, among other items, depreciation and amortization expense allowablefor tax purposes, allowable tax credits for items such as taxes paid on reportedemployee tip income, effective rates for state and local income taxes and the taxdeductibility of certain other items. We adjust our annual effective income taxrate as additional information on outcomes or events becomes available.FASB ASC Topic 740, Income Taxes, requires that a position taken or expectedto be taken in a tax return be recognized (or derecognized) in the financial statementswhen it is more likely than not (i.e., a likelihood of more than 50 percent)that the position would be sustained upon examination by tax authorities. Arecognized tax position is then measured at the largest amount of benefit thatis greater than 50 percent likely of being realized upon ultimate settlement.We provide for federal and state income taxes currently payable as well asfor those deferred because of temporary differences between reporting incomeand expenses for financial statement purposes versus tax purposes. Federal incometax credits are recorded as a reduction of income taxes. Deferred tax assets andliabilities are recognized for the future tax consequences attributable to differencesbetween the financial statement carrying amounts of existing assets andliabilities and their respective tax bases. Deferred tax assets and liabilities aremeasured using enacted tax rates expected to apply to taxable income in the yearsin which those temporary differences are expected to be recovered or settled. Theeffect on deferred tax assets and liabilities of a change in tax rates is recognizedin earnings in the period that includes the enactment date. Interest recognized onreserves for uncertain tax positions is included in interest, net in our consolidatedstatements of earnings. A corresponding liability for accrued interest is included asa component of other current liabilities on our consolidated balance sheets. Penalties,when incurred, are recognized in selling, general and administrative expenses.We base our estimates on the best available information at the time that weprepare the provision. We generally file our annual income tax returns severalmonths after our fiscal year end. For U.S. federal income tax purposes, we participatein the Internal Revenue Service’s (IRS) Compliance Assurance Process (CAP)whereby our U.S. federal income tax returns are reviewed by the IRS both prior toand after their filing. During fiscal <strong>2013</strong>, we were placed on CAP Maintenance bythe IRS, signaling our strong relationship of transparency and trust with the IRSteam. The U.S. federal income tax returns that we filed through the fiscal yearended May 29, 2011 have been audited by the IRS. In the first quarter of fiscal<strong>2013</strong>, the IRS issued a partial acceptance letter for the fiscal year ended May 27,2012 tax return. The outstanding item as of the end of the current fiscal yearrelates to our deductibility of the Domestic Manufacturing Deduction underIRC Section 199, and is expected to be completed by the second quarter of fiscal2014. The IRS commenced examination of our U.S. federal income tax returnsfor May 26, <strong>2013</strong> in the first quarter of fiscal <strong>2013</strong>. The examination is anticipatedto be completed by the second quarter of fiscal 2015. Income tax returns aresubject to audit by state and local governments, generally years after the returnsare filed. These returns could be subject to material adjustments or differinginterpretations of the tax laws. The major jurisdictions in which the Companyfiles income tax returns include the U.S. federal jurisdiction, Canada, and allstates in the U.S. that have an income tax. With a few exceptions, the Companyis no longer subject to U.S. federal income tax examinations by tax authorities foryears before fiscal 2012, and state and local, or non-U.S. income tax examinationsby tax authorities for years before fiscal 2009.Included in the balance of unrecognized tax benefits at May 26, <strong>2013</strong> is$18.6 million related to tax positions for which it is reasonably possible that thetotal amounts could change during the next 12 months based on the outcome ofexaminations. The $18.6 million relates to items that would impact our effectiveincome tax rate.LIQUIDITY AND CAPITAL RESOURCESCash flows generated from operating activities provide us with a significantsource of liquidity, which we use to finance the purchases of land, buildings andequipment for new restaurants, remodel existing restaurants, pay dividends toour shareholders and repurchase shares of our common stock. Since substantiallyall of our sales are for cash and cash equivalents, and accounts payable aregenerally due in 5 to 30 days, we are able to carry current liabilities in excess ofcurrent assets. In addition to cash flows from operations, we use a combinationof long-term and short-term borrowings to fund our capital needs.We currently manage our business and financial ratios to maintain aninvestment grade bond rating, which has historically allowed flexible accessto financing at reasonable costs. Currently, our publicly issued long-term debtcarries “Baa2” (Moody’s <strong>Investor</strong>s Service), “BBB” (Standard & Poor’s) and “BBB”(Fitch) ratings. Our commercial paper has ratings of “P-2” (Moody’s <strong>Investor</strong>sService), “A-2” (Standard & Poor’s) and “F-2” (Fitch). These ratings are as of the dateof the filing of this annual report and have been obtained with the understandingthat Moody’s <strong>Investor</strong>s Service, Standard & Poor’s and Fitch will continue tomonitor our credit and make future adjustments to these ratings to the extentwarranted. The ratings are not a recommendation to buy, sell or hold our securities,may be changed, superseded or withdrawn at any time and should be evaluatedindependently of any other rating.<strong>Darden</strong> <strong>Restaurants</strong>, Inc. <strong>2013</strong> <strong>Annual</strong> <strong>Report</strong> 25
Management’s Discussion and Analysisof Financial Condition and Results of Operations<strong>Darden</strong>We maintain a $750.0 million revolving Credit Agreement (Revolving CreditAgreement), with Bank of America, N.A. (BOA) as administrative agent, and thelenders and other agents party thereto. The Revolving Credit Agreement is asenior unsecured credit commitment to the Company and contains customaryrepresentations and affirmative and negative covenants (including limitationson liens and subsidiary debt and a maximum consolidated lease adjusted totaldebt to total capitalization ratio of 0.75 to 1.00) and events of default customaryfor credit facilities of this type. As of May 26, <strong>2013</strong>, we were in compliance withthe covenants under the Revolving Credit Agreement.The Revolving Credit Agreement matures on October 3, 2016, and the proceedsmay be used for commercial paper back-up, working capital and capital expenditures,the refinancing of certain indebtedness, certain acquisitions and generalcorporate purposes. Loans under the Revolving Credit Agreement bear interest ata rate of LIBOR plus a margin determined by reference to a ratings-based pricinggrid (Applicable Margin), or the base rate (which is defined as the higher of theBOA prime rate or the Federal Funds rate plus 0.500 percent) plus the ApplicableMargin. Assuming a “BBB” equivalent credit rating level, the Applicable Marginunder the Revolving Credit Agreement will be 1.075 percent for LIBOR loans and0.075 percent for base rate loans.As of May 26, <strong>2013</strong>, we had no outstanding balances under the RevolvingCredit Agreement. As of May 26, <strong>2013</strong>, $164.5 million of commercial paper wasoutstanding, which was backed by this facility. After consideration of commercialpaper backed by the Revolving Credit Agreement, as of May 26, <strong>2013</strong>, we had$585.5 million of credit available under the Revolving Credit Agreement.On October 4, 2012, we issued $450.0 million aggregate principal amountof unsecured 3.350 percent senior notes due November 2022 (the New SeniorNotes) under a registration statement filed with the Securities and ExchangeCommission (SEC) on October 6, 2010. Discount and issuance costs, whichtotaled $4.7 million, are being amortized over the term of the New Senior Notesusing the straight-line method, the results of which approximate the effectiveinterest method. Interest on the New Senior Notes is payable semi-annually inarrears on May 1 and November 1 of each year, and commenced May 1, <strong>2013</strong>. Wemay redeem the New Senior Notes at any time in whole or from time to time inpart, at the principal amount plus a make-whole premium. If we experience achange in control triggering event, unless we have previously exercised our rightto redeem the New Senior Notes, we may be required to purchase the NewSenior Notes from the holders at a purchase price equal to 101 percent of theirprincipal amount plus accrued and unpaid interest.On August 22, 2012, we entered into a Term Loan Agreement (the Term LoanAgreement) with BOA, as administrative agent, and the lenders and other agentsparty thereto. During the second quarter of fiscal <strong>2013</strong>, we made borrowingsunder this agreement in a total aggregate principal amount of $300.0 million.The Term Loan Agreement is a senior unsecured term loan commitment to theCompany and contains customary representations, events of default and affirmativeand negative covenants (including limitations on liens and subsidiary debtand a maximum consolidated lease adjusted total debt to total capitalizationratio of 0.75 to 1.00) for facilities of this type.The Term Loan Agreement matures on August 22, 2017, and the proceedsmay be used for the refinancing of certain indebtedness, certain acquisitions andgeneral corporate purposes. The loans under the Term Loan Agreement are subjectto annual amortization of principal of 5 percent, 5 percent, 5 percent and 85 percent,payable on the second, third, fourth and fifth anniversaries, respectively, of theeffective date of the Term Loan Agreement. Additional information regardingterms and conditions of the Term Loan Agreement is incorporated by referencefrom Note 9 to our consolidated financial statements in Part II, Item 8 of this report.On August 28, 2012, we closed on the issuance of $80.0 million unsecured3.790 percent senior notes due August 2019 and $220.0 million unsecured4.520 percent senior notes due August 2024, pursuant to a Note Purchase Agreementdated June 18, 2012. The Note Purchase Agreement contains customary representations,events of default and affirmative and negative covenants (includinglimitations on liens and priority debt and a maximum consolidated total debt tocapitalization ratio of 0.75 to 1.00, as such may be adjusted in certain circumstances)for facilities of this type.On May 15, <strong>2013</strong> we repaid, prior to maturity, a $4.9 million unsecuredcommercial bank loan which was used to support a loan from us to the EmployeeStock Ownership Plan portion of the <strong>Darden</strong> Savings Plan.At May 26, <strong>2013</strong>, our long-term debt consisted principally of:• $100.0 million of unsecured 7.125 percent debentures due in February 2016;• $300.0 million unsecured, variable-rate term loan maturing in August 2017;• $500.0 million of unsecured 6.200 percent senior notes due in October 2017;• $80.0 million of unsecured 3.790 percent senior notes due in August 2019;• $400.0 million of unsecured 4.500 percent senior notes due in October 2021;• $450.0 million of unsecured 3.350 percent senior notes due in November 2022;• $220.0 million of unsecured 4.520 percent senior notes due in August 2024;• $150.0 million of unsecured 6.000 percent senior notes due in August2035; and• $300.0 million of unsecured 6.800 percent senior notes due in October 2037.The interest rates on our $500.0 million 6.200 percent senior notes dueOctober 2017 and $300.0 million 6.800 percent senior notes due October 2037are subject to adjustment from time to time if the debt rating assigned to suchseries of notes is downgraded below a certain rating level (or subsequentlyupgraded). The maximum adjustment is 2.000 percent above the initial interestrate and the interest rate cannot be reduced below the initial interest rate. As ofMay 26, <strong>2013</strong>, no adjustments to these interest rates had been made.All of our long-term debt currently outstanding is expected to be repaidentirely at maturity with interest being paid semi-annually over the life of thedebt. The aggregate maturities of long-term debt for each of the five fiscal yearssubsequent to May 26, <strong>2013</strong> and thereafter are $0.0 million in fiscal 2014,$15.0 million in fiscal 2015, $115.0 million in fiscal 2016, $15.0 million infiscal 2017, $755.0 million in fiscal 2018 and $1.6 billion thereafter.From time to time we enter into interest rate derivative instruments to manageinterest rate risk inherent in our operations. See Note 10 to our consolidatedfinancial statements in Part II, Item 8 of this report, incorporated herein by reference.Through our shelf registration statement on file with the SEC, depending onconditions prevailing in the public capital markets, we may issue unsecured debtsecurities from time to time in one or more series, which may consist of notes,debentures or other evidences of indebtedness in one or more offerings.We may from time to time repurchase our outstanding debt in privatelynegotiated transactions. Such repurchases, if any, will depend on prevailingmarket conditions, our liquidity requirements and other factors.26 <strong>Darden</strong> <strong>Restaurants</strong>, Inc. <strong>2013</strong> <strong>Annual</strong> <strong>Report</strong>
Management’s Discussion and Analysisof Financial Condition and Results of Operations<strong>Darden</strong>A summary of our contractual obligations and commercial commitments at May 26, <strong>2013</strong>, is as follows:Payments Due by Period(in millions) Less Than 1-3 3-5 More ThanContractual Obligations Total 1 Year Years Years 5 YearsShort-term debt $ 164.5 $ 164.5 $ – $ – $ –Long-term debt (1) 3,817.8 119.0 369.0 974.5 2,355.3Operating leases 1,163.3 186.0 341.7 268.9 366.7Purchase obligations (2) 635.4 581.1 54.3 – –Capital lease obligations (3) 89.5 5.4 11.2 11.6 61.3Benefit obligations (4) 477.4 25.1 79.2 90.4 282.7Unrecognized income tax benefits (5) 31.1 19.1 6.5 5.5 –Total contractual obligations $6,379.0 $1,100.2 $861.9 $1,350.9 $3,066.0Amount of Commitment Expiration per Period(in millions) Total Amounts Less Than 1-3 3-5 More ThanOther Commercial Commitments Committed 1 Year Years Years 5 YearsStandby letters of credit (6) $127.6 $127.6 $ – $ – $ –Guarantees (7) 4.2 1.1 1.9 0.8 0.4Total commercial commitments $131.8 $128.7 $1.9 $0.8 $0.4(1) Includes interest payments associated with existing long-term debt, including the current portion. Variable-rate interest payments associated with the term loan were estimated based on an average interest rate of 2.1 percent. Excludesissuance discount of $5.7 million.(2) Includes commitments for food and beverage items and supplies, capital projects, information technology and other miscellaneous commitments.(3) Includes total imputed interest of $35.1 million over the life of the capital lease obligations.(4) Includes expected contributions associated with our defined benefit plans and payments associated with our postretirement benefit plan and our non-qualified deferred compensation plan through fiscal 2023.(5) Includes interest on unrecognized income tax benefits of $1.2 million, $0.5 million of which relates to contingencies expected to be resolved within one year.(6) Includes letters of credit for $107.0 million of workers’ compensation and general liabilities accrued in our consolidated financial statements, letters of credit for $0.6 million of lease payments included in the contractual operating leaseobligation payments noted above and other letters of credit totaling $20.0 million.(7) Consists solely of guarantees associated with leased properties that have been assigned to third parties. We are not aware of any non-performance under these arrangements that would result in our having to perform in accordance withthe terms of the guarantees.<strong>Darden</strong> <strong>Restaurants</strong>, Inc. <strong>2013</strong> <strong>Annual</strong> <strong>Report</strong> 27
Management’s Discussion and Analysisof Financial Condition and Results of Operations<strong>Darden</strong>Our fixed-charge coverage ratio, which measures the number of times eachyear that we earn enough to cover our fixed charges, amounted to 3.7 times and5.0 times, on a continuing operations basis, for the fiscal years ended May 26, <strong>2013</strong>and May 27, 2012, respectively. Our adjusted debt to adjusted total capital ratio(which includes 6.25 times the total annual minimum rent of $164.3 million and$136.6 million for the fiscal years ended May 26, <strong>2013</strong> and May 27, 2012, respectively,as components of adjusted debt and adjusted total capital) was 65 percentand 62 percent at May 26, <strong>2013</strong> and May 27, 2012, respectively. We include thelease-debt equivalent and contractual lease guarantees in our adjusted debt toadjusted total capital ratio reported to shareholders, as we believe its inclusionbetter represents the optimal capital structure that we target from period toperiod and because it is consistent with the calculation of the covenant underour Revolving Credit Agreement.Based on these ratios, we believe our financial condition is strong. Thecomposition of our capital structure is shown in the following table.May 26, May 27,(In millions, except ratios) <strong>2013</strong> 2012CAPITAL STRUCTUREShort-term debt $ 164.5 $ 262.7Current portion long-term debt – 350.0Long-term debt, excluding unamortized discounts 2,501.9 1,459.1Capital lease obligations 54.4 56.0Total debt $2,720.8 $2,127.8Stockholders’ equity 2,059.5 1,842.0Total capital $4,780.3 $3,969.8CALCULATION OF ADJUSTED CAPITALTotal debt $2,720.8 $2,127.8Lease-debt equivalent 1,026.9 853.8Guarantees 4.2 5.4Adjusted debt $3,751.9 $2,987.0Stockholders’ equity 2,059.5 1,842.0Adjusted total capital $5,811.4 $4,829.0CAPITAL STRUCTURE RATIOSDebt to total capital ratio 57% 54%Adjusted debt to adjusted total capital ratio 65% 62%Net cash flows provided by operating activities from continuing operationswere $949.5 million, $762.2 million and $894.7 million in fiscal <strong>2013</strong>, 2012and 2011, respectively. Net cash flows provided by operating activities includenet earnings from continuing operations of $412.6 million, $476.5 million and$478.7 million in fiscal <strong>2013</strong>, 2012 and 2011, respectively. Net cash flows providedby operating activities from continuing operations increased in fiscal <strong>2013</strong> primarilydue to the timing of inventory purchases as a result of our strategy initiated infiscal 2012 to take ownership of our inventory earlier in the supply chain to ensurea more secure and efficient supply of inventory to our restaurants. Net cash flowsprovided by operating activities reflect income tax payments of $98.5 million,$123.5 million and $126.4 million in fiscal <strong>2013</strong>, 2012 and 2011, respectively.The lower tax payments in fiscal <strong>2013</strong>, as compared with tax payments in fiscal2012 and 2011, primarily relates to the recognition of tax benefits related to thetiming of deductions for fixed-asset related expenditures and the application ofthe overpayment of income taxes in prior years to fiscal <strong>2013</strong> tax liabilities.Net cash flows used in investing activities from continuing operations were$1,290.4 million, $721.6 million and $552.7 million in fiscal <strong>2013</strong>, 2012 and 2011,respectively. Net cash flows used in investing activities from continuing operationsincluded capital expenditures incurred principally for building new restaurants,remodeling existing restaurants, replacing equipment, and technology initiatives.Capital expenditures related to continuing operations were $685.6 millionin fiscal <strong>2013</strong>, compared to $639.7 million in fiscal 2012 and $547.7 million infiscal 2011. The increasing trend of expenditures in fiscal <strong>2013</strong> and 2012 resultsprimarily from increases in remodel and new restaurant activity over the pasttwo years. Additionally, net cash used in the acquisitions of Yard House in fiscal<strong>2013</strong> and Eddie V’s in fiscal 2012 was $577.4 million and $58.5 million, respectively.Net cash flows provided by financing activities from continuing operationswere $355.4 million in fiscal <strong>2013</strong>, compared to net cash flows used in financingactivities from continuing operations of $40.4 million and $521.0 million in fiscal2012 and 2011, respectively. During fiscal <strong>2013</strong>, we closed on the issuance of$300.0 million of senior notes, received funding from a $300.0 million term loanand completed the offering of $450.0 million of senior notes, resulting in netproceeds of $445.3 million, which were used to effectively refinance the$350.0 million of long-term notes that we repaid at maturity during fiscal <strong>2013</strong>.Repayments of long-term debt were $355.9 million, $2.1 million and $226.8 millionin fiscal <strong>2013</strong>, 2012 and 2011, respectively. Net repayments of short-term debtwere $98.1 million in fiscal <strong>2013</strong> while net proceeds from the issuance of short-termdebt were $77.2 million and $185.5 million in fiscal 2012 and 2011, respectively.For fiscal <strong>2013</strong>, net cash flows used in financing activities included our repurchaseof 1.0 million shares of our common stock for $52.4 million, compared to 8.2 millionshares of our common stock for $375.1 million in fiscal 2012 and 8.6 millionshares of our common stock for $385.5 million in fiscal 2011. As of May 26, <strong>2013</strong>,our Board of Directors had authorized us to repurchase up to 187.4 million sharesof our common stock and a total of 171.9 million shares had been repurchasedunder the authorization. The repurchased common stock reduces stockholders’equity. As of May 26, <strong>2013</strong>, our unused authorization was 15.5 million shares.We received proceeds primarily from the issuance of common stock upon theexercise of stock options of $64.4 million, $70.2 million and $63.0 million in fiscal<strong>2013</strong>, 2012 and 2011, respectively. Net cash flows used in financing activities alsoincluded dividends paid to stockholders of $258.2 million, $223.9 million and$175.5 million in fiscal <strong>2013</strong>, 2012 and 2011, respectively. The increase in dividendpayments reflects the increase in our annual dividend rate from $1.28 per sharein fiscal 2011, to $1.72 per share in fiscal 2012 and to $2.00 per share in fiscal<strong>2013</strong>. In June <strong>2013</strong>, our Board of Directors approved an increase in the quarterlydividend to $0.55 per share, which indicates an annual dividend of $2.20 pershare in fiscal 2014.28 <strong>Darden</strong> <strong>Restaurants</strong>, Inc. <strong>2013</strong> <strong>Annual</strong> <strong>Report</strong>
Management’s Discussion and Analysisof Financial Condition and Results of Operations<strong>Darden</strong>Our defined benefit and other postretirement benefit costs and liabilities aredetermined using various actuarial assumptions and methodologies prescribedunder FASB ASC Topic 715, Compensation – Retirement Benefits and Topic 712,Compensation – Nonretirement Postemployment Benefits. We use certainassumptions including, but not limited to, the selection of a discount rate,expected long-term rate of return on plan assets and expected health care costtrend rates. We set the discount rate assumption annually for each plan at itsvaluation date to reflect the yield of high-quality fixed-income debt instruments,with lives that approximate the maturity of the plan benefits. At May 26, <strong>2013</strong>,our discount rate was 4.6 percent and 4.7 percent, respectively, for our definedbenefit and postretirement benefit plans. The expected long-term rate of returnon plan assets and health care cost trend rates are based upon several factors,including our historical assumptions compared with actual results, an analysis ofcurrent market conditions, asset allocations and the views of leading financialadvisers and economists. Our assumed expected long-term rate of return on planassets for our defined benefit plan was 9.0 percent for each of the fiscal yearsreported. At May 26, <strong>2013</strong>, the expected health care cost trend rate assumed forour postretirement benefit plan for fiscal 2014 was 7.1 percent. The rate graduallydecreases to 5.0 percent through fiscal 2021 and remains at that level thereafter.We made plan contributions of approximately $2.4 million, $22.2 million and$12.9 million in fiscal years <strong>2013</strong>, 2012 and 2011, respectively.The expected long-term rate of return on plan assets component of our netperiodic benefit cost is calculated based on the market-related value of planassets. Our target asset fund allocation is 40 percent U.S. equities, 35 percenthigh-quality, long-duration fixed-income securities, 20 percent internationalequities and 5 percent real estate securities. We monitor our actual asset fundallocation to ensure that it approximates our target allocation and believe that ourlong-term asset fund allocation will continue to approximate our target allocation.In developing our expected rate of return assumption, we have evaluated theactual historical performance and long-term return projections of the plan assets,which give consideration to the asset mix and the anticipated timing of thepension plan outflows. We employ a total return investment approach wherebya mix of equity and fixed income investments are used to maximize the long-termreturn of plan assets for what we consider a prudent level of risk. Our historical10-year, 15-year and 20-year rates of return on plan assets, calculated using thegeometric method average of returns, are approximately 9.5 percent, 8.0 percentand 9.4 percent, respectively, as of May 26, <strong>2013</strong>.We have recognized net actuarial losses, net of tax, as a component ofaccumulated other comprehensive income (loss) for the defined benefit plans andpostretirement benefit plan as of May 26, <strong>2013</strong> of $69.0 million and $1.3 million,respectively. These net actuarial losses represent changes in the amount of theprojected benefit obligation and plan assets resulting from differences in theassumptions used and actual experience. The amortization of the net actuarialloss component of our fiscal 2014 net periodic benefit cost for the definedbenefit plans and postretirement benefit plan is expected to be approximately$9.1 million and $0.0 million, respectively.We believe our defined benefit and postretirement benefit plan assumptionsare appropriate based upon the factors discussed above. However, other assumptionscould also be reasonably applied that could differ from the assumptions used.A quarter-percentage point change in the defined benefit plans’ discount rate andthe expected long-term rate of return on plan assets would increase or decreaseearnings before income taxes by $0.6 million and $0.5 million, respectively. Aquarter-percentage point change in our postretirement benefit plan discountrate would increase or decrease earnings before income taxes by $0.1 million. Aone-percentage point increase in the health care cost trend rates would increasethe accumulated postretirement benefit obligation (APBO) by $6.6 million atMay 26, <strong>2013</strong> and the aggregate of the service cost and interest cost componentsof net periodic postretirement benefit cost by $0.5 million for fiscal <strong>2013</strong>. A onepercentagepoint decrease in the health care cost trend rates would decreasethe APBO by $5.2 million at May 26, <strong>2013</strong> and the aggregate of the service costand interest cost components of net periodic postretirement benefit cost by$0.4 million for fiscal <strong>2013</strong>. These changes in assumptions would not significantlyimpact our funding requirements. We expect to contribute approximately$0.4 million to our defined benefit pension plans and approximately $0.7 millionto our postretirement benefit plan during fiscal 2014.We are not aware of any trends or events that would materially affect ourcapital requirements or liquidity. We believe that our internal cash-generatingcapabilities, the potential issuance of unsecured debt securities under our shelfregistration statement and short-term commercial paper should be sufficient tofinance our capital expenditures, debt maturities, stock repurchase program andother operating activities through fiscal 2014.OFF-BALANCE SHEET ARRANGEMENTSWe are not a party to any off-balance sheet arrangements that have, or arereasonably likely to have, a current or future material effect on our financialcondition, changes in financial condition, sales or expenses, results of operations,liquidity, capital expenditures or capital resources.<strong>Darden</strong> <strong>Restaurants</strong>, Inc. <strong>2013</strong> <strong>Annual</strong> <strong>Report</strong> 29
Management’s Discussion and Analysisof Financial Condition and Results of Operations<strong>Darden</strong>FINANCIAL CONDITIONOur total current assets were $764.9 million at May 26, <strong>2013</strong>, compared with$757.6 million at May 27, 2012. The increase was primarily due to an increase incash and cash equivalents, and an increase in deferred income taxes related tocurrent period activity of taxable timing differences, partially offset by lowerinventory levels related to the timing of inventory purchases.Our total current liabilities were $1.42 billion at May 26, <strong>2013</strong>, compared with$1.77 billion at May 27, 2012. The decrease was primarily due to the repaymentof $350.0 million of long-term debt during fiscal <strong>2013</strong> which was included incurrent liabilities as current portion of long-term debt at May 27, 2012 and adecrease in short-term debt, partially offset by an increase in unearned revenuesassociated with gift card sales in excess of current-period redemptions and anincrease in accounts payable.QUANTITATIVE AND QUALITATIVE DISCLOSURESABOUT MARKET RISKWe are exposed to a variety of market risks, including fluctuations in interestrates, foreign currency exchange rates, compensation and commodity prices. Tomanage this exposure, we periodically enter into interest rate and foreign currencyexchange instruments, equity forwards and commodity instruments for otherthan trading purposes (see Notes 1 and 10 to our consolidated financial statements,in Part II, Item 8 of this report, incorporated herein by reference).We use the variance/covariance method to measure value at risk, over timehorizons ranging from one week to one year, at the 95 percent confidence level.At May 26, <strong>2013</strong>, our potential losses in future net earnings resulting from changesin foreign currency exchange rate instruments, commodity instruments, equityforwards and floating rate debt interest rate exposures were approximately$47.4 million over a period of one year (including the impact of the interest rateswap agreements discussed in Note 10 to our consolidated financial statementsin Part II, Item 8 of this report, incorporated herein by reference). The value atrisk from an increase in the fair value of all of our long-term fixed rate debt, overa period of one year, was approximately $160.7 million. The fair value of our longtermdebt during fiscal <strong>2013</strong> averaged $2.41 billion, with a high of $2.79 billionand a low of $1.98 billion. Our interest rate risk management objective is to limitthe impact of interest rate changes on earnings and cash flows by targeting anappropriate mix of variable and fixed rate debt.APPLICATION OF NEW ACCOUNTING STANDARDSIn February <strong>2013</strong>, the FASB issued Accounting Standards Update (ASU) <strong>2013</strong>-02,Comprehensive Income (Topic 220), <strong>Report</strong>ing Amounts Reclassified Out ofAccumulated Other Comprehensive Income. This update requires companies toprovide information about the amounts reclassified out of accumulated othercomprehensive income by component. In addition, companies are required topresent, either on the face of the statement where net income is presented or inthe notes, significant amounts reclassified out of accumulated other comprehensiveincome by the respective line items of net income. This update is effectivefor us in our first quarter of fiscal 2014 and will be applied prospectively. Otherthan requiring additional disclosures, adoption of this new guidance will nothave a significant impact on our consolidated financial statements.In July 2012, the FASB issued ASU 2012-02, Intangibles – Goodwill and Other(Topic 350), Testing Indefinite Lived Intangible Assets for Impairment. This updatesimplifies the guidance for testing the decline in the realizable value (impairment)of indefinite-lived intangible assets other than goodwill and allows companiesthe option to first assess qualitative factors to determine whether it is necessaryto perform the quantitative impairment test. Companies electing to perform aqualitative assessment are no longer required to calculate the fair value of anindefinite-lived intangible asset unless the company determines, based on aqualitative assessment, that it is “more likely than not” that the asset is impaired.This update is effective for annual and interim impairment tests performed infiscal years beginning after September 15, 2012, which will require us to adoptthese provisions in fiscal 2014; however, early adoption is permitted. We do notbelieve adoption of this new guidance will have a significant impact on ourconsolidated financial statements.30 <strong>Darden</strong> <strong>Restaurants</strong>, Inc. <strong>2013</strong> <strong>Annual</strong> <strong>Report</strong>
Management’s Discussion and Analysisof Financial Condition and Results of Operations<strong>Darden</strong>FORWARD-LOOKING STATEMENTSStatements set forth in or incorporated into this report regarding the expectednet increase in the number of our restaurants, U.S. same-restaurant sales, totalsales growth, diluted net earnings per share growth, and capital expenditures infiscal 2014, and all other statements that are not historical facts, including withoutlimitation statements with respect to the financial condition, results of operations,plans, objectives, future performance and business of <strong>Darden</strong> <strong>Restaurants</strong>, Inc.and its subsidiaries that are preceded by, followed by or that include words suchas “may,” “will,” “expect,” “intend,” “anticipate,” “continue,” “estimate,” “project,”“believe,” “plan” or similar expressions, are forward-looking statements withinthe meaning of the Private Securities Litigation Reform Act of 1995 and areincluded, along with this statement, for purposes of complying with the safeharbor provisions of that Act. Any forward-looking statements speak only as ofthe date on which such statements are made, and we undertake no obligation toupdate such statements for any reason to reflect events or circumstances arisingafter such date. By their nature, forward-looking statements involve risks anduncertainties that could cause actual results to differ materially from those setforth in or implied by such forward-looking statements. In addition to the risksand uncertainties of ordinary business obligations, and those described in informationincorporated into this report, the forward-looking statements containedin this report are subject to the risks and uncertainties described in Part I, Item 1A“Risk Factors” in our <strong>Annual</strong> <strong>Report</strong> on Form 10-K for the year ended May 26,<strong>2013</strong>, which are summarized as follows:• Food safety and food-borne illness concerns throughout the supply chain;• Litigation, including allegations of illegal, unfair or inconsistentemployment practices;• Unfavorable publicity, or a failure to respond effectively to adverse publicity;• Risks relating to public policy changes and federal, state and localregulation of our business, including in the areas of health care reform,environmental matters, minimum wage, unionization, data privacy,menu labeling, immigration requirements and taxes;• Labor and insurance costs;• Insufficient guest or employee facing technology, or a failure to maintaina continuous and secure cyber network, free from material failure, interruptionor security breach;• Our inability or failure to execute a comprehensive business continuityplan following a major natural disaster such as a hurricane or manmadedisaster, including terrorism;• Health concerns arising from food-related pandemics, outbreaks of fluviruses or other diseases;• Intense competition, or an insufficient focus on competition and theconsumer landscape;• Our failure to drive both short-term and long-term profitable salesgrowth through brand relevance, operating excellence, openingnew restaurants of existing brands and developing or acquiringnew dining brands;• Failure to successfully integrate the Yard House business, and the risksassociated with the additional indebtedness incurred to finance theYard House acquisition;• Our plans to expand our smaller brands Bahama Breeze, Seasons 52 andEddie V’s, and the testing of synergy restaurants and other new businessventures, that have not yet proven their long-term viability;• A lack of suitable new restaurant locations or a decline in the quality ofthe locations of our current restaurants;• Higher-than-anticipated costs to open, close, relocate or remodel restaurants;• A failure to identify and execute innovative marketing and customerrelationship tactics, ineffective or improper use of social media or othermarketing initiatives, and increased advertising and marketing costs;• A failure to recruit, develop and retain effective leaders or the loss orshortage of key personnel, or an inability to adequately monitor andrespond to employee dissatisfaction;• A failure to address cost pressures, including rising costs for commodities,health care and utilities used by our restaurants, and a failure to effectivelydeliver cost management activities and achieve economies of scalein purchasing;• The impact of shortages or interruptions in the delivery of food and otherproducts from third-party vendors and suppliers;• Adverse weather conditions and natural disasters;• Volatility in the market value of derivatives we use to hedgecommodity prices;• Economic and business factors specific to the restaurant industry andother general macroeconomic factors including unemployment, energyprices and interest rates that are largely out of our control;• Disruptions in the financial markets that may impact consumer spendingpatterns, affect the availability and cost of credit and increase pensionplan expenses;• Risks associated with doing business with franchisees, business partnersand vendors in foreign markets;• Failure to protect our service marks or other intellectual property;• Impairment of the carrying value of our goodwill or other intangible assets;• A failure of our internal controls over financial reporting and futurechanges in accounting standards; and• An inability or failure to recognize, respond to and effectively manage theaccelerated impact of social media.Any of the risks described above or elsewhere in this report or our other filingswith the SEC could have a material impact on our business, financial conditionor results of operations. It is not possible to predict or identify all risk factors.Additional risks and uncertainties not presently known to us or that we currentlybelieve to be immaterial may also impair our business operations. Therefore,the above is not intended to be a complete discussion of all potential risksor uncertainties.<strong>Darden</strong> <strong>Restaurants</strong>, Inc. <strong>2013</strong> <strong>Annual</strong> <strong>Report</strong> 31
<strong>Report</strong> of Management’s Responsibilities andManagement’s <strong>Report</strong> on Internal Control Over Financial <strong>Report</strong>ing<strong>Darden</strong>REPORT OF MANAGEMENT’SRESPONSIBILITIESThe management of <strong>Darden</strong> <strong>Restaurants</strong>, Inc. is responsible for the fairness andaccuracy of the consolidated financial statements. The consolidated financialstatements have been prepared in accordance with U.S. generally acceptedaccounting principles, using management’s best estimates and judgments whereappropriate. The financial information throughout this report is consistent withour consolidated financial statements.Management has established a system of internal controls that providesreasonable assurance that assets are adequately safeguarded and transactionsare recorded accurately, in all material respects, in accordance with management’sauthorization. We maintain a strong audit program that independently evaluatesthe adequacy and effectiveness of internal controls. Our internal controls providefor appropriate segregation of duties and responsibilities and there are documentedpolicies regarding utilization of our assets and proper financial reporting. Theseformally stated and regularly communicated policies set high standards ofethical conduct for all employees.The Audit Committee of the Board of Directors meets at least quarterly todetermine that management, internal auditors and the independent registeredpublic accounting firm are properly discharging their duties regarding internalcontrol and financial reporting. The independent registered public accountingfirm, internal auditors and employees have full and free access to the AuditCommittee at any time.KPMG LLP, an independent registered public accounting firm, is retained toaudit our consolidated financial statements and the effectiveness of our internalcontrol over financial reporting. Their reports follow.MANAGEMENT’S REPORT ON INTERNALCONTROL OVER FINANCIAL REPORTINGManagement is responsible for establishing and maintaining adequate internalcontrol over financial reporting (as defined in Rule 13a-15(f) under the SecuritiesExchange Act of 1934, as amended). The Company’s internal control over financialreporting is designed to provide reasonable assurance to the Company’s managementand Board of Directors regarding the preparation and fair presentationof published financial statements.Because of its inherent limitations, internal control over financial reportingmay not prevent or detect misstatements. Also, projections of any evaluation ofeffectiveness to future periods are subject to the risk that controls may becomeinadequate because of changes in conditions, or that the degree of compliancewith the policies or procedures may deteriorate.Management assessed the effectiveness of the Company’s internal controlover financial reporting as of May 26, <strong>2013</strong>. In making this assessment, managementused the criteria set forth by the Committee of Sponsoring Organizationsof the Treadway Commission (COSO) in Internal Control – Integrated Framework.Management has concluded that, as of May 26, <strong>2013</strong>, the Company’s internalcontrol over financial reporting was effective based on these criteria.The Company’s independent registered public accounting firm KPMG LLP,has issued an audit report on the effectiveness of our internal control overfinancial reporting, which follows.Clarence Otis, Jr.Chairman of the Board and Chief Executive Officer32 <strong>Darden</strong> <strong>Restaurants</strong>, Inc. <strong>2013</strong> <strong>Annual</strong> <strong>Report</strong>
<strong>Report</strong> of Independent Registered Public Accounting Firmon Internal Control Over Financial <strong>Report</strong>ing<strong>Darden</strong>The Board of Directors and Stockholders<strong>Darden</strong> <strong>Restaurants</strong>, Inc.We have audited <strong>Darden</strong> <strong>Restaurants</strong>, Inc.’s internal control over financialreporting as of May 26, <strong>2013</strong>, based on criteria established in Internal Control –Integrated Framework issued by the Committee of Sponsoring Organizations ofthe Treadway Commission (COSO). <strong>Darden</strong> <strong>Restaurants</strong>, Inc.’s management isresponsible for maintaining effective internal control over financial reportingand for its assessment of the effectiveness of internal control over financialreporting, included in the accompanying Management’s <strong>Report</strong> on InternalControl Over Financial <strong>Report</strong>ing. Our responsibility is to express an opinion onthe Company’s internal control over financial reporting based on our audit.We conducted our audit in accordance with the standards of the PublicCompany Accounting Oversight Board (United States). Those standards requirethat we plan and perform the audit to obtain reasonable assurance aboutwhether effective internal control over financial reporting was maintained inall material respects. Our audit included obtaining an understanding of internalcontrol over financial reporting, assessing the risk that a material weaknessexists, and testing and evaluating the design and operating effectiveness ofinternal control based on the assessed risk. Our audit also included performingsuch other procedures as we considered necessary in the circumstances. Webelieve that our audit provides a reasonable basis for our opinion.A company’s internal control over financial reporting is a process designedto provide reasonable assurance regarding the reliability of financial reportingand the preparation of financial statements for external purposes in accordancewith generally accepted accounting principles. A company’s internal control overfinancial reporting includes those policies and procedures that (1) pertain to themaintenance of records that, in reasonable detail, accurately and fairly reflect thetransactions and dispositions of the assets of the company; (2) provide reasonableassurance that transactions are recorded as necessary to permit preparation offinancial statements in accordance with generally accepted accounting principles,and that receipts and expenditures of the company are being made only inaccordance with authorizations of management and directors of the company;and (3) provide reasonable assurance regarding prevention or timely detectionof unauthorized acquisition, use, or disposition of the company’s assets thatcould have a material effect on the financial statements.Because of its inherent limitations, internal control over financial reportingmay not prevent or detect misstatements. Also, projections of any evaluation ofeffectiveness to future periods are subject to the risk that controls may becomeinadequate because of changes in conditions, or that the degree of compliancewith the policies or procedures may deteriorate.In our opinion, <strong>Darden</strong> <strong>Restaurants</strong>, Inc. maintained, in all material respects,effective internal control over financial reporting as of May 26, <strong>2013</strong>, based oncriteria established in Internal Control – Integrated Framework issued by theCommittee of Sponsoring Organizations of the Treadway Commission.We also have audited, in accordance with the standards of the PublicCompany Accounting Oversight Board (United States), the consolidated balancesheets of <strong>Darden</strong> <strong>Restaurants</strong>, Inc. and subsidiaries as of May 26, <strong>2013</strong> and May 27,2012, and the related consolidated statements of earnings, comprehensiveincome, changes in stockholders’ equity, and cash flows for each of the years inthe three-year period ended May 26, <strong>2013</strong>, and our report dated July 19, <strong>2013</strong>expressed an unqualified opinion on those consolidated financial statements.Orlando, FloridaJuly 19, <strong>2013</strong>Certified Public Accountants<strong>Darden</strong> <strong>Restaurants</strong>, Inc. <strong>2013</strong> <strong>Annual</strong> <strong>Report</strong> 33
<strong>Report</strong> of Independent Registered Public Accounting Firm<strong>Darden</strong>The Board of Directors and Stockholders<strong>Darden</strong> <strong>Restaurants</strong>, Inc.We have audited the accompanying consolidated balance sheets of <strong>Darden</strong><strong>Restaurants</strong>, Inc. and subsidiaries as of May 26, <strong>2013</strong> and May 27, 2012, and therelated consolidated statements of earnings, comprehensive income, changes instockholders’ equity, and cash flows for each of the years in the three-year periodended May 26, <strong>2013</strong>. These consolidated financial statements are the responsibilityof the Company’s management. Our responsibility is to express an opinionon these consolidated financial statements based on our audits.We conducted our audits in accordance with the standards of the PublicCompany Accounting Oversight Board (United States). Those standards requirethat we plan and perform the audit to obtain reasonable assurance aboutwhether the financial statements are free of material misstatement. An auditincludes examining, on a test basis, evidence supporting the amounts anddisclosures in the financial statements. An audit also includes assessing theaccounting principles used and significant estimates made by management, aswell as evaluating the overall financial statement presentation. We believe thatour audits provide a reasonable basis for our opinion.In our opinion, the consolidated financial statements referred to above presentfairly, in all material respects, the financial position of <strong>Darden</strong> <strong>Restaurants</strong>, Inc.and subsidiaries as of May 26, <strong>2013</strong> and May 27, 2012, and the results of theiroperations and their cash flows for each of the years in the three-year period endedMay 26, <strong>2013</strong>, in conformity with U.S. generally accepted accounting principles.We also have audited, in accordance with the standards of the Public CompanyAccounting Oversight Board (United States), <strong>Darden</strong> <strong>Restaurants</strong>, Inc.’s internalcontrol over financial reporting as of May 26, <strong>2013</strong>, based on criteria establishedin Internal Control – Integrated Framework issued by the Committee of SponsoringOrganizations of the Treadway Commission (COSO), and our report dated July 19,<strong>2013</strong> expressed an unqualified opinion on the effectiveness of <strong>Darden</strong> <strong>Restaurants</strong>,Inc.’s internal control over financial reporting.Orlando, FloridaJuly 19, <strong>2013</strong>Certified Public Accountants34 <strong>Darden</strong> <strong>Restaurants</strong>, Inc. <strong>2013</strong> <strong>Annual</strong> <strong>Report</strong>
Management’s Consolidated Discussion Statements and of Earnings Analysisof Financial Condition and Results of Operations<strong>Darden</strong><strong>Darden</strong>Fiscal Year EndedMay 26, May 27, May 29,(in millions, except per share data) <strong>2013</strong> 2012 2011Sales $8,551.9 $7,998.7 $7,500.2Costs and expenses:Cost of sales:Food and beverage 2,628.6 2,460.6 2,173.6Restaurant labor 2,698.0 2,502.0 2,396.9Restaurant expenses 1,334.4 1,200.6 1,129.0Total cost of sales, excluding restaurant depreciation and amortization of $373.7, $326.9 and $295.6, respectively $6,661.0 $6,163.2 $5,699.5Selling, general and administrative 847.8 746.8 742.7Depreciation and amortization 394.8 349.1 316.8Interest, net 125.9 101.6 93.6Total costs and expenses $8,029.5 $7,360.7 $6,852.6Earnings before income taxes 522.4 638.0 647.6Income taxes 109.8 161.5 168.9Earnings from continuing operations $ 412.6 $ 476.5 $ 478.7Losses from discontinued operations, net of tax benefit of $0.4, $0.7, and $1.5, respectively (0.7) (1.0) (2.4)Net earnings $ 411.9 $ 475.5 $ 476.3Basic net earnings per share:Earnings from continuing operations $ 3.20 $ 3.66 $ 3.50Losses from discontinued operations (0.01) (0.01) (0.02)Net earnings $ 3.19 $ 3.65 $ 3.48Diluted net earnings per share:Earnings from continuing operations $ 3.14 $ 3.58 $ 3.41Losses from discontinued operations (0.01) (0.01) (0.02)Net earnings $ 3.13 $ 3.57 $ 3.39Average number of common shares outstanding:Basic 129.0 130.1 136.8Diluted 131.6 133.2 140.3Dividends declared per common share $ 2.00 $ 1.72 $ 1.28See accompanying notes to consolidated financial statements.Consolidated Statements of Comprehensive IncomeFiscal Year EndedMay 26, May 27, May 29,(in millions) <strong>2013</strong> 2012 2011Net earnings $411.9 $475.5 $476.3Other comprehensive income (loss):Foreign currency adjustment (0.2) (1.2) 1.8Change in fair value of marketable securities, net of tax expense (benefit) of $0.1, $0.1 and $(0.1), respectively (0.2) (0.1) 0.2Change in fair value of derivatives and amortization of unrecognized gains and losses on derivatives,net of tax expense (benefit) of $0.6, $27.8 and $4.8, respectively (4.1) (45.6) (5.2)Net unamortized gain (loss) arising during period, including amortization of unrecognized net actuarial loss,net of tax expense (benefit) of $(11.3), $24.8 and $(9.0), respectively 18.3 (39.9) 14.5Other comprehensive income (loss) $ 13.8 $ (86.8) $ 11.3Total comprehensive income $425.7 $388.7 $487.6See accompanying notes to consolidated financial statements.<strong>Darden</strong> <strong>Restaurants</strong>, Inc. <strong>2013</strong> <strong>Annual</strong> <strong>Report</strong> 35
Consolidated Balance Sheets<strong>Darden</strong>May 26, May 27,(in millions) <strong>2013</strong> 2012AssetsCurrent assets:Cash and cash equivalents $ 88.2 $ 70.5Receivables, net 85.4 71.4Inventories 356.9 404.1Prepaid income taxes 6.4 12.2Prepaid expenses and other current assets 83.4 74.9Deferred income taxes 144.6 124.5Total current assets $ 764.9 $ 757.6Land, buildings and equipment, net 4,391.1 3,951.3Goodwill 908.3 538.6Trademarks 573.8 464.9Other assets 298.8 231.8Total assets $6,936.9 $ 5,944.2Liabilities and Stockholders’ EquityCurrent liabilities:Accounts payable $ 296.5 $ 260.7Short-term debt 164.5 262.7Accrued payroll 150.5 154.3Accrued income taxes 16.5 –Other accrued taxes 67.6 60.4Unearned revenues 270.5 231.7Current portion of long-term debt – 349.9Other current liabilities 450.3 454.4Total current liabilities $1,416.4 $ 1,774.1Long-term debt, less current portion 2,496.2 1,453.7Deferred income taxes 356.4 312.9Deferred rent 230.5 204.4Obligations under capital leases, net of current installments 52.5 54.4Other liabilities 325.4 302.7Total liabilities $4,877.4 $ 4,102.2Stockholders’ equity:Common stock and surplus, no par value. Authorized 500.0 shares; issued 131.6 and 289.0 shares,respectively; outstanding 130.3 and 129.0 shares, respectively 1,207.6 2,518.8Preferred stock, no par value. Authorized 25.0 shares; none issued and outstanding – –Retained earnings 998.9 3,172.8Treasury stock, 1.3 and 160.0 shares, at cost, respectively (8.1) (3,695.8)Accumulated other comprehensive income (loss) (132.8) (146.6)Unearned compensation (6.1) (7.2)Total stockholders’ equity $2,059.5 $ 1,842.0Total liabilities and stockholders’ equity $6,936.9 $ 5,944.2See accompanying notes to consolidated financial statements.36 <strong>Darden</strong> <strong>Restaurants</strong>, Inc. <strong>2013</strong> <strong>Annual</strong> <strong>Report</strong>
Consolidated Statements of Changes in Stockholders’ Equity<strong>Darden</strong>CommonAccumulatedStock Other Totaland Retained Treasury Comprehensive Unearned Stockholders’(in millions, except per share data) Surplus Earnings Stock Income (Loss) Compensation EquityBalances at May 30, 2010 $ 2,297.9 $ 2,621.9 $(2,943.5) $ (71.1) $(11.2) $1,894.0Net earnings – 476.3 – – – 476.3Other comprehensive income – – – 11.3 – 11.3Dividends declared ($1.28 per share) – (176.3) – – – (176.3)Stock option exercises (2.3 shares) 53.1 – 2.6 – – 55.7Stock-based compensation 33.9 – – – – 33.9ESOP note receivable repayments – – – – 1.8 1.8Income tax benefits credited to equity 17.7 – – – – 17.7Repurchases of common stock (8.6 shares) – – (385.5) – – (385.5)Issuance of treasury stock under Employee Stock Purchase Plan and other plans (0.2 shares) 6.2 – 1.1 – – 7.3Balances at May 29, 2011 $ 2,408.8 $ 2,921.9 $(3,325.3) $ (59.8) $ (9.4) $1,936.2Net earnings – 475.5 – – – 475.5Other comprehensive income – – – (86.8) – (86.8)Dividends declared ($1.72 per share) – (224.6) – – – (224.6)Stock option exercises (2.2 shares) 59.4 – 3.5 – – 62.9Stock-based compensation 26.5 – – – – 26.5ESOP note receivable repayments – – – – 2.1 2.1Income tax benefits credited to equity 17.9 – – – – 17.9Repurchases of common stock (8.2 shares) – – (375.1) – – (375.1)Issuance of treasury stock under Employee Stock Purchase Plan and other plans (0.2 shares) 6.2 – 1.1 – 0.1 7.4Balances at May 27, 2012 $ 2,518.8 $ 3,172.8 $(3,695.8) $(146.6) $ (7.2) $1,842.0Net earnings – 411.9 – – – 411.9Other comprehensive income – – – 13.8 – 13.8Dividends declared ($2.00 per share) 0.4 (259.6) – – – (259.2)Stock option exercises (2.0 shares) 55.2 – 1.8 – – 57.0Stock-based compensation 24.3 – – – – 24.3ESOP note receivable repayments – – – – 1.1 1.1Income tax benefits credited to equity 13.6 – – – – 13.6Repurchases of common stock (1.0 shares) – (0.1) (52.3) – – (52.4)Issuance of treasury stock under Employee Stock Purchase Plan and other plans (0.2 shares) 6.7 – 0.7 – – 7.4Treasury shares retirement (159.3 shares) (1,411.4) (2,326.1) 3,737.5 – – –Balances at May 26, <strong>2013</strong> $ 1,207.6 $ 998.9 $ (8.1) $(132.8) $ (6.1) $2,059.5See accompanying notes to consolidated financial statements.<strong>Darden</strong> <strong>Restaurants</strong>, Inc. <strong>2013</strong> <strong>Annual</strong> <strong>Report</strong> 37
Consolidated Statements of Cash Flows<strong>Darden</strong>Fiscal Year EndedMay 26, May 27, May 29,(in millions) <strong>2013</strong> 2012 2011Cash flows – operating activitiesNet earnings $ 411.9 $ 475.5 $ 476.3Losses from discontinued operations, net of tax 0.7 1.0 2.4Adjustments to reconcile net earnings from continuing operations to cash flows:Depreciation and amortization 394.8 349.1 316.8Asset impairment charges, net 0.8 0.5 4.7Amortization of loan costs 13.0 6.7 2.8Stock-based compensation expense 49.3 56.1 66.6Change in current assets and liabilities 40.1 (191.4) 12.2Contributions to pension and postretirement plan (3.2) (22.7) (13.2)Loss on disposal of land, buildings and equipment 8.1 7.1 6.9Change in cash surrender value of trust-owned life insurance (16.8) 4.1 (13.7)Deferred income taxes (2.1) 36.1 28.8Change in deferred rent 26.8 18.5 17.1Change in other assets and liabilities 17.1 15.8 (15.4)Income tax benefits from exercise of stock-based compensation credited to goodwill 0.1 0.6 0.2Other, net 8.9 5.2 2.2Net cash provided by operating activities of continuing operations $ 949.5 $ 762.2 $ 894.7Cash flows – investing activitiesPurchases of land, buildings and equipment (685.6) (639.7) (547.7)Proceeds from disposal of land, buildings and equipment 0.4 3.3 7.0Purchases of marketable securities (12.9) (32.1) (6.5)Proceeds from sale of marketable securities 26.0 21.3 5.1Cash used in business acquisitions, net of cash acquired (577.4) (58.5) –Increase in other assets (40.9) (15.9) (10.6)Net cash used in investing activities of continuing operations $(1,290.4) $ (721.6) $ (552.7)Cash flows – financing activitiesProceeds from issuance of common stock 64.4 70.2 63.0Income tax benefits credited to equity 13.6 17.9 17.7Dividends paid (258.2) (223.9) (175.5)Purchases of common stock (52.4) (375.1) (385.5)ESOP note receivable repayments 1.1 2.1 1.8Proceeds from issuance of short-term debt 2,670.3 2,321.0 1,454.9Repayments of short-term debt (2,768.4) (2,243.8) (1,269.4)Repayments of long-term debt (355.9) (2.1) (226.8)Proceeds from issuance of long-term debt 1,050.0 400.0 –Payment of debt issuance costs (7.4) (5.1) –Principal payments on capital leases (1.7) (1.6) (1.2)Net cash provided by (used in) financing activities of continuing operations $ 355.4 $ (40.4) $ (521.0)Cash flows – discontinued operationsNet cash used in operating activities of discontinued operations (0.2) (0.5) (2.1)Net cash provided by investing activities of discontinued operations 3.4 0.3 2.8Net cash provided by (used in) discontinued operations $ 3.2 $ (0.2) $ 0.7Increase (decrease) in cash and cash equivalents 17.7 – (178.3)Cash and cash equivalents – beginning of year 70.5 70.5 248.8Cash and cash equivalents – end of year $ 88.2 $ 70.5 $ 70.5Cash flows from changes in current assets and liabilitiesReceivables, net (9.4) (6.1) (5.9)Inventories 50.6 (103.0) (79.3)Prepaid expenses and other current assets (11.7) (6.6) (5.0)Accounts payable 10.8 (10.2) 5.5Accrued payroll (9.3) (13.3) 5.3Prepaid/accrued income taxes 22.5 (16.3) 4.7Other accrued taxes 6.4 (3.9) 2.3Unearned revenues 36.4 31.1 27.3Other current liabilities (56.2) (63.1) 57.3Change in current assets and liabilities $ 40.1 $ (191.4) $ 12.2See accompanying notes to consolidated financial statements.38 <strong>Darden</strong> <strong>Restaurants</strong>, Inc. <strong>2013</strong> <strong>Annual</strong> <strong>Report</strong>
Notes to Consolidated Financial Statements<strong>Darden</strong>NOTE 1SUMMARY OF SIGNIFICANTACCOUNTING POLICIESOperations and Principles ofConsolidationThe accompanying consolidated financial statements include the operations of<strong>Darden</strong> <strong>Restaurants</strong>, Inc. and its wholly owned subsidiaries (<strong>Darden</strong>, the Company,we, us or our). We own and operate the Olive Garden®, Red Lobster®, LongHornSteakhouse®, The Capital Grille®, Yard House®, Bahama Breeze®, Seasons 52®,Eddie V’s Prime Seafood® and Wildfish Seafood Grille® restaurant brands locatedin the United States and Canada. Through subsidiaries, we own and operate allof our restaurants in the United States and Canada, except for three restaurantslocated in Central Florida and three restaurants in California that are owned jointlyby us and third parties, and managed by us, and five franchised restaurants inPuerto Rico. We also have area development and franchise agreements withunaffiliated operators to develop and operate our brands in Japan, the Middle Eastand Latin America. Pursuant to these agreements, as of May 26, <strong>2013</strong>, 37 franchisedrestaurants were in operation in Japan, the Middle East, Puerto Rico and Mexico.All significant inter-company balances and transactions have been eliminatedin consolidation.Basis of PresentationOn August 29, 2012, we completed the acquisition of Yard House USA, Inc.(Yard House) for $585.0 million in cash. The acquired operations of Yard Houseincluded 40 restaurants that are included in the results of operations in ourconsolidated financial statements from the date of acquisition.The assets and liabilities of Yard House were recorded at their respectivefair values as of the date of acquisition. The following table summarizes thefinal allocation of the purchase price as of May 26, <strong>2013</strong>:(in millions)FinalCurrent assets $ 16.0Buildings and equipment 152.2Trademark 109.3Other assets 9.8Goodwill 369.8Total assets acquired $657.1Current liabilities 40.8Other liabilities 31.3Total liabilities assumed $ 72.1Net assets acquired $585.0The excess of the purchase price over the aggregate fair value of net assetsacquired was allocated to goodwill. Of the $369.8 million recorded as goodwill,$37.9 million is expected to be deductible for tax purposes. The portion of thepurchase price attributable to goodwill represents benefits expected as a resultof the acquisition, including sales and unit growth opportunities in addition tosupply-chain and administrative cost synergies. The trademark has an indefinitelife based on the expected use of the asset and the regulatory and economicenvironment within which it is being used. The trademark represents a highlyrespected brand with positive connotations and we intend to cultivate and protectthe use of this brand. Goodwill and indefinite-lived trademarks are not amortizedbut are reviewed annually for impairment or more frequently if indicators ofimpairment exist. Buildings and equipment will be depreciated over a period of7 months to 21 years. Other assets and liabilities include values associated withfavorable and unfavorable market leases that will be amortized over a weightedaverageperiod of 16 years.As a result of the acquisition and related integration efforts, we incurredexpenses of approximately $12.3 million (net of tax) during the fiscal year endedMay 26, <strong>2013</strong> which are included in restaurant expenses, selling, general andadministrative expenses and depreciation expense in our consolidated statementsof earnings. Pro-forma financial information for the combined entities for periodsprior to the acquisition is not presented due to the immaterial impact of thefinancial results of Yard House on our consolidated financial statements.During fiscal 2007 and 2008 we closed or sold all Smokey Bones Barbeque &Grill (Smokey Bones) and Rocky River Grillhouse restaurants and we closed nineBahama Breeze restaurants. These restaurants and their related activities havebeen classified as discontinued operations. Therefore, for fiscal <strong>2013</strong>, 2012 and2011, all impairment losses and disposal costs, gains and losses on dispositionattributable to these restaurants have been aggregated in a single caption entitled“Losses from discontinued operations, net of tax benefit” on the accompanyingconsolidated statements of earnings.Unless otherwise noted, amounts and disclosures throughout these notesto consolidated financial statements relate to our continuing operations.Fiscal YearWe operate on a 52/53 week fiscal year, which ends on the last Sunday in May.Fiscal <strong>2013</strong>, 2012 and 2011 consisted of 52 weeks of operation.Use of EstimatesWe prepare our consolidated financial statements in conformity with U.S.generally accepted accounting principles. The preparation of these financialstatements requires us to make estimates and assumptions that affect thereported amounts of assets and liabilities and disclosure of contingent assetsand liabilities at the date of the financial statements, and the reported amountsof sales and expenses during the reporting period. Actual results could differfrom those estimates.Cash EquivalentsCash equivalents include highly liquid investments such as U.S. Treasury bills,taxable municipal bonds and money market funds that have an original maturityof three months or less. Amounts receivable from credit card companies arealso considered cash equivalents because they are both short term and highlyliquid in nature and are typically converted to cash within three days of thesales transaction.<strong>Darden</strong> <strong>Restaurants</strong>, Inc. <strong>2013</strong> <strong>Annual</strong> <strong>Report</strong> 39
Notes to Consolidated Financial Statements<strong>Darden</strong>Receivables, NetReceivables, net of the allowance for doubtful accounts, represent their estimatednet realizable value. Provisions for doubtful accounts are recorded based onhistorical collection experience and the age of the receivables. Receivables arewritten off when they are deemed uncollectible. See Note 3 – Receivables, Netfor additional information.InventoriesInventories consist of food and beverages and are valued at the lower ofweighted-average cost or market.Marketable SecuritiesAvailable-for-sale securities are carried at fair value. Classification of marketablesecurities as current or noncurrent is dependent upon management’s intendedholding period, the security’s maturity date, or both. Unrealized gains andlosses, net of tax, on available-for-sale securities are carried in accumulatedother comprehensive income (loss) within the consolidated financial statementsand are reclassified into earnings when the securities mature or are sold.Land, Buildings and Equipment, NetLand, buildings and equipment are recorded at cost less accumulated depreciation.Building components are depreciated over estimated useful lives ranging from7 to 40 years using the straight-line method. Leasehold improvements, whichare reflected on our consolidated balance sheets as a component of buildings inland, buildings and equipment, net, are amortized over the lesser of the expectedlease term, including cancelable option periods, or the estimated useful lives ofthe related assets using the straight-line method. Equipment is depreciated overestimated useful lives ranging from 2 to 10 years also using the straight-linemethod. See Note 5 – Land, Buildings and Equipment, Net for additional information.Gains and losses on the disposal of land, buildings and equipment areincluded in selling, general and administrative expenses in our accompanyingconsolidated statements of earnings. Depreciation and amortization expensefrom continuing operations associated with buildings and equipment and losseson disposal of land, buildings and equipment were as follows:Fiscal Year(in millions) <strong>2013</strong> 2012 2011Depreciation and amortization onbuildings and equipment $387.2 $340.6 $308.7Losses on disposal of land,buildings and equipment 8.1 7.1 6.9Capitalized Software Costs and OtherDefinite-Lived IntangiblesCapitalized software, which is a component of other assets, is recorded at costless accumulated amortization. Capitalized software is amortized using thestraight-line method over estimated useful lives ranging from 3 to 10 years.The cost of capitalized software and related accumulated amortization wasas follows:(in millions) May 26, <strong>2013</strong> May 27, 2012Capitalized software $107.9 $ 84.3Accumulated amortization (67.5) (63.4)Capitalized software, net ofaccumulated amortization $ 40.4 $ 20.9We have other definite-lived intangible assets, including assets related to thevalue of below-market leases resulting from our acquisitions, that are includedas a component of other assets on our consolidated balance sheets. We also havedefinite-lived intangible liabilities related to the value of above-market leasesresulting from our acquisitions, that are included in other liabilities on our consolidatedbalance sheets. Definite-lived intangibles are amortized on a straight-linebasis over estimated useful lives of 1 to 20 years. The cost and related accumulatedamortization was as follows:(in millions) May 26, <strong>2013</strong> May 27, 2012Other definite-lived intangibles $19.1 $13.2Accumulated amortization (7.6) (6.2)Other definite-lived intangible assets,net of accumulated amortization $11.5 $7.0(in millions) May 26, <strong>2013</strong> May 27, 2012Below-market leases $29.2 $24.0Accumulated amortization (7.8) (7.1)Below-market leases, net ofaccumulated amortization $21.4 $16.9(in millions) May 26, <strong>2013</strong> May 27, 2012Above-market leases $(21.4) $(8.6)Accumulated amortization 3.5 2.3Above-market leases, net ofaccumulated amortization $(17.9) $(6.3)40 <strong>Darden</strong> <strong>Restaurants</strong>, Inc. <strong>2013</strong> <strong>Annual</strong> <strong>Report</strong>
Notes to Consolidated Financial Statements<strong>Darden</strong>Amortization expense associated with capitalized software and otherdefinite-lived intangibles included in depreciation and amortization in ouraccompanying consolidated statements of earnings was as follows:Fiscal Year(in millions) <strong>2013</strong> 2012 2011Amortization expense –capitalized software $6.4 $7.8 $7.7Amortization expense –other definite-lived intangibles 1.2 0.7 0.4Amortization expense associated with above- and-below-market leasesincluded in restaurant expenses as a component of rent expense in our consolidatedstatements of earnings was as follows:Fiscal Year(in millions) <strong>2013</strong> 2012 2011Restaurant expense –below-market leases $ 1.8 $ 1.8 $ 2.2Restaurant expense –above-market leases (1.2) (0.5) (0.5)Amortization of capitalized software and other definite-lived intangibleassets will be approximately $10.4 million annually for fiscal 2014 through 2018.Trust-Owned Life InsuranceWe have a trust that purchased life insurance policies covering certain of ourofficers and other key employees (trust-owned life insurance or TOLI). Thetrust is the owner and sole beneficiary of the TOLI policies. The policies werepurchased to offset a portion of our obligations under our non-qualifieddeferred compensation plan. The cash surrender value for each policy isincluded in other assets while changes in cash surrender values are includedin selling, general and administrative expenses.Liquor LicensesThe costs of obtaining non-transferable liquor licenses that are directly issuedby local government agencies for nominal fees are expensed as incurred. Thecosts of purchasing transferable liquor licenses through open markets in jurisdictionswith a limited number of authorized liquor licenses are capitalized asindefinite-lived intangible assets and included in other assets. Liquor licensesare reviewed for impairment whenever events or changes in circumstancesindicate that the carrying amount may not be recoverable. <strong>Annual</strong> liquor licenserenewal fees are expensed over the renewal term.Goodwill and TrademarksWe review our goodwill and trademarks for impairment annually, as of the firstday of our fourth fiscal quarter or more frequently if indicators of impairmentexist. Goodwill and trademarks are not subject to amortization and have beenassigned to reporting units for purposes of impairment testing. The reportingunits are our restaurant brands. Our goodwill and trademark balances areallocated as follows:(in millions) May 26, <strong>2013</strong> May 27, 2012Goodwill:The Capital Grille $401.7 $401.8LongHorn Steakhouse 49.5 49.5Olive Garden (1) 30.2 30.2Red Lobster (1) 35.0 35.0Eddie V’s 22.1 22.1Yard House 369.8 –Total Goodwill $908.3 $538.6Trademarks:The Capital Grille $147.0 $147.0LongHorn Steakhouse 307.0 307.0Eddie V’s 10.5 10.9Yard House 109.3 –Total Trademarks $573.8 $464.9(1) Goodwill related to Olive Garden and Red Lobster is associated with the RARE Hospitality International, Inc. (RARE)acquisition and the direct benefits derived by Olive Garden and Red Lobster as a result of the RARE acquisition.A significant amount of judgment is involved in determining if an indicator ofimpairment has occurred. Such indicators may include, among others: a significantdecline in our expected future cash flows; a sustained, significant decline inour stock price and market capitalization; a significant adverse change in legalfactors or in the business climate; unanticipated competition; the testing forrecoverability of a significant asset group within a reporting unit; and slowergrowth rates. Any adverse change in these factors could have a significantimpact on the recoverability of these assets and could have a material impact onour consolidated financial statements.The goodwill impairment test involves a two-step process. The first step is acomparison of each reporting unit’s fair value to its carrying value. We estimatefair value using the best information available, including market informationand discounted cash flow projections (also referred to as the income approach).The income approach uses a reporting unit’s projection of estimated operatingresults and cash flows that is discounted using a weighted-average cost of capitalthat reflects current market conditions. The projection uses management’s bestestimates of economic and market conditions over the projected period includinggrowth rates in sales, costs and number of units, estimates of future expectedchanges in operating margins and cash expenditures. Other significant estimatesand assumptions include terminal value growth rates, future estimates of capitalexpenditures and changes in future working capital requirements. We validateour estimates of fair value under the income approach by comparing the valuesto fair value estimates using a market approach. A market approach estimatesfair value by applying cash flow and sales multiples to the reporting unit’s operatingperformance. The multiples are derived from comparable publicly traded<strong>Darden</strong> <strong>Restaurants</strong>, Inc. <strong>2013</strong> <strong>Annual</strong> <strong>Report</strong> 41
Notes to Consolidated Financial Statements<strong>Darden</strong>companies with similar operating and investment characteristics of the reportingunits. If the fair value of the reporting unit is higher than its carrying value,goodwill is deemed not to be impaired, and no further testing is required. If thecarrying value of the reporting unit is higher than its fair value, there is an indicationthat impairment may exist and the second step must be performed to measurethe amount of impairment loss. The amount of impairment is determined bycomparing the implied fair value of reporting unit goodwill to the carrying valueof the goodwill in the same manner as if the reporting unit was being acquiredin a business combination. Specifically, fair value is allocated to all of the assetsand liabilities of the reporting unit, including any unrecognized intangible assets,in a hypothetical analysis that would calculate the implied fair value of goodwill.If the implied fair value of goodwill is less than the recorded goodwill, we wouldrecord an impairment loss for the difference.Consistent with our accounting policy for goodwill and trademarks weperformed our annual impairment test of our goodwill and trademarks as of thefirst day of our fiscal <strong>2013</strong> fourth quarter. As of the beginning of our fiscal fourthquarter, we had eight reporting units, six of which had goodwill: Red Lobster,Olive Garden, LongHorn Steakhouse, The Capital Grille, Eddie V’s and Yard House.As part of our process for performing the step one impairment test of goodwill,we estimated the fair value of our reporting units utilizing the income and marketapproaches described above to derive an enterprise value of the Company. Wereconciled the enterprise value to our overall estimated market capitalization. Theestimated market capitalization considers recent trends in our market capitalizationand an expected control premium, based on comparable recent and historicaltransactions. Based on the results of the step one impairment test, no impairmentof goodwill was indicated. As we finalized the purchase price allocation for YardHouse during our fourth fiscal quarter of <strong>2013</strong>, we excluded the goodwill allocatedto Yard House from our step one impairment test, however, we did perform aqualitative assessment of the goodwill allocated to Yard House in accordance withFinancial Accounting Standards Board (FASB) Accounting Standards Codification(ASC) Topic 350, Intangibles – Goodwill and Other, and no indicators of impairmentwere identified.The fair value of trademarks are estimated and compared to the carryingvalue. We estimate the fair value of trademarks using the relief-from-royaltymethod, which requires assumptions related to projected sales from our annuallong-range plan; assumed royalty rates that could be payable if we did not ownthe trademarks; and a discount rate. We recognize an impairment loss when theestimated fair value of the trademarks is less than its carrying value. We completedour impairment test and concluded as of the date of the test, there was noimpairment of the trademarks for LongHorn Steakhouse, The Capital Grille andEddie V’s. As we finalized the purchase price allocation for Yard House during ourfourth fiscal quarter of <strong>2013</strong>, we excluded the trademark related to Yard House fromour annual impairment test, however, we did perform a qualitative assessmentof the Yard House trademark in accordance with ASC Topic 350, Intangibles –Goodwill and Other, and no indicators of impairment were identified.We determined that there was no goodwill or trademark impairment as ofthe first day of our fourth fiscal quarter and no additional indicators of impairmentwere identified through the end of our fourth fiscal quarter that would requireus to test further for impairment. However, declines in our market capitalization(reflected in our stock price) as well as in the market capitalization of othercompanies in the restaurant industry, declines in sales at our restaurants, andsignificant adverse changes in the operating environment for the restaurantindustry may result in future impairment.Changes in circumstances, existing at the measurement date or at othertimes in the future, or in the numerous estimates associated with management’sjudgments and assumptions made in assessing the fair value of our goodwill,could result in an impairment loss of a portion or all of our goodwill or trademarks.If we recorded an impairment loss, our financial position and results of operationswould be adversely affected and our leverage ratio for purposes of our creditagreement would increase. A leverage ratio exceeding the maximum permittedunder our credit agreement would be a default under our credit agreement. AtMay 26, <strong>2013</strong>, a write down of goodwill, other indefinite-lived intangible assets,or any other assets in excess of approximately $810.0 million would have beenrequired to cause our leverage ratio to exceed the permitted maximum. As ourleverage ratio is determined on a quarterly basis and due to the seasonal natureof our business, a lesser amount of impairment in future quarters could causeour leverage ratio to exceed the permitted maximum.We evaluate the useful lives of our other intangible assets, to determineif they are definite or indefinite-lived. A determination on useful life requiressignificant judgments and assumptions regarding the future effects of obsolescence,demand, competition, other economic factors (such as the stability of theindustry, legislative action that results in an uncertain or changing regulatoryenvironment, and expected changes in distribution channels), the level ofrequired maintenance expenditures, and the expected lives of other relatedgroups of assets.Impairment or Disposal ofLong-Lived AssetsLand, buildings and equipment and certain other assets, including definite-livedintangible assets, are reviewed for impairment whenever events or changes incircumstances indicate that the carrying amount of an asset may not be recoverable.Recoverability of assets to be held and used is measured by a comparisonof the carrying amount of the assets to the future undiscounted net cash flowsexpected to be generated by the assets. Identifiable cash flows are measured atthe lowest level for which they are largely independent of the cash flows of othergroups of assets and liabilities, generally at the restaurant level. If such assets aredetermined to be impaired, the impairment recognized is measured by theamount by which the carrying amount of the assets exceeds their fair value. Fairvalue is generally determined based on appraisals or sales prices of comparableassets. Restaurant sites and certain other assets to be disposed of are reportedat the lower of their carrying amount or fair value, less estimated costs to sell.Restaurant sites and certain other assets to be disposed of are included in assetsheld for disposal within prepaid expenses and other current assets in our consolidatedbalance sheets when certain criteria are met. These criteria include therequirement that the likelihood of disposing of these assets within one year isprobable. Assets not meeting the “held for sale” criteria remain in land, buildingsand equipment until their disposal is probable within one year.We account for exit or disposal activities, including restaurant closures, inaccordance with Financial Accounting Standards Board (FASB) Accounting StandardsCodification (ASC) Topic 420, Exit or Disposal Cost Obligations. Such costs includethe cost of disposing of the assets as well as other facility-related expenses frompreviously closed restaurants. These costs are generally expensed as incurred.Additionally, at the date we cease using a property under an operating lease, werecord a liability for the net present value of any remaining lease obligations, netof estimated sublease income. Any subsequent adjustments to that liability as aresult of lease termination or changes in estimates of sublease income are recorded42 <strong>Darden</strong> <strong>Restaurants</strong>, Inc. <strong>2013</strong> <strong>Annual</strong> <strong>Report</strong>
Notes to Consolidated Financial Statements<strong>Darden</strong>in the period incurred. Upon disposal of the assets, primarily land, associatedwith a closed restaurant, any gain or loss is recorded in the same caption withinour consolidated statements of earnings as the original impairment.Insurance AccrualsThrough the use of insurance program deductibles and self-insurance, we retaina significant portion of expected losses under our workers’ compensation, certainemployee medical and general liability programs. However, we carry insurancefor individual workers’ compensation and general liability claims that exceed$0.5 million. Accrued liabilities have been recorded based on our estimates of theanticipated ultimate costs to settle all claims, both reported and not yet reported.Revenue RecognitionSales, as presented in our consolidated statements of earnings, represents foodand beverage product sold and is presented net of discounts, coupons, employeemeals, and complimentary meals and gift cards. Revenue from restaurant salesis recognized when food and beverage products are sold. Sales taxes collectedfrom customers and remitted to governmental authorities are presented on anet basis within sales in our consolidated statements of earnings.Revenue from the sale of franchises is recognized as income when substantiallyall of our material obligations under the franchise agreement have been performed.Continuing royalties, which are a percentage of net sales of franchised restaurants,are accrued as income when earned. Revenue from the sale of consumer packagedgoods includes ongoing royalty fees based on a percentage of licensedretail product sales and is recognized upon the sale of product by our licensedmanufacturers to retail outlets.Unearned RevenuesUnearned revenues represent our liability for gift cards that have been sold butnot yet redeemed. We recognize sales from our gift cards when the gift card isredeemed by the customer. Although there are no expiration dates or dormancyfees for our gift cards, based on our analysis of our historical gift card redemptionpatterns, we can reasonably estimate the amount of gift cards for which redemptionis remote, which is referred to as “breakage.” We recognize breakage withinsales for unused gift card amounts in proportion to actual gift card redemptions,which is also referred to as the “redemption recognition” method. The estimatedvalue of gift cards expected to remain unused is recognized over the expectedperiod of redemption as the remaining gift card values are redeemed, generallyover a period of 10 years. Utilizing this method, we estimate both the amount ofbreakage and the time period of redemption. If actual redemption patterns varyfrom our estimates, actual gift card breakage income may differ from the amountsrecorded. We update our estimates of our redemption period and our breakagerate periodically and apply that rate to gift card redemptions.Food and Beverage CostsFood and beverage costs include inventory, warehousing, related purchasing anddistribution costs and gains and losses on certain commodity derivative contracts.Vendor allowances received in connection with the purchase of a vendor’s productsare recognized as a reduction of the related food and beverage costs as earned.Advance payments are made by the vendors based on estimates of volume to bepurchased from the vendors and the terms of the agreement. As we make purchasesfrom the vendors each period, we recognize the pro rata portion of allowancesearned as a reduction of food and beverage costs for that period. Differencesbetween estimated and actual purchases are settled in accordance with the termsof the agreements. Vendor agreements are generally for a period of one year ormore and payments received are initially recorded as long-term liabilities. Amountsexpected to be earned within one year are recorded as current liabilities.Income TaxesWe provide for federal and state income taxes currently payable as well as forthose deferred because of temporary differences between reporting income andexpenses for financial statement purposes versus tax purposes. Federal incometax credits are recorded as a reduction of income taxes. Deferred tax assets andliabilities are recognized for the future tax consequences attributable to differencesbetween the financial statement carrying amounts of existing assets andliabilities and their respective tax bases. Deferred tax assets and liabilities aremeasured using enacted tax rates expected to apply to taxable income in theyears in which those temporary differences are expected to be recovered or settled.The effect on deferred tax assets and liabilities of a change in tax rates isrecognized in earnings in the period that includes the enactment date. Interestrecognized on reserves for uncertain tax positions is included in interest, net inour consolidated statements of earnings. A corresponding liability for accruedinterest is included as a component of other current liabilities on our consolidatedbalance sheets. Penalties, when incurred, are recognized in selling, general andadministrative expenses.ASC Topic 740, Income Taxes, requires that a position taken or expected to betaken in a tax return be recognized (or derecognized) in the financial statementswhen it is more likely than not (i.e., a likelihood of more than 50 percent) that theposition would be sustained upon examination by tax authorities. A recognizedtax position is then measured at the largest amount of benefit that is greater than50 percent likely of being realized upon ultimate settlement. See Note 16 –Income Taxes for additional information.Income tax benefits credited to equity relate to tax benefits associated withamounts that are deductible for income tax purposes but do not affect earnings.These benefits are principally generated from employee exercises of non-qualifiedstock options and vesting of employee restricted stock awards.Derivative Instruments andHedging ActivitiesWe enter into derivative instruments for risk management purposes only,including derivatives designated as hedging instruments as required by FASBASC Topic 815, Derivatives and Hedging, and those utilized as economic hedges.We use financial and commodities derivatives to manage interest rate, compensation,commodities pricing and foreign currency exchange rate risks inherent inour business operations. Our use of derivative instruments is currently limited tointerest rate hedges; equity forwards contracts; commodities futures and optionscontracts and foreign currency forward contracts. These instruments are generallystructured as hedges of the variability of cash flows related to forecasted transactions(cash flow hedges). However, we do at times enter into instrumentsdesignated as fair value hedges to reduce our exposure to changes in fair value ofthe related hedged item. We do not enter into derivative instruments for trading orspeculative purposes, where changes in the cash flows or fair value of the derivativeare not expected to offset changes in cash flows or fair value of the hedged item.However, we have entered into equity forwards to economically hedge changes in<strong>Darden</strong> <strong>Restaurants</strong>, Inc. <strong>2013</strong> <strong>Annual</strong> <strong>Report</strong> 43
Notes to Consolidated Financial Statements<strong>Darden</strong>the fair value of employee investments in our non-qualified deferred compensationplan and certain commodity futures contracts to economically hedge changes inthe value of certain inventory purchases, for which we have not applied hedgeaccounting. All derivatives are recognized on the balance sheet at fair value. Forthose derivative instruments for which we intend to elect hedge accounting, onthe date the derivative contract is entered into, we document all relationshipsbetween hedging instruments and hedged items, as well as our risk-managementobjective and strategy for undertaking the various hedge transactions. This processincludes linking all derivatives designated as cash flow hedges to specific assetsand liabilities on the consolidated balance sheet or to specific forecasted transactions.We also formally assess, both at the hedge’s inception and on an ongoingbasis, whether the derivatives used in hedging transactions are highly effectivein offsetting changes in cash flows of hedged items.To the extent our derivatives are effective in offsetting the variability of thehedged cash flows, and otherwise meet the cash flow hedge accounting criteriarequired by Topic 815 of the FASB ASC, changes in the derivatives’ fair value arenot included in current earnings but are included in accumulated other comprehensiveincome (loss), net of tax. These changes in fair value will be reclassifiedinto earnings at the time of the forecasted transaction. Ineffectiveness measuredin the hedging relationship is recorded currently in earnings in the period in whichit occurs. To the extent our derivatives are effective in mitigating changes in fairvalue, and otherwise meet the fair value hedge accounting criteria required byTopic 815 of the FASB ASC, gains and losses in the derivatives’ fair value areincluded in current earnings, as are the gains and losses of the related hedged item.To the extent the hedge accounting criteria are not met, the derivative contractsare utilized as economic hedges and changes in the fair value of such contractsare recorded currently in earnings in the period in which they occur. Cash flowsrelated to derivatives are included in operating activities. See Note 10 – DerivativeInstruments and Hedging Activities for additional information.LeasesFor operating leases, we recognize rent expense on a straight-line basis over theexpected lease term, including cancelable option periods where failure to exercisethe options would result in an economic penalty to the Company.Differences between amounts paid and amounts expensed are recorded asdeferred rent. Capital leases are recorded as an asset and an obligation at anamount equal to the present value of the minimum lease payments during thelease term. Within the provisions of certain of our leases, there are rent holidaysand escalations in payments over the base lease term, as well as renewal periods.The effects of the holidays and escalations have been reflected in rent expenseon a straight-line basis over the expected lease term, which includes cancelableoption periods where failure to exercise such options would result in an economicpenalty to the Company. The lease term commences on the date when we havethe right to control the use of the leased property, which is typically before rentpayments are due under the terms of the lease. Many of our leases have renewalperiods totaling 5 to 20 years, exercisable at our option and require payment ofproperty taxes, insurance and maintenance costs in addition to the rent payments.The consolidated financial statements reflect the same lease term for amortizingleasehold improvements as we use to determine capital versus operating leaseclassifications and in calculating straight-line rent expense for each restaurant.Percentage rent expense is generally based on sales levels and is accrued at thepoint in time we determine that it is probable that such sales levels will be achieved.Amortization expense related to capital leases is included in depreciation andamortization expense in our consolidated statements of earnings. Landlordallowances are recorded based on contractual terms and are included in accountsreceivable, net and as a deferred rent liability and amortized as a reduction ofrent expense on a straight-line basis over the expected lease term.Pre-Opening ExpensesNon-capital expenditures associated with opening new restaurants are expensedas incurred.AdvertisingProduction costs of commercials are charged to operations in the fiscal periodthe advertising is first aired. The costs of programming and other advertising,promotion and marketing programs are charged to operations in the fiscalperiod incurred. Advertising expense related to continuing operations, includedin selling, general and administrative expenses was as follows:Fiscal Year(in millions) <strong>2013</strong> 2012 2011Advertising expense $409.2 $357.2 $340.2Stock-Based CompensationWe recognize the cost of employee service received in exchange for awards of equityinstruments based on the grant date fair value of those awards. We utilize theBlack-Scholes option pricing model to estimate the fair value of stock option awards.We recognize compensation expense on a straight-line basis over the employeeservice period for awards granted. The dividend yield has been estimated basedupon our historical results and expectations for changes in dividend rates. Theexpected volatility was determined using historical stock prices. The risk-freeinterest rate was the rate available on zero coupon U.S. government obligationswith a term approximating the expected life of each grant. The expected life wasestimated based on the exercise history of previous grants, taking into considerationthe remaining contractual period for outstanding awards. The weighted-averagefair value of non-qualified stock options and the related assumptions used in theBlack-Scholes model to record stock-based compensation are as follows:Stock OptionsGranted in Fiscal Year<strong>2013</strong> 2012 2011Weighted-average fair value $12.22 $14.31 $12.88Dividend yield 4.0% 3.5% 3.0%Expected volatility of stock 39.7% 39.4% 39.1%Risk-free interest rate 0.8% 2.1% 2.2%Expected option life (in years) 6.5 6.5 6.744 <strong>Darden</strong> <strong>Restaurants</strong>, Inc. <strong>2013</strong> <strong>Annual</strong> <strong>Report</strong>
Notes to Consolidated Financial Statements<strong>Darden</strong>Net Earnings per ShareBasic net earnings per share are computed by dividing net earnings by theweighted-average number of common shares outstanding for the reportingperiod. Diluted net earnings per share reflect the potential dilution that couldoccur if securities or other contracts to issue common stock were exercised orconverted into common stock. Outstanding stock options and restricted stockgranted by us represent the only dilutive effect reflected in diluted weightedaverageshares outstanding. These stock-based compensation instruments donot impact the numerator of the diluted net earnings per share computation.The following table presents the computation of basic and diluted netearnings per common share:Fiscal Year(in millions, except per share data) <strong>2013</strong> 2012 2011Earnings from continuing operations $412.6 $476.5 $478.7Losses from discontinued operations (0.7) (1.0) (2.4)Net earnings $411.9 $475.5 $476.3Average common sharesoutstanding – Basic 129.0 130.1 136.8Effect of dilutive stock-basedcompensation 2.6 3.1 3.5Average common sharesoutstanding – Diluted 131.6 133.2 140.3Basic net earnings per share:Earnings from continuing operations $ 3.20 $ 3.66 $ 3.50Losses from discontinued operations (0.01) (0.01) (0.02)Net earnings $ 3.19 $ 3.65 $ 3.48Diluted net earnings per share:Earnings from continuing operations $ 3.14 $ 3.58 $ 3.41Losses from discontinued operations (0.01) (0.01) (0.02)Net earnings $ 3.13 $ 3.57 $ 3.39Restricted stock and options to purchase shares of our common stockexcluded from the calculation of diluted net earnings per share because theeffect would have been anti-dilutive, are as follows:Fiscal Year Ended(in millions) May 26, <strong>2013</strong> May 27, 2012 May 29, 2011Anti-dilutive restrictedstock and options 2.8 2.6 1.2Comprehensive IncomeComprehensive income includes net earnings and other comprehensive income(loss) items that are excluded from net earnings under U.S. generally acceptedaccounting principles. Other comprehensive income (loss) items include foreigncurrency translation adjustments, the effective unrealized portion of changes inthe fair value of cash flow hedges, unrealized gains and losses on our marketablesecurities classified as held for sale and recognition of the funded status relatedto our pension and other postretirement plans. See Note 13 – Stockholders’Equity for additional information.Foreign CurrencyThe Canadian dollar is the functional currency for our Canadian restaurantoperations. Assets and liabilities denominated in Canadian dollars are translatedinto U.S. dollars using the exchange rates in effect at the balance sheetdate. Results of operations are translated using the average exchange ratesprevailing throughout the period. Translation gains and losses are reportedas a separate component of other comprehensive income (loss). Aggregatecumulative translation losses were $1.8 million and $1.6 million at May 26,<strong>2013</strong> and May 27, 2012, respectively. Gains and losses from foreign currencytransactions recognized in our consolidated statements of earnings were notsignificant for fiscal <strong>2013</strong>, 2012 or 2011.Segment <strong>Report</strong>ingAs of May 26, <strong>2013</strong>, we operated the Olive Garden, Red Lobster, LongHornSteakhouse, The Capital Grille, Yard House, Bahama Breeze, Seasons 52 andEddie V’s restaurant brands in North America as operating segments. The brandsoperate principally in the U.S. within the full-service dining industry, providingsimilar products to similar customers. The brands also possess similar economiccharacteristics, resulting in similar long-term expected financial performancecharacteristics. Sales from external customers are derived principally from foodand beverage sales. We do not rely on any major customers as a source of sales.We believe we meet the criteria for aggregating our operating segments into asingle reporting segment.Application of New Accounting StandardsIn February <strong>2013</strong>, the FASB issued Accounting Standards Update (ASU) <strong>2013</strong>-02,Comprehensive Income (Topic 220), <strong>Report</strong>ing Amounts Reclassified Out ofAccumulated Other Comprehensive Income. This update requires companies toprovide information about the amounts reclassified out of accumulated othercomprehensive income by component. In addition, companies are required topresent, either on the face of the statement where net income is presented or inthe notes, significant amounts reclassified out of accumulated other comprehensiveincome by the respective line items of net income. This update is effectivefor us in our first quarter of fiscal 2014 and will be applied prospectively. Otherthan requiring additional disclosures, adoption of this new guidance will nothave a significant impact on our consolidated financial statements.In July 2012, the FASB issued ASU 2012-02, Intangibles – Goodwill and Other(Topic 350), Testing Indefinite Lived Intangible Assets for Impairment. This updatesimplifies the guidance for testing the decline in the realizable value (impairment)of indefinite-lived intangible assets other than goodwill and allows companiesthe option to first assess qualitative factors to determine whether it is necessaryto perform the quantitative impairment test. Companies electing to perform aqualitative assessment are no longer required to calculate the fair value of anindefinite-lived intangible asset unless the company determines, based on aqualitative assessment, that it is “more likely than not” that the asset is impaired.This update is effective for annual and interim impairment tests performed infiscal years beginning after September 15, 2012, which will require us to adoptthese provisions in fiscal 2014; however, early adoption is permitted. We do notbelieve adoption of this new guidance will have a significant impact on ourconsolidated financial statements<strong>Darden</strong> <strong>Restaurants</strong>, Inc. <strong>2013</strong> <strong>Annual</strong> <strong>Report</strong> 45
Notes to Consolidated Financial Statements<strong>Darden</strong>NOTE 2DISCONTINUED OPERATIONSFor fiscal <strong>2013</strong>, 2012 and 2011, all gains and losses on disposition, impairmentcharges and disposal costs related to the closure and disposition of Smokey Bonesand Rocky River Grillhouse restaurants and closure of nine Bahama Breeze restaurantsin fiscal 2007 and 2008 have been aggregated to a single caption entitledlosses from discontinued operations, net of tax benefit in our consolidatedstatements of earnings and are comprised of the following:Fiscal Year(in millions) <strong>2013</strong> 2012 2011Sales $ – $ – $ –Losses before income taxes (1.1) (1.7) (3.9)Income tax benefit 0.4 0.7 1.5Net losses from discontinued operations $(0.7) $(1.0) $(2.4)As of May 26, <strong>2013</strong> and May 27, 2012, we had $3.1 million and $5.6 million,respectively, of assets associated with the closed restaurants reported as discontinuedoperations, which are included in land, buildings and equipment, net onthe accompanying consolidated balance sheets.NOTE 3RECEIVABLES, NETReceivables, net are primarily comprised of amounts owed to us from the sale ofgift cards in national retail outlets, allowances due from landlords based on leaseterms and receivables from national storage and distribution companies withwhich we contract to provide services that are billed to us on a per-case basis. Inconnection with these services, certain of our inventory items are conveyed tothese storage and distribution companies to transfer ownership and risk of lossprior to delivery of the inventory to our restaurants. We reacquire these itemswhen the inventory is subsequently delivered to our restaurants. These transactionsdo not impact the consolidated statements of earnings. Receivables fromthe sale of gift cards in national retail outlets, landlord allowances, national storageand distribution companies and our overall allowance for doubtful accountsare as follows:(in millions) May 26, <strong>2013</strong> May 27, 2012Retail outlet gift card sales $37.5 $33.4Landlord allowances due 26.5 9.4Storage and distribution 5.8 6.5Allowance for doubtful accounts (0.3) (0.3)NOTE 4ASSET IMPAIRMENTsDuring fiscal <strong>2013</strong>, we recognized long-lived asset impairment charges of$0.8 million ($0.5 million net of tax), primarily related to the write-down ofassets held for disposition based on updated valuations. During fiscal 2012,we recognized long-lived asset impairment charges of $0.5 million ($0.3 millionnet of tax), primarily related to the permanent closure of one Red Lobsterrestaurant, and the write-down of assets held for disposition based on updatedvaluations. During fiscal 2011 we recognized long-lived asset impairmentcharges of $4.7 million ($2.9 million net of tax), primarily related to the permanentclosure of two Red Lobster restaurants, the write-down of another Red Lobsterrestaurant based on an evaluation of expected cash flows, and the write-downof assets held for disposition based on updated valuations. These costs areincluded in selling, general and administrative expenses as a component ofearnings from continuing operations in the accompanying consolidated statementsof earnings for fiscal <strong>2013</strong>, 2012 and 2011. Impairment charges weremeasured based on the amount by which the carrying amount of these assetsexceeded their fair value. Fair value is generally determined based on appraisalsor sales prices of comparable assets and estimates of future cash flows.The results of operations for all restaurants permanently closed in fiscal <strong>2013</strong>,2012 and 2011 that would otherwise have met the criteria for discontinuedoperations reporting are not material to our consolidated financial position,results of operations or cash flows and, therefore, have not been presented asdiscontinued operations.NOTE 5LAND, BUILDINGS ANDEQUIPMENT, NETThe components of land, buildings and equipment, net, are as follows:(in millions) May 26, <strong>2013</strong> May 27, 2012Land $ 888.1 $ 854.1Buildings 4,474.5 3,959.7Equipment 1,860.9 1,701.2Assets under capital leases 67.7 68.1Construction in progress 149.7 142.5Total land, buildings and equipment $ 7,440.9 $ 6,725.6Less accumulated depreciation and amortization (3,030.2) (2,758.3)Less amortization associated with assetsunder capital leases (19.6) (16.0)Land, buildings and equipment, net $ 4,391.1 $ 3,951.346 <strong>Darden</strong> <strong>Restaurants</strong>, Inc. <strong>2013</strong> <strong>Annual</strong> <strong>Report</strong>
Notes to Consolidated Financial Statements<strong>Darden</strong>NOTE 6OTHER ASSETSThe components of other assets are as follows:(in millions) May 26, <strong>2013</strong> May 27, 2012Trust-owned life insurance (1) $ 85.7 $ 68.9Capitalized software costs, net (2) 40.4 20.9Liquor licenses 49.6 47.3Acquired below-market leases, net 21.4 16.9Loan costs, net 19.1 15.3Marketable securities 22.3 33.0Deferred-tax charge (3) 21.3 –Insurance-related 18.0 16.7Miscellaneous 21.0 12.8Total other assets $298.8 $231.8(1) The increase is attributable to market-driven changes in the value of our trust-owned life insurance.(2) The increase is attributable to upgrades to our information technology platform in support of technology initiatives.(3) The deferred tax charge is related to U.S. federal and state income taxes paid on the sale of intellectual propertyrelated to our foreign franchise and lobster aquaculture business to foreign subsidiaries in fiscal <strong>2013</strong>.NOTE 7SHORT-TERM DEBTAs of May 26, <strong>2013</strong>, amounts outstanding as short-term debt, which consist ofunsecured commercial paper borrowings, bearing an interest rate of 0.20 percent,were $164.5 million. As of May 27, 2012, amounts outstanding as short-term debt,which consist of unsecured commercial paper borrowings, bearing an interestrate of 0.32 percent, were $262.7 million.NOTE 8OTHER CURRENT LIABILITIESThe components of other current liabilities are as follows:(in millions) May 26, <strong>2013</strong> May 27, 2012Non-qualified deferred compensation plan $224.3 $201.4Sales and other taxes 74.3 60.6Insurance-related 40.8 35.2Employee benefits 44.7 59.7Derivative liabilities 2.2 45.3Accrued interest 17.7 15.6Miscellaneous 46.3 36.6Total other current liabilities $450.3 $454.4NOTE 9LONG-TERM DEBTThe components of long-term debt are as follows:(in millions) May 26, <strong>2013</strong> May 27, 20125.625% senior notes due October 2012 $ – $ 350.07.125% debentures due February 2016 100.0 100.0Variable-rate term loan (1.44% at May 26, <strong>2013</strong>)due August 2017 300.0 –6.200% senior notes due October 2017 500.0 500.03.790% senior notes due August 2019 80.0 –4.500% senior notes due October 2021 400.0 400.03.350% senior notes due November 2022 450.0 –4.520% senior notes due August 2024 220.0 –6.000% senior notes due August 2035 150.0 150.06.800% senior notes due October 2037 300.0 300.0ESOP loan – 5.9Total long-term debt $2,500.0 $1,805.9Fair value hedge 1.9 3.2Less issuance discount (5.7) (5.5)Total long-term debt less issuance discount $2,496.2 $1,803.6Less current portion – (349.9)Long-term debt, excluding current portion $2,496.2 $1,453.7We maintain a $750.0 million revolving Credit Agreement (Revolving CreditAgreement), with Bank of America, N.A. (BOA) as administrative agent, and thelenders and other agents party thereto. The Revolving Credit Agreement is asenior unsecured credit commitment to the Company and contains customaryrepresentations and affirmative and negative covenants (including limitationson liens and subsidiary debt and a maximum consolidated lease adjusted totaldebt to total capitalization ratio of 0.75 to 1.00) and events of default customaryfor credit facilities of this type. As of May 26, <strong>2013</strong>, we were in compliance withthe covenants under the Revolving Credit Agreement.<strong>Darden</strong> <strong>Restaurants</strong>, Inc. <strong>2013</strong> <strong>Annual</strong> <strong>Report</strong> 47
Notes to Consolidated Financial Statements<strong>Darden</strong>The Revolving Credit Agreement matures on October 3, 2016, and the proceedsmay be used for commercial paper back-up, working capital and capital expenditures,the refinancing of certain indebtedness, certain acquisitions and generalcorporate purposes. Loans under the Revolving Credit Agreement bear interest ata rate of LIBOR plus a margin determined by reference to a ratings-based pricinggrid (Applicable Margin), or the base rate (which is defined as the higher of theBOA prime rate or the Federal Funds rate plus 0.500 percent) plus the ApplicableMargin. Assuming a “BBB” equivalent credit rating level, the Applicable Marginunder the Revolving Credit Agreement will be 1.075 percent for LIBOR loans and0.075 percent for base rate loans.As of May 26, <strong>2013</strong>, we had no outstanding balances under the RevolvingCredit Agreement. As of May 26, <strong>2013</strong>, $164.5 million of commercial paper wasoutstanding, which was backed by this facility. After consideration of commercialpaper backed by the Revolving Credit Agreement, as of May 26, <strong>2013</strong>, we had$585.5 million of credit available under the Revolving Credit Agreement.On October 4, 2012, we issued $450.0 million aggregate principal amountof unsecured 3.350 percent senior notes due November 2022 (the New SeniorNotes) under a registration statement filed with the Securities and ExchangeCommission on October 6, 2010. Discount and issuance costs, which totaled$4.7 million, are being amortized over the term of the New Senior Notes usingthe straight-line method, the results of which approximate the effective interestmethod. Interest on the New Senior Notes is payable semi-annually in arrears onMay 1 and November 1 of each year and commenced May 1, <strong>2013</strong>. We may redeemthe New Senior Notes at any time in whole or from time to time in part, at theprincipal amount plus a make-whole premium. If we experience a change incontrol triggering event, unless we have previously exercised our right to redeemthe New Senior Notes, we may be required to purchase the New Senior Notes fromthe holders at a purchase price equal to 101 percent of their principal amountplus accrued and unpaid interest.On August 22, 2012, we entered into a Term Loan Agreement (the Term LoanAgreement) with BOA, as administrative agent, and the lenders and other agentsparty thereto. During the second quarter of fiscal <strong>2013</strong>, we made borrowingsunder this agreement in a total aggregate principal amount of $300.0 million.The Term Loan Agreement is a senior unsecured term loan commitment to theCompany and contains customary representations, events of default and affirmativeand negative covenants (including limitations on liens and subsidiary debtand a maximum consolidated lease adjusted total debt to total capitalizationratio of 0.75 to 1.00) for facilities of this type.The Term Loan Agreement matures on August 22, 2017, and the proceedsmay be used for the refinancing of certain indebtedness, certain acquisitionsand general corporate purposes. The loans under the Term Loan Agreement aresubject to annual amortization of principal of 5 percent, 5 percent, 5 percentand 85 percent, payable on the second, third, fourth and fifth anniversaries,respectively, of the effective date of the Term Loan Agreement. Interest rateson borrowings under the Term Loan Agreement will be based on LIBOR plus afixed spread as described in the Term Loan Agreement and, in part, upon ourcredit ratings. Pricing for interest and fees under the Term Loan Agreementmay be modified in the event of a change in the rating of our long-term seniorunsecured debt.On August 28, 2012, we closed on the issuance of $80.0 million unsecured3.790 percent senior notes due August 2019 and $220.0 million unsecured4.520 percent senior notes due August 2024, pursuant to a Note PurchaseAgreement dated June 18, 2012. The Note Purchase Agreement contains customaryrepresentations, events of default and affirmative and negative covenants(including limitations on liens and priority debt and a maximum consolidatedtotal debt to capitalization ratio of 0.75 to 1.00, as such may be adjusted in certaincircumstances) for facilities of this type.On May 15, <strong>2013</strong> we repaid, prior to maturity, a $4.9 million unsecuredcommercial bank loan which was used to support a loan from us to the EmployeeStock Ownership Plan portion of the <strong>Darden</strong> Savings Plan.The interest rates on our $500.0 million 6.200 percent senior notes dueOctober 2017 and $300.0 million 6.800 percent senior notes due October 2037are subject to adjustment from time to time if the debt rating assigned to suchseries of notes is downgraded below a certain rating level (or subsequentlyupgraded). The maximum adjustment is 2.000 percent above the initial interestrate and the interest rate cannot be reduced below the initial interest rate. As ofMay 26, <strong>2013</strong>, no adjustments to these interest rates had been made.All of our long-term debt currently outstanding is expected to be repaidentirely at maturity with interest being paid semi-annually over the life of thedebt. The aggregate maturities of long-term debt for each of the five fiscal yearssubsequent to May 26, <strong>2013</strong>, and thereafter are as follows:(in millions)Fiscal YearAmount2014 $ –2015 15.02016 115.02017 15.02018 755.0Thereafter 1,600.0Long-term debt $2,500.048 <strong>Darden</strong> <strong>Restaurants</strong>, Inc. <strong>2013</strong> <strong>Annual</strong> <strong>Report</strong>
Notes to Consolidated Financial Statements<strong>Darden</strong>NOTE 10DERIVATIVE INSTRUMENTSAND HEDGING ACTIVITIESWe use financial and commodities derivatives to manage interest rate, equity-basedcompensation and commodities pricing and foreign currency exchange rate risksinherent in our business operations. By using these instruments, we expose ourselves,from time to time, to credit risk and market risk. Credit risk is the failure ofthe counterparty to perform under the terms of the derivative contract. Whenthe fair value of a derivative contract is positive, the counterparty owes us, whichcreates credit risk for us. We minimize this credit risk by entering into transactionswith high-quality counterparties. We currently do not have any provisions in ouragreements with counterparties that would require either party to hold or postcollateral in the event that the market value of the related derivative instrumentexceeds a certain limit. As such, the maximum amount of loss due to counterpartycredit risk we would incur at May 26, <strong>2013</strong>, if counterparties to the derivativeinstruments failed completely to perform, would approximate the values ofderivative instruments currently recognized as assets on our consolidated balancesheet. Market risk is the adverse effect on the value of a financial instrument thatresults from a change in interest rates, commodity prices, or the market price ofour common stock. We minimize this market risk by establishing and monitoringparameters that limit the types and degree of market risk that may be undertaken.The notional values of our derivative contracts designated as hedginginstruments and derivative contracts not designated as hedging instrumentsare as follows:(in millions) May 26, <strong>2013</strong> May 27, 2012Derivative contracts designated ashedging instruments:Commodities $ 18.2 $ 8.7Foreign currency 20.3 19.4Interest rate swaps 100.0 550.0Equity forwards 24.9 21.7Derivative contracts not designated ashedging instruments:Equity forwards $ 49.1 $ 50.0Commodities 0.6 –We periodically enter into commodity futures, swaps and option contracts(collectively, commodity contracts) to reduce the risk of variability in cash flowsassociated with fluctuations in the price we pay for natural gas, soybean oil, milk,diesel fuel and butter. For certain of our commodity purchases, changes in theprice we pay for these commodities are highly correlated with changes in themarket price of these commodities. For these commodity purchases, we designatecommodity contracts as cash flow hedging instruments. For the remainingcommodity purchases, changes in the price we pay for these commodities are nothighly correlated with changes in the market price, generally due to the timingof when changes in the market prices are reflected in the price we pay. For thesecommodity purchases, we utilize commodity contracts as economic hedges. Ourcommodity contracts currently extend through June 2014.We periodically enter into foreign currency forward contracts to reduce therisk of fluctuations in exchange rates specifically related to forecasted transactionsor payments made in a foreign currency either for commodities and items useddirectly in our restaurants or for forecasted payments of services. Our foreigncurrency forward contracts currently extend through May 2014.We entered into forward-starting interest rate swap agreements with$300.0 million of notional value to hedge a portion of the risk of changes in thebenchmark interest rate prior to the issuance of the New Senior Notes October2012, as changes in the benchmark interest rate would cause variability in ourforecasted interest payments. These derivative instruments were designated ascash flow hedges. These instruments were settled at the issuance of the New SeniorNotes for a cumulative loss of approximately $55.0 million, which was recordedin accumulated other comprehensive income (loss) and will be reclassified intoearnings as an adjustment to interest expense on the New Senior Notes (or similardebt) as the forecasted transaction occurs.We entered into interest rate swap agreements with $250.0 million of notionalvalue to limit the risk of changes in fair value of a portion of the $350.0 million5.625 percent senior notes due October 2012 and a portion of the $400.0 million4.500 percent senior notes due October 2021 attributable to changes in thebenchmark interest rate, between inception of the interest rate swap agreementsand maturity of the related debt. The swap agreements effectively swap the fixedrate obligations for floating rate obligations, thereby mitigating changes in fairvalue of the related debt prior to maturity. The swap agreements were designatedas fair value hedges of the related debt and met the requirements to be accountedfor under the short-cut method, resulting in no ineffectiveness in the hedgingrelationship. Concurrent with the repayment at maturity of the $350.0 millionsenior notes due October 2012, we settled $150.0 million of notional value ofthese swaps. During fiscal <strong>2013</strong>, 2012 and 2011, $3.0 million, $3.3 million and$3.6 million, respectively, was recorded as a reduction to interest expense relatedto the net swap settlements.We enter into equity forward contracts to hedge the risk of changes in futurecash flows associated with the unvested, unrecognized <strong>Darden</strong> stock units. Theequity forward contracts will be settled at the end of the vesting periods of theirunderlying <strong>Darden</strong> stock units, which range between four and five years. Thecontracts were initially designated as cash flow hedges to the extent the <strong>Darden</strong>stock units are unvested and, therefore, unrecognized as a liability in our financialstatements. As of May 26, <strong>2013</strong>, we were party to equity forward contracts thatwere indexed to 1.2 million shares of our common stock, at varying forward ratesbetween $29.28 per share and $52.66 per share, extending through August 2017.The forward contracts can only be net settled in cash. As the <strong>Darden</strong> stock unitsvest, we will de-designate that portion of the equity forward contract that nolonger qualifies for hedge accounting and changes in fair value associated withthat portion of the equity forward contract will be recognized in current earnings.We periodically incur interest on the notional value of the contracts and receivedividends on the underlying shares. These amounts are recognized currently inearnings as they are incurred.<strong>Darden</strong> <strong>Restaurants</strong>, Inc. <strong>2013</strong> <strong>Annual</strong> <strong>Report</strong> 49
Notes to Consolidated Financial Statements<strong>Darden</strong>We entered into equity forward contracts to hedge the risk of changes infuture cash flows associated with recognized, cash-settled performance stockunits and employee-directed investments in <strong>Darden</strong> stock within the non-qualifieddeferred compensation plan. The equity forward contracts are indexed to 0.5 millionshares of our common stock at forward rates between $47.07 and $51.95 pershare, can only be net settled in cash and expire between fiscal 2014 and 2016.We did not elect hedge accounting with the expectation that changes in the fairvalue of the equity forward contracts would offset changes in the fair value ofthe performance stock units and <strong>Darden</strong> stock investments in the non-qualifieddeferred compensation plan within selling, general and administrative expensesin our consolidated statements of earnings.The fair value of our derivative contracts designated as hedging instruments and derivative contracts that are not designated as hedging instruments are as follows:BalanceSheetDerivative Assets Derivative Liabilities(in millions) Location May 26, <strong>2013</strong> May 27, 2012 May 26, <strong>2013</strong> May 27, 2012Derivative contracts designated as hedging instrumentsCommodity contracts(1)$0.1 $0.3 $(0.3) $ (0.4)Equity forwards(1)– 0.9 (0.6) –Interest rate related(1)1.9 3.2 – (44.9)Foreign currency forwards(1)0.6 0.5 – –$2.6 $4.9 $(0.9) $(45.3)Derivative contracts not designated as hedging instrumentsCommodity contracts(1)$ – $ – $ – $ –Equity forwards(1)– 1.9 (1.3) –$ – $1.9 $(1.3) $ –Total derivative contracts $2.6 $6.8 $(2.2) $(45.3)(1) Derivative assets and liabilities are included in receivables, net, prepaid expenses and other current assets, and other current liabilities, as applicable, on our consolidated balance sheets.The effects of derivative instruments in cash flow hedging relationships in the consolidated statements of earnings are as follows:Amount of Gain (Loss) Location of Gain (Loss) Amount of Gain (Loss) Location of Gain (Loss) Amount of Gain (Loss)Recognized in AOCI Reclassified from AOCI Reclassified from AOCI Recognized in Earnings Recognized in Earnings(in millions) (Effective Portion) to Earnings to Earnings (Effective Portion) (Ineffective Portion) (Ineffective Portion) (1)Fiscal Year Fiscal Year Fiscal Year<strong>2013</strong> 2012 2011 <strong>2013</strong> 2012 2011 <strong>2013</strong> 2012 2011Commodity $ 0.7 $ (2.2) $ (0.2) (2) $ 0.4 $(1.7) $(0.9) (2) $ – $ – $ –Equity (2.8) (0.7) 2.6 (3) 0.2 – – (3) 1.1 0.6 0.2Interest rate (10.1) (75.2) (12.2) Interest, net (8.3) (2.9) 0.7 Interest, net – (0.7) (0.5)Foreign currency (0.5) 0.9 (0.1) (4) – 0.8 0.4 (4) – – –$(12.7) $(77.2) $ (9.9) $(7.7) $(3.8) $ 0.2 $1.1 $(0.1) $(0.3)(1) Generally, all of our derivative instruments designated as cash flow hedges have some level of ineffectiveness, which is recognized currently in earnings. However, as these amounts are generally nominal and our consolidatedfinancial statements are presented “in millions,” these amounts may appear as zero in this tabular presentation.(2) Location of the gain (loss) reclassified from AOCI to earnings as well as the gain (loss) recognized in earnings for the ineffective portion of the hedge is food and beverage costs and restaurant expenses, which are components ofcost of sales.(3) Location of the gain (loss) reclassified from AOCI to earnings as well as the gain (loss) recognized in earnings for the ineffective portion of the hedge is restaurant labor expenses, which is a component of cost of sales, and selling,general and administrative expenses.(4) Location of the gain (loss) reclassified from AOCI to earnings as well as the gain (loss) recognized in earnings for the ineffective portion of the hedge is food and beverage costs, which is a component of cost of sales, and selling,general and administrative expenses.50 <strong>Darden</strong> <strong>Restaurants</strong>, Inc. <strong>2013</strong> <strong>Annual</strong> <strong>Report</strong>
Notes to Consolidated Financial Statements<strong>Darden</strong>The effects of derivative instruments in fair value hedging relationships in the consolidated statements of earnings are as follows:Amount of Gain (Loss) Location of Gain (Loss) Hedged Item Amount of Gain (Loss) Location of Gain (Loss)Recognized in Earnings Recognized in Earnings in Fair Value Recognized in Earnings on Recognized in Earnings on(in millions) on Derivatives on Derivatives Hedge <strong>Relations</strong>hip Related Hedged Item Related Hedged ItemFiscal YearFiscal Year<strong>2013</strong> 2012 2011 <strong>2013</strong> 2012 2011Interest rate $(1.3) $(0.4) $0.2 Interest, net Debt $1.3 $0.4 $(0.2) Interest, netThe effects of derivatives not designated as hedging instruments in the consolidated statements of earnings are as follows:Amount of Gain (Loss) Recognized in EarningsLocation of Gain (Loss)Fiscal Year(in millions) Recognized in Earnings <strong>2013</strong> 2012 2011Commodity contracts Cost of sales (1) $(0.1) $(7.9) $0.6Equity forwards Cost of sales (2) 1.6 2.3 3.3Equity forwards Selling, general and administrative 1.4 6.0 3.3$ 2.9 $0.4 $7.2(1) Location of the gain (loss) recognized in earnings is food and beverage costs and restaurant expenses, which are components of cost of sales.(2) Location of the gain (loss) recognized in earnings is restaurant labor expenses, which is a component of cost of sales.Based on the fair value of our derivative instruments designated as cash flow hedges as of May 26, <strong>2013</strong>, we expect to reclassify $9.8 million of net losses on derivativeinstruments from accumulated other comprehensive income (loss) to earnings during the next 12 months based on the timing of our forecasted commodity purchases, thematurity of equity forwards and the amortization of losses on interest rate related instruments. However, the amounts ultimately realized in earnings will be dependent onthe fair value of the contracts on the settlement dates.NOTE 11FAIR VALUE MEASUREMENTSThe fair values of cash equivalents, receivables, net, accounts payable and short-term debt approximate their carrying amounts due to their short duration.The following tables summarize the fair values of financial instruments measured at fair value on a recurring basis at May 26, <strong>2013</strong> and May 27, 2012:Items Measured at Fair Value at May 26, <strong>2013</strong>Quoted Prices in Active Market Significant Other SignificantFair Value of Assets for Identical Assets (Liabilities) Observable Inputs Unobservable Inputs(in millions) (Liabilities) (Level 1) (Level 2) (Level 3)Fixed-income securities:Corporate bonds (1) $10.0 $ – $10.0 $ –U.S. Treasury securities (2) 8.7 8.7 – –Mortgage-backed securities (1) 5.6 – 5.6 –Derivatives:Commodities futures, swaps & options (3) (0.2) – (0.2) –Equity forwards (4) (1.9) – (1.9) –Interest rate swaps (5) 1.9 – 1.9 –Foreign currency forwards (6) 0.6 – 0.6 –Total $24.7 $8.7 $16.0 $ –<strong>Darden</strong> <strong>Restaurants</strong>, Inc. <strong>2013</strong> <strong>Annual</strong> <strong>Report</strong> 51
Notes to Consolidated Financial Statements<strong>Darden</strong>Items Measured at Fair Value at May 27, 2012Quoted Prices in Active Market Significant Other SignificantFair Value of Assets for Identical Assets (Liabilities) Observable Inputs Unobservable Inputs(in millions) (Liabilities) (Level 1) (Level 2) (Level 3)Fixed-income securities:Corporate bonds (1) $ 14.5 $ – $ 14.5 $ –U.S. Treasury securities (2) 13.3 13.3 – –Mortgage-backed securities (1) 9.9 – 9.9 –Derivatives:Commodities futures, swaps & options (3) (0.1) – (0.1) –Equity forwards (4) 2.8 – 2.8 –Interest rate locks & swaps (5) (41.7) – (41.7) –Foreign currency forwards (6) 0.5 – 0.5 –Total $ (0.8) $13.3 $(14.1) $ –(1) The fair value of these securities is based on closing market prices of the investments, when applicable, or, alternatively, valuations utilizing market data and other observable inputs, inclusive of the risk of nonperformance.(2) The fair value of our U.S. Treasury securities is based on closing market prices.(3) The fair value of our commodities futures, swaps and options is based on closing market prices of the contracts, inclusive of the risk of nonperformance.(4) The fair value of our equity forwards is based on the closing market value of <strong>Darden</strong> stock, inclusive of the risk of nonperformance.(5) The fair value of our interest rate lock and swap agreements is based on current and expected market interest rates, inclusive of the risk of nonperformance.(6) The fair value of our foreign currency forward contracts is based on closing forward exchange market prices, inclusive of the risk of nonperformance.The carrying value and fair value of long-term debt as of May 26, <strong>2013</strong>, was $2.50 billion and $2.40 billion, respectively. The carrying value and fair value of long-termdebt, including the amounts included in current liabilities, as of May 27, 2012, was $1.80 billion and $1.99 billion, respectively. The fair value of long-term debt is determinedbased on market prices or, if market prices are not available, the present value of the underlying cash flows discounted at our incremental borrowing rates.Adjustments to the fair values of non-financial assets measured at fair value on a non-recurring basis as of May 26, <strong>2013</strong> and May 27, 2012 were generally relatedto impairments of property to be disposed of and were not material.NOTE 12FINANCIAL INSTRUMENTSMarketable securities are carried at fair value and consist of available-for-salesecurities related to insurance funding requirements for our workers’ compensationand general liability claims. The following table summarizes cost and marketvalue for our securities that qualify as available-for-sale as of May 26, <strong>2013</strong>:Gross GrossUnrealized Unrealized Market(in millions) Cost Gains Losses ValueAvailable-for-sale securities $24.1 $0.2 $ – $24.3Earnings include insignificant realized gains and loss from sales of availablefor-salesecurities. At May 26, <strong>2013</strong>, the scheduled maturities of our available-for-salesecurities are as follows:Market(in millions) Cost ValueLess than 1 year $ 2.0 $ 2.01 to 3 years 13.9 14.13 to 5 years 8.2 8.2Total $24.1 $24.3NOTE 13STOCKHOLDERS’ EQUITYTreasury StockRepurchased common stock has historically been reflected as a reduction ofstockholders’ equity. On December 17, 2010, our Board of Directors authorizedan additional share repurchase authorization totaling 25.0 million shares inaddition to the previous authorization of 162.4 million shares. Share repurchaseauthorizations and cumulative share repurchases under these authorizations,are as follows:(in millions) May 26, <strong>2013</strong>Share repurchase authorizations 187.4Cumulative shares repurchased 171.9The total shares and related cost of our common stock we repurchased wasas follows:Fiscal Year(in millions) <strong>2013</strong> 2012 2011Shares Cost Shares Cost Shares CostRepurchases of common stock 1.0 $52.4 8.2 $375.1 8.6 $385.552 <strong>Darden</strong> <strong>Restaurants</strong>, Inc. <strong>2013</strong> <strong>Annual</strong> <strong>Report</strong>
Notes to Consolidated Financial Statements<strong>Darden</strong>In the second quarter of fiscal <strong>2013</strong>, we retired a portion of our treasury stock totaling 159.3 million shares and restored them to authorized but unissued shares ofcommon stock. The retired treasury stock had a carrying amount of approximately $3.74 billion. Upon formal retirement and in accordance with FASB ASC Topic 505,Equity, we reduced our common stock and surplus account based on the estimated weighted-average cost of the common shares and reduced our treasury stockaccount based on the repurchase price. The difference between the repurchase price and the estimated average cost was recorded as a reduction to retained earnings.The remaining shares will be utilized to satisfy future issuances under certain of our employee stock compensation programs. We expect that all shares of common stockacquired in the future will be restored to authorized but unissued shares of common stock.Stockholders’ Rights PlanUnder our Rights Agreement dated May 16, 2005, each share of our common stock has associated with it one right to purchase one thousandth of a share of our Series AParticipating Cumulative Preferred Stock at a purchase price of $120 per share, subject to adjustment under certain circumstances to prevent dilution. The rights areexercisable when, and are not transferable apart from our common stock until, a person or group has acquired 15 percent or more, or makes a tender offer for 15 percentor more, of our common stock. If the specified percentage of our common stock is then acquired, each right will entitle the holder (other than the acquiring company) toreceive, upon exercise, common stock of either us or the acquiring company having a value equal to two times the exercise price of the right. The rights are redeemableby our Board of Directors under certain circumstances and expire on May 25, 2015.Accumulated Other Comprehensive Income (Loss)The components of accumulated other comprehensive income (loss), net of tax, are as follows:Foreign Currency Unrealized Gains (Losses) Unrealized Gains (Losses) Benefit Plan Accumulated Other(in millions) Translation Adjustment on Marketable Securities on Derivatives Funding Position Comprehensive Income (Loss)Balances at May 29, 2011 $(0.4) $ 0.5 $ (4.1) $(55.8) $ (59.8)Gain (loss) (1.2) (0.1) (47.9) (45.6) (94.8)Reclassification realized in net earnings – – 2.3 5.7 8.0Balances at May 27, 2012 $(1.6) $ 0.4 $(49.7) $(95.7) $(146.6)Gain (loss) (0.2) (0.2) (8.8) 11.4 2.2Reclassification realized in net earnings – – 4.7 6.9 11.6Balances at May 26, <strong>2013</strong> $(1.8) $ 0.2 $(53.8) $(77.4) $(132.8)<strong>Darden</strong> <strong>Restaurants</strong>, Inc. <strong>2013</strong> <strong>Annual</strong> <strong>Report</strong> 53
Notes to Consolidated Financial Statements<strong>Darden</strong>NOTE 14LEASESAn analysis of rent expense incurred related to restaurants in continuingoperations is as follows:Fiscal Year(in millions) <strong>2013</strong> 2012 2011Restaurant minimum rent $157.7 $130.9 $120.6Restaurant percentage rent 6.6 5.6 5.3Restaurant rent averaging expense 16.6 12.9 11.1Transportation equipment 3.8 3.5 3.2Office equipment 0.9 0.6 0.4Office space 1.5 1.0 0.9Warehouse space 0.4 0.6 0.5Total rent expense $187.5 $155.1 $142.0The annual future lease commitments under capital lease obligations andnoncancelable operating leases, including those related to restaurants reportedas discontinued operations, for each of the five fiscal years subsequent to May 26,<strong>2013</strong> and thereafter is as follows:(in millions)Fiscal Year Capital Operating2014 $ 5.4 $ 186.02015 5.5 178.62016 5.7 163.12017 5.7 144.42018 5.9 124.5Thereafter 61.3 366.7Total future lease commitments $ 89.5 $1,163.3Less imputed interest (at 6.5%) (35.1)Present value of future lease commitments $ 54.4Less current maturities (1.9)Obligations under capital leases,net of current maturities $ 52.5NOTE 15INTEREST, NETThe components of interest, net are as follows:Fiscal Year(in millions) <strong>2013</strong> 2012 2011Interest expense $126.2 $102.7 $93.7Imputed interest on capital leases 3.6 3.7 3.8Capitalized interest (3.0) (3.9) (3.0)Interest income (0.9) (0.9) (0.9)Interest, net $125.9 $101.6 $93.6Capitalized interest was computed using our average borrowing rate. Interestpaid, net of amounts capitalized was as follows:Fiscal Year(in millions) <strong>2013</strong> 2012 2011Interest paid, net of amounts capitalized $112.5 $94.8 $98.3NOTE 16INCOME TAXESTotal income tax expense was allocated as follows:Fiscal Year(in millions) <strong>2013</strong> 2012 2011Earnings from continuing operations $109.8 $161.5 $168.9Losses from discontinued operations (0.4) (0.7) (1.5)Total consolidated income tax expense $109.4 $160.8 $167.4The components of earnings before income taxes from continuing operationsand the provision for income taxes thereon are as follows:Fiscal Year(in millions) <strong>2013</strong> 2012 2011Earnings from continuing operationsbefore income taxes:U.S. $509.4 $621.4 $631.4Foreign 13.0 16.6 16.2Earnings from continuing operationsbefore income taxes $522.4 $638.0 $647.6Income taxes:Current:Federal $ 86.7 $ 97.0 $121.9State and local 20.4 26.0 17.5Foreign 3.5 2.4 0.1Total current $110.6 $125.4 $139.5Deferred (principally U.S.):Federal 6.9 37.6 28.3State and local (7.7) (1.5) 1.1Total deferred $ (0.8) $ 36.1 $ 29.4Total income taxes $109.8 $161.5 $168.9Income taxes paid were as follows:Fiscal Year(in millions) <strong>2013</strong> 2012 2011Income taxes paid $98.5 $123.5 $126.454 <strong>Darden</strong> <strong>Restaurants</strong>, Inc. <strong>2013</strong> <strong>Annual</strong> <strong>Report</strong>
Notes to Consolidated Financial Statements<strong>Darden</strong>The following table is a reconciliation of the U.S. statutory income tax rateto the effective income tax rate from continuing operations included in theaccompanying consolidated statements of earnings:Fiscal Year<strong>2013</strong> 2012 2011U.S. statutory rate 35.0% 35.0% 35.0%State and local income taxes,net of federal tax benefits 1.6 2.5 1.8Benefit of federal income tax credits (12.9) (11.1) (8.3)Other, net (2.7) (1.1) (2.4)Effective income tax rate 21.0% 25.3% 26.1%As of May 26, <strong>2013</strong>, we had estimated current prepaid state income taxesof $6.4 million, which is included on our accompanying consolidated balancesheets as prepaid income taxes, and estimated current federal income taxespayable of $16.5 million, which is included on our accompanying consolidatedbalance sheets as accrued income taxes.As of May 26, <strong>2013</strong>, we had unrecognized tax benefits of $29.9 million,which represents the aggregate tax effect of the differences between tax returnpositions and benefits recognized in our consolidated financial statements, allof which would favorably affect the effective tax rate if resolved in our favor.A reconciliation of the beginning and ending amount of unrecognized taxbenefits follows:(in millions)Balances at May 27, 2012 $15.7Additions related to current-year tax positions 16.9Reductions to tax positions due to settlements with taxing authorities (1.1)Reductions to tax positions due to statute expiration (1.6)Balances at May 26, <strong>2013</strong> $29.9We recognize accrued interest related to unrecognized tax benefits ininterest expense. Penalties, when incurred, are recognized in selling, generaland administrative expense. Interest expense associated with unrecognized taxbenefits, excluding the release of accrued interest related to prior year mattersdue to settlement or the lapse of the statute of limitations was as follows:Fiscal Year(in millions) <strong>2013</strong> 2012 2011Interest expense on unrecognizedtax benefits $0.5 $0.4 $1.6At May 26, <strong>2013</strong>, we had $1.2 million accrued for the payment of interestassociated with unrecognized tax benefits.For U.S. federal income tax purposes, we participate in the Internal RevenueService’s (IRS) Compliance Assurance Process (CAP) whereby our U.S. federalincome tax returns are reviewed by the IRS both prior to and after their filing.During fiscal <strong>2013</strong>, we were placed on CAP Maintenance by the IRS, signalingour strong relationship of transparency and trust with the IRS team. The U.S.federal income tax returns that we filed through the fiscal year ended May 29,2011 have been audited by the IRS. In the first quarter of fiscal <strong>2013</strong>, the IRSissued a partial acceptance letter for the fiscal year ended May 27, 2012 tax return.The outstanding item as of the end of the current fiscal year relates to ourdeductibility of the Domestic Manufacturing Deduction under IRC Section 199,and is expected to be completed by the second quarter of fiscal 2014. The IRScommenced examination of our U.S. federal income tax returns for May 26, <strong>2013</strong>in the first quarter of fiscal <strong>2013</strong>. The examination is anticipated to be completedby the second quarter of fiscal 2015. Income tax returns are subject to audit bystate and local governments, generally years after the returns are filed. Thesereturns could be subject to material adjustments or differing interpretationsof the tax laws. The major jurisdictions in which the Company files income taxreturns include the U.S. federal jurisdiction, Canada, and all states in the U.S. thathave an income tax. With a few exceptions, the Company is no longer subject toU.S. federal income tax examinations by tax authorities for years before fiscal2012, and state and local, or non-U.S. income tax examinations by tax authoritiesfor years before fiscal 2009.Included in the balance of unrecognized tax benefits at May 26, <strong>2013</strong> is$18.6 million related to tax positions for which it is reasonably possible that thetotal amounts could change during the next 12 months based on the outcomeof examinations. The $18.6 million relates to items that would impact oureffective income tax rate.The tax effects of temporary differences that give rise to deferred taxassets and liabilities are as follows:(in millions) May 26, <strong>2013</strong> May 27, 2012Accrued liabilities $ 85.5 $ 65.9Compensation and employee benefits 212.9 221.2Deferred rent and interest income 83.3 61.3Net operating loss, credit and charitablecontribution carryforwards 50.7 18.4Other 6.8 10.2Gross deferred tax assets $ 439.2 $ 377.0Valuation allowance (15.4) (5.2)Deferred tax assets, net of valuation allowance $ 423.8 $ 371.8Trademarks and other acquisition related intangibles (205.6) (175.3)Buildings and equipment (403.2) (363.3)Capitalized software and other assets (19.4) (15.1)Other (7.4) (6.5)Gross deferred tax liabilities $(635.6) $(560.2)Net deferred tax liabilities $(211.8) $(188.4)Some of our net operating loss, credit and charitable contributioncarryforwards have the potential to expire beginning in fiscal 2014. We havetaken these potential expirations into consideration when evaluating the needfor valuation allowances against these deferred tax assets. A valuation allowancefor deferred tax assets is provided when it is more likely than not that someportion or all of the deferred tax assets will not be realized. Realization isdependent upon the generation of future taxable income or the reversal ofdeferred tax liabilities during the periods in which those temporary differencesbecome deductible. We consider the scheduled reversal of deferred tax liabilities,projected future taxable income and tax planning strategies in makingthis assessment.<strong>Darden</strong> <strong>Restaurants</strong>, Inc. <strong>2013</strong> <strong>Annual</strong> <strong>Report</strong> 55
Notes to Consolidated Financial Statements<strong>Darden</strong>NOTE 17RETIREMENT PLANSDefined Benefit Plans and Postretirement Benefit PlanSubstantially all of our employees are eligible to participate in a retirement plan. We sponsor non-contributory defined benefit pension plans, which have been frozen,for a group of salaried employees in the United States, in which benefits are based on various formulas that include years of service and compensation factors; and for agroup of hourly employees in the United States, in which a fixed level of benefits is provided. Pension plan assets are primarily invested in U.S. and International equitiesas well as long-duration bonds and real estate investments. Our policy is to fund, at a minimum, the amount necessary on an actuarial basis to provide for benefitsin accordance with the requirements of the Employee Retirement Income Security Act of 1974, as amended and the Internal Revenue Code (IRC), as amended bythe Pension Protection Act of 2006. We also sponsor a contributory postretirement benefit plan that provides health care benefits to our salaried retirees. Fundingsrelated to the defined benefit pension plans and postretirement benefit plans, which are funded on a pay-as-you-go basis, were as follows:Fiscal Year(in millions) <strong>2013</strong> 2012 2011Defined benefit pension plans funding $2.4 $22.2 $12.9Postretirement benefit plan funding 0.8 0.5 0.3We expect to contribute approximately $0.4 million to our defined benefit pension plans and approximately $0.7 million to our postretirement benefit plan duringfiscal 2014.We are required to recognize the over- or under-funded status of the plans as an asset or liability as measured by the difference between the fair value of the planassets and the benefit obligation and any unrecognized prior service costs and actuarial gains and losses as a component of accumulated other comprehensive income(loss), net of tax.The following provides a reconciliation of the changes in the plan benefit obligation, fair value of plan assets and the funded status of the plans as of May 26, <strong>2013</strong>and May 27, 2012:Defined Benefit PlansPostretirement Benefit Plan(in millions) <strong>2013</strong> 2012 <strong>2013</strong> 2012Change in Benefit Obligation:Benefit obligation at beginning of period $274.4 $215.8 $ 29.6 $ 27.0Service cost 4.7 5.1 0.8 0.8Interest cost 9.9 9.6 1.3 1.5Participant contributions – – 0.4 0.3Benefits paid (11.2) (9.8) (1.2) (0.8)Actuarial loss (gain) (1.0) 53.7 (1.0) 0.8Benefit obligation at end of period $276.8 $274.4 $ 29.9 $ 29.6Change in Plan Assets:Fair value at beginning of period $203.5 $187.4 $ – $ –Actual return on plan assets 39.4 3.7 – –Employer contributions 2.4 22.2 0.8 0.5Participant contributions – – 0.4 0.3Benefits paid (11.2) (9.8) (1.2) (0.8)Fair value at end of period $234.1 $203.5 $ – $ –Reconciliation of the Plans’ Funded Status:Unfunded status at end of period $ (42.7) $ (70.9) $(29.9) $(29.6)56 <strong>Darden</strong> <strong>Restaurants</strong>, Inc. <strong>2013</strong> <strong>Annual</strong> <strong>Report</strong>
Notes to Consolidated Financial Statements<strong>Darden</strong>The following is a detail of the balance sheet components of each of our plans and a reconciliation of the amounts included in accumulated other comprehensiveincome (loss):Defined Benefit PlansPostretirement Benefit Plan(in millions) May 26, <strong>2013</strong> May 27, 2012 May 26, <strong>2013</strong> May 27, 2012Components of the Consolidated Balance Sheets:Non-current liabilities $ 42.7 $ 70.9 $29.9 $29.6Net amounts recognized $ 42.7 $ 70.9 $29.9 $29.6Amounts Recognized in Accumulated OtherComprehensive Income (Loss), net of tax:Prior service (cost) credit $ (0.2) $ (0.2) $ 0.1 $ 0.1Net actuarial loss (69.0) (87.4) (1.3) (1.9)Net amounts recognized $(69.2) $(87.6) $ (1.2) $ (1.8)The following is a summary of our accumulated and projected benefit obligations:(in millions) May 26, <strong>2013</strong> May 27, 2012Accumulated benefit obligation for all pension plans $267.6 $265.0Pension plans with accumulated benefit obligations in excess of plan assets:Accumulated benefit obligation 267.6 265.0Fair value of plan assets 234.1 203.5Projected benefit obligations for all plans with projected benefit obligations in excess of plan assets 276.8 274.4The following table presents the weighted-average assumptions used to determine benefit obligations and net expense:Defined Benefit PlansPostretirement Benefit Plan<strong>2013</strong> 2012 <strong>2013</strong> 2012Weighted-average assumptions used to determinebenefit obligations at May 26 and May 27 (1)Discount rate 4.60% 4.35% 4.74% 4.52%Rate of future compensation increases 4.04% 4.22% N/A N/AWeighted-average assumptions used to determinenet expense for fiscal years ended May 26 and May 27 (2)Discount rate 4.35% 5.37% 4.52% 5.46%Expected long-term rate of return on plan assets 9.00% 9.00% N/A N/ARate of future compensation increases 4.22% 3.75% N/A N/A(1) Determined as of the end of fiscal year.(2) Determined as of the beginning of fiscal year.<strong>Darden</strong> <strong>Restaurants</strong>, Inc. <strong>2013</strong> <strong>Annual</strong> <strong>Report</strong> 57
Notes to Consolidated Financial Statements<strong>Darden</strong>We set the discount rate assumption annually for each of the plans at theirvaluation dates to reflect the yield of high-quality fixed-income debt instruments,with lives that approximate the maturity of the plan benefits. The expectedlong-term rate of return on plan assets and health care cost trend rates are basedupon several factors, including our historical assumptions compared with actualresults, an analysis of current market conditions, asset fund allocations and theviews of leading financial advisers and economists.For fiscal <strong>2013</strong>, 2012 and 2011, we have used an expected long-term rate ofreturn on plan assets for our defined benefit plan of 9.0 percent. In developingour expected rate of return assumption, we have evaluated the actual historicalperformance and long-term return projections of the plan assets, which giveconsideration to the asset mix and the anticipated timing of the pension planoutflows. We employ a total return investment approach whereby a mix of equityand fixed-income investments are used to maximize the long-term return ofplan assets for what we consider a prudent level of risk. Our historical 10-year,15-year and 20-year rates of return on plan assets, calculated using the geometricmethod average of returns, are approximately 9.5 percent, 8.0 percent and9.4 percent, respectively, as of May 26, <strong>2013</strong>. Our Benefit Plans Committee setsthe investment policy for the Defined Benefit Plans and oversees the investmentallocation, which includes setting long-term strategic targets. Our overallinvestment strategy is to achieve appropriate diversification through a mix ofequity investments, which may include U.S., International, and private equities,as well as long-duration bonds and real estate investments. Our target asset fundallocation is 40 percent U.S. equities, 35 percent high-quality, long-durationfixed-income securities, 20 percent international equities, 5 percent real estatesecurities. The investment policy establishes a re-balancing band around theestablished targets within which the asset class weight is allowed to vary. Equitysecurities, international equities and fixed-income securities include investmentsin various industry sectors. Investments in real estate securities follow differentstrategies designed to maximize returns, allow for diversification and provide ahedge against inflation. Our current positioning is neutral on investment stylebetween value and growth companies and large and small cap companies. Wemonitor our actual asset fund allocation to ensure that it approximates our targetallocation and believe that our long-term asset fund allocation will continue toapproximate our target allocation. Investments held in the U.S. commingled fund,U.S. corporate securities, an international commingled fund, U.S. governmentfixed-income securities, an emerging markets commingled fund and a realestate commingled fund represented approximately 41.5 percent, 18.1 percent,14.3 percent, 7.1 percent, 5.9 percent and 4.9 percent, respectively, of total planassets and represents the only significant concentrations of risk related to a singleentity, sector, country, commodity or investment fund. No other single sectorconcentration of assets exceeded 5.0 percent of total plan assets.The discount rate and expected return on plan assets assumptions have asignificant effect on amounts reported for defined benefit pension plans. Aquarter percentage point change in the defined benefit plans’ discount rate andthe expected long-term rate of return on plan assets would increase or decreaseearnings before income taxes by $0.6 million and $0.5 million, respectively.The assumed health care cost trend rate increase in the per-capita chargesfor postretirement benefits was 7.1 percent for fiscal 2014. The rate graduallydecreases to 5.0 percent through fiscal 2021 and remains at that level thereafter.The assumed health care cost trend rate has a significant effect on amountsreported for retiree health care plans. A one percentage point increase or decreasein the assumed health care cost trend rate would affect the service and interestcost components of net periodic postretirement benefit cost by $0.5 million and$0.4 million, respectively, and would increase or decrease the accumulated postretirementbenefit obligation by $6.6 million and $5.2 million, respectively.58 <strong>Darden</strong> <strong>Restaurants</strong>, Inc. <strong>2013</strong> <strong>Annual</strong> <strong>Report</strong>
Notes to Consolidated Financial Statements<strong>Darden</strong>Components of net periodic benefit cost included in continuing operations are as follows:Defined Benefit PlansPostretirement Benefit Plan(in millions) <strong>2013</strong> 2012 2011 <strong>2013</strong> 2012 2011Service cost $ 4.7 $ 5.1 $ 5.9 $ 0.8 $ 0.8 $0.9Interest cost 9.9 9.6 9.5 1.3 1.5 2.3Expected return on plan assets (19.4) (17.8) (16.6) – – –Amortization of unrecognized prior service cost 0.1 0.1 0.1 (0.1) (0.1) –Recognized net actuarial loss 8.8 8.2 4.5 – – 1.3Net pension and postretirement cost (benefit) $ 4.1 $ 5.2 $ 3.4 $ 2.0 $ 2.2 $4.5The amortization of the net actuarial loss component of our fiscal 2014 net periodic benefit cost for the defined benefit plans and postretirement benefit plan isexpected to be approximately $9.1 million and $0.0 million, respectively.The fair values of the defined benefit pension plans assets at their measurement dates of May 26, <strong>2013</strong> and May 27, 2012, are as follows:Items Measured at Fair Value at May 26, <strong>2013</strong>Quoted Prices in Active Market Significant Other SignificantFair Value of Assets for Identical Assets (Liabilities) Observable Inputs Unobservable Inputs(In millions) (Liabilities) (Level 1) (Level 2) (Level 3)Equity:U.S. Commingled Funds (1) $ 97.2 $ – $ 97.2 $ –International Commingled Funds (2) 33.4 – 33.4 –Emerging Market Commingled Funds (3) 13.8 – 13.8 –Real Estate Commingled Funds (4) 11.6 – 11.6 –Fixed-Income:U.S. Treasuries (5) 16.3 16.3 – –U.S. Corporate Securities (5) 42.5 – 42.5 –International Securities (5) 8.2 – 8.2 –Public Sector Utility Securities (5) 9.4 – 9.4 –Cash & Accruals 1.7 1.7 – –Total $234.1 $18.0 $216.1 $ –<strong>Darden</strong> <strong>Restaurants</strong>, Inc. <strong>2013</strong> <strong>Annual</strong> <strong>Report</strong> 59
Notes to Consolidated Financial Statements<strong>Darden</strong>Items Measured at Fair Value at May 27, 2012Quoted Prices in Active Market Significant Other SignificantFair Value of Assets for Identical Assets (Liabilities) Observable Inputs Unobservable Inputs(In millions) (Liabilities) (Level 1) (Level 2) (Level 3)Equity:U.S. Commingled Funds (1) $ 80.5 $ – $ 80.5 $ –International Commingled Funds (2) 26.8 – 26.8 –Emerging Market Commingled Funds (3) 11.3 – 11.3 –Real Estate Commingled Funds (4) 10.0 – 10.0 –Fixed-Income:U.S. Treasuries (5) 20.0 20.0 – –U.S. Corporate Securities (5) 37.7 – 37.7 –International Securities (5) 2.7 – 2.7 –Public Sector Utility Securities (5) 10.4 – 10.4 –Cash & Accruals 4.1 4.1 – –Total $203.5 $24.1 $179.4 $ –(1) U.S. commingled funds are comprised of investments in funds that purchase publicly traded U.S. common stock for total return purposes. Investments are valued at unit values provided by the investment managers which arebased on the fair value of the underlying investments. There are no redemption restrictions associated with these funds.(2) International commingled funds are comprised of investments in funds that purchase publicly traded non-U.S. common stock for total return purposes. Investments are valued at unit values provided by the investment managerswhich are based on the fair value of the underlying investments. There are no redemption restrictions associated with these funds.(3) Emerging market commingled funds and developed market securities are comprised of investments in funds that purchase publicly traded common stock of non-U.S. companies for total return purposes. Funds are valued at unitvalues provided by the investment managers which are based on the fair value of the underlying investments. There are no redemption restrictions associated with these funds.(4) Real estate commingled funds are comprised of investments in funds that purchase publicly traded common stock of real estate securities for purposes of total return. These investments are valued at unit values provided by theinvestment managers which are based on the fair value of the underlying investments. There are no redemption restrictions associated with these funds.(5) Fixed-income securities are comprised of investments in government and corporate debt securities. These securities are valued by the trustee at closing prices from national exchanges or pricing vendors on the valuation date.The following table presents the changes in Level 3 investments for the defined benefit pension plans at May 27, 2012:Fair Value Measurements Using Significant Unobservable Inputs (Level 3)Private Equity Private Equity Energy & Real Estate Real Asset(in millions) Partnerships Securities Public Sector Private Funds TotalBeginning balance at May 29, 2011 $ 25.6 $ – $ 4.3 $ 10.8 $ 40.7Actual return on plan assets:Relating to assets still held at the reporting date – – – – –Relating to assets sold during the period 0.3 – – – 0.3Purchases, sales and settlements (25.9) – (4.3) (10.8) (41.0)Transfers in and/or out of Level 3 – – – – –Ending balance at May 27, 2012 $ – $ – $ – $ – $ –60 <strong>Darden</strong> <strong>Restaurants</strong>, Inc. <strong>2013</strong> <strong>Annual</strong> <strong>Report</strong>
Notes to Consolidated Financial Statements<strong>Darden</strong>The following benefit payments are expected to be paid between fiscal 2014 and fiscal 2023:(in millions) Defined Benefit Plans Postretirement Benefit Plan2014 $11.1 $0.72015 11.3 0.82016 11.8 0.92017 12.6 0.92018 13.5 1.02019-2023 79.4 6.5Postemployment Severance PlanWe accrue for postemployment severance costs in our consolidated financialstatements and recognize actuarial gains and losses related to our postemploymentseverance accrual as a component of accumulated other comprehensiveincome (loss). As of May 26, <strong>2013</strong> and May 27, 2012, $6.1 million and $4.8 million,respectively, of unrecognized actuarial losses related to our postemploymentseverance plan were included in accumulated other comprehensive income(loss) on a net of tax basis.Defined Contribution PlanWe have a defined contribution (401(k)) plan covering most employees age 21 andolder. We match contributions for participants with at least one year of serviceup to 6 percent of compensation, based on our performance. The match rangesfrom a minimum of $0.25 to $1.20 for each dollar contributed by the participant.The plan had net assets of $719.0 million at May 26, <strong>2013</strong> and $664.9 million atMay 27, 2012. Expense recognized in fiscal <strong>2013</strong>, 2012 and 2011 was $0.9 million,$0.9 million and $0.7 million, respectively. Employees classified as “highly compensated”under the IRC are not eligible to participate in this plan. Instead, highlycompensated employees are eligible to participate in a separate non-qualifieddeferred compensation (FlexComp) plan. This plan allows eligible employees todefer the payment of part of their annual salary and all or part of their annualbonus and provides for awards that approximate the matching contributionsand other amounts that participants would have received had they been eligibleto participate in our defined contribution and defined benefit plans. Amountspayable to highly compensated employees under the FlexComp plan totaled$224.3 million and $201.4 million at May 26, <strong>2013</strong> and May 27, 2012, respectively.These amounts are included in other current liabilities.The defined contribution plan includes an Employee Stock Ownership Plan(ESOP). The ESOP borrowed $16.9 million from us at a variable rate of interestin July 1996. At May 26, <strong>2013</strong>, the ESOP’s original debt to us had a balance of$4.9 million with a variable rate of interest of 0.55 percent and is due to be repaidno later than December 2014. At the end of fiscal 2005, the ESOP borrowed anadditional $1.6 million (Additional Loan) from us at a variable interest rate andacquired an additional 0.05 million shares of our common stock, which were heldin suspense within the ESOP at that time. At May 26, <strong>2013</strong>, the Additional Loanhad a balance of $1.3 million with a variable interest rate of 0.55 percent and is dueto be repaid no later than December 2018. Compensation expense is recognizedas contributions are accrued. Fluctuations in our stock price impact the amount ofexpense to be recognized. Contributions to the plan, plus the dividends accumulatedon unallocated shares held by the ESOP, are used to pay principal, interestand expenses of the plan. As loan payments are made, common stock is allocatedto ESOP participants. In each of the fiscal years <strong>2013</strong>, 2012 and 2011, the ESOPincurred interest expense of $0.0 million, $0.0 million and $0.1 million, respectively,and used dividends received of $1.0 million, $1.9 million and $1.4 million,respectively, and contributions received from us of $0.1 million, $0.5 million and$0.1 million, respectively, to pay principal and interest on our debt.ESOP shares are included in weighted-average common shares outstandingfor purposes of calculating net earnings per share with the exception of thoseshares acquired under the Additional Loan which are accounted for in accordancewith FASB ASC Subtopic 718-40, Employee Stock Ownership Plans. Fluctuationsin our stock price are recognized as adjustments to common stock and surpluswhen the shares are committed to be released. The ESOP shares acquired underthe additional loan are not considered outstanding until they are committed tobe released and, therefore, unreleased shares have been excluded for purposesof calculating basic and diluted net earnings per share. As of May 26, <strong>2013</strong>, theESOP shares included in the basic and diluted net earnings per share calculationtotaled 4.4 million shares, representing 3.5 million allocated shares and 0.9 millionsuspense shares.<strong>Darden</strong> <strong>Restaurants</strong>, Inc. <strong>2013</strong> <strong>Annual</strong> <strong>Report</strong> 61
Notes to Consolidated Financial Statements<strong>Darden</strong>NOTE 18STOCK-BASED COMPENSATIONWe maintain two active stock option and stock grant plans under which newawards may still be issued, known as the <strong>Darden</strong> <strong>Restaurants</strong>, Inc. 2002 StockIncentive Plan (2002 Plan) and the RARE Hospitality International, Inc. Amendedand Restated 2002 Long-Term Incentive Plan (RARE Plan). We also have fourother stock option and stock grant plans under which we no longer can grantnew awards, although awards outstanding under the plans may still vest and beexercised in accordance with their terms: the Stock Plan for Directors (DirectorStock Plan); the Director Compensation Plan; the Stock Option and Long-TermIncentive Plan of 1995 (1995 Plan) and the Restaurant Management andEmployee Stock Plan of 2000 (2000 Plan). All of the plans are administered bythe Compensation Committee of the Board of Directors. The 2002 Plan providesfor the issuance of up to 18.3 million common shares in connection with thegranting of non-qualified stock options, incentive stock options, stock appreciationrights, restricted stock, restricted stock units (RSUs), stock awards and otherstock-based awards including performance stock units and <strong>Darden</strong> stock unitsto key employees and non-employee directors. The RARE Plan provides for theissuance of up to 3.9 million common shares in connection with the grantingof non-qualified stock options, incentive stock options and restricted stock toemployees. Awards under the RARE Plan are only permitted to be granted toemployees who were employed by RARE as of the date of acquisition and continuedtheir employment with the Company. The Director Stock Plan provided for theissuance of up to 0.375 million common shares out of our treasury in connectionwith the granting of non-qualified stock options, restricted stock and RSUs tonon-employee directors. No new awards could be granted under the DirectorStock Plan after September 30, 2000. The Director Compensation Plan providedfor the issuance of 0.1 million common shares out of our treasury to non-employeedirectors. No new awards may be granted under the Director Compensation Planafter September 30, 2005. The 1995 Plan provided for the issuance of up to33.3 million common shares in connection with the granting of non-qualifiedstock options, restricted stock or RSUs to key employees. The 2000 Plan providedfor the issuance of up to 5.4 million shares of common stock out of our treasuryas non-qualified stock options, restricted stock or RSUs. Under all of these plans,stock options are granted at a price equal to the fair value of the shares at the dateof grant for terms not exceeding 10 years and have various vesting periods at thediscretion of the Compensation Committee. Outstanding options generally vestover one to four years. Restricted stock and RSUs granted under the 1995 Plan,the 2000 Plan and the 2002 Plan generally vest over periods ranging from threeto five years and no sooner than one year from the date of grant. PerformanceStock Units granted under the 2002 Plan generally vest over a three-year period,and vested amounts may range from 0.0 to 150.0 percent of targeted amountsdepending on the achievement of certain sales and diluted net earnings per shareperformance measures. <strong>Darden</strong> stock units granted under the 2002 Plan generallyvest over a five-year period, with no performance vesting feature.On December 15, 2005, the Board of Directors approved the DirectorCompensation Program, effective as of October 1, 2005, for Non-EmployeeDirectors. The Director Compensation Program provides for payments to nonemployeedirectors of: (a) an annual retainer and meeting fees for special Boardmeetings and committee meetings; (b) an additional annual retainer for theLead Director and committee chairs; and (c) an annual award of common stockwith a fair value of $0.1 million on the date of grant upon election or re-electionto the Board. Directors may elect to have their cash compensation paid in anycombination of current or deferred cash, common stock or salary replacementoptions. Deferred cash compensation may be invested on a tax-deferred basis inthe same manner as deferrals under our non-qualified deferred compensationplan. Prior to the date of grant, directors may elect to have their annual stockaward paid in the form of common stock or cash, or a combination thereof, ordeferred. To the extent directors elect to receive cash or cash settled awards, thevalue of the awards are carried as a liability on our consolidated balance sheetat fair value until such time as it is settled. All stock options and other stock orstock-based awards that are part of the compensation paid or deferred pursuantto the Director Compensation Program are awarded under the 2002 Plan.Stock-based compensation expense included in continuing operations wasas follows:Fiscal Year(in millions) <strong>2013</strong> 2012 2011Stock options $18.4 $19.0 $20.7Restricted stock/restricted stock units 2.6 4.3 9.9<strong>Darden</strong> stock units 19.9 17.1 17.1Performance stock units 5.1 12.6 15.6Employee stock purchase plan 1.8 1.8 1.9Director compensation program/other 1.5 1.3 1.4$49.3 $56.1 $66.662 <strong>Darden</strong> <strong>Restaurants</strong>, Inc. <strong>2013</strong> <strong>Annual</strong> <strong>Report</strong>
Notes to Consolidated Financial Statements<strong>Darden</strong>The following table presents a summary of our stock option activity as of and for the year ended May 26, <strong>2013</strong>:Weighted-Average Weighted-Average AggregateOptions Exercise Price Remaining Intrinsic Value(in millions) Per Share Contractual Life (Yrs) (in millions)Outstanding beginning of period 12.3 $36.05 5.58 $209.3Options granted 1.7 49.03Options exercised (2.0) 28.96Options canceled (0.4) 45.11Outstanding end of period 11.6 $38.81 5.47 $162.6Exercisable 6.9 $33.84 3.73 $130.7The total intrinsic value of options exercised during fiscal <strong>2013</strong>, 2012 and 2011was $47.1 million, $49.7 million and $49.9 million, respectively. Cash receivedfrom option exercises during fiscal <strong>2013</strong>, 2012 and 2011 was $57.0 million,$62.9 million and $55.7 million, respectively. Stock options have a maximumcontractual period of 10 years from the date of grant. We settle employee stockoption exercises with authorized but unissued shares of <strong>Darden</strong> common stock ortreasury shares we have acquired through our ongoing share repurchase program.As of May 26, <strong>2013</strong>, there was $32.8 million of unrecognized compensationcost related to unvested stock options granted under our stock plans. This cost isexpected to be recognized over a weighted-average period of 2.4 years. The totalfair value of stock options that vested during fiscal <strong>2013</strong> was $19.6 million.Restricted stock and RSUs are granted at a value equal to the market price ofour common stock on the date of grant. Restrictions lapse with regard to restrictedstock, and RSUs are settled in shares, at the end of their vesting periods, which isgenerally four years.The following table presents a summary of our restricted stock and RSUactivity as of and for the fiscal year ended May 26, <strong>2013</strong>:Weighted-AverageSharesGrant Date Fair(in millions) Value Per ShareOutstanding beginning of period 0.3 $39.63Shares granted 0.1 50.23Shares vested (0.2) 36.49Outstanding end of period 0.2 $35.13As of May 26, <strong>2013</strong>, there was $5.1 million of unrecognized compensationcost related to unvested restricted stock and RSUs granted under our stock plans.This cost is expected to be recognized over a weighted-average period of 2.9 years.The total fair value of restricted stock and RSUs that vested during fiscal <strong>2013</strong>,2012 and 2011 was $5.5 million, $10.0 million and $9.1 million, respectively.<strong>Darden</strong> stock units are granted at a value equal to the market price of ourcommon stock on the date of grant and will be settled in cash at the end of theirvesting periods, which range between four and five years, at the then market priceof our common stock. Compensation expense is measured based on the marketprice of our common stock each period, is amortized over the vesting period andthe vested portion is carried as a liability on our accompanying consolidated balancesheets. We also entered into equity forward contracts to hedge the risk of changesin future cash flows associated with the unvested, unrecognized <strong>Darden</strong> stockunits granted (see Note 10 – Derivative Instruments and Hedging Activities foradditional information).The following table presents a summary of our <strong>Darden</strong> stock unit activity asof and for the fiscal year ended May 26, <strong>2013</strong>:UnitsWeighted-Average(in millions) Fair Value Per UnitOutstanding beginning of period 2.1 $53.06Units granted 0.6 50.76Units vested (0.3) 51.92Units canceled (0.2) 42.86Outstanding end of period 2.2 $52.83As of May 26, <strong>2013</strong>, our total <strong>Darden</strong> stock unit liability was $61.1 million,including $19.9 million recorded in other current liabilities and $41.2 millionrecorded in other liabilities on our consolidated balance sheets. As of May 27, 2012,our total <strong>Darden</strong> stock unit liability was $50.3 million, including $11.1 millionrecorded in other current liabilities and $39.2 million recorded in other liabilitieson our consolidated balance sheets.Based on the value of our common stock as of May 26, <strong>2013</strong>, there was$43.0 million of unrecognized compensation cost related to <strong>Darden</strong> stock unitsgranted under our incentive plans. This cost is expected to be recognized over aweighted-average period of 2.8 years. <strong>Darden</strong> stock units with a fair value of$13.4 million vested during fiscal <strong>2013</strong>.The following table presents a summary of our performance stock unitactivity as of and for the fiscal year ended May 26, <strong>2013</strong>:UnitsWeighted-Average(in millions) Fair Value Per UnitOutstanding beginning of period 1.1 $39.33Units granted 0.3 49.58Units vested (0.4) 51.97Units canceled (0.1) 42.03Outstanding end of period 0.9 $36.83<strong>Darden</strong> <strong>Restaurants</strong>, Inc. <strong>2013</strong> <strong>Annual</strong> <strong>Report</strong> 63
Notes to Consolidated Financial Statements<strong>Darden</strong>All performance stock units outstanding as of May 26, <strong>2013</strong> will be settled incash upon vesting. As of May 26, <strong>2013</strong>, our total performance stock unit liabilitywas $16.8 million, including $9.0 million recorded in other current liabilities and$7.8 million recorded in other liabilities on our consolidated balance sheets. Asof May 27, 2012, our total performance stock unit liability was $31.3 million,including $18.9 million recorded in other current liabilities and $12.4 millionrecorded in other liabilities on our consolidated balance sheets.Performance stock units cliff vest 3 years from the date of grant, where0.0 percent to 150.0 percent of the entire grant is earned or forfeited at the endof 3 years. The number of units that actually vests will be determined for eachyear based on the achievement of Company performance criteria set forth in theaward agreement and may range from 0.0 percent to 150.0 percent of the annualtarget. All awards will be settled in cash. The awards are measured based on themarket price of our common stock each period, are amortized over the serviceperiod and the vested portion is carried as a liability in our accompanying consolidatedbalance sheets. As of May 26, <strong>2013</strong>, there was $11.1 million of unrecognizedcompensation cost related to unvested performance stock units granted underour stock plans. This cost is expected to be recognized over a weighted-averageperiod of 1.7 years. The total fair value of performance stock units that vested infiscal <strong>2013</strong> was $21.5 million.We maintain an Employee Stock Purchase Plan to provide eligible employeeswho have completed one year of service (excluding senior officers subject toSection 16(b) of the Securities Exchange Act of 1934, and certain other employeeswho are employed less than full time or own 5 percent or more of our capital stockor that of any subsidiary) an opportunity to invest up to $5.0 thousand per calendarquarter to purchase shares of our common stock, subject to certain limitations.Under the plan, up to an aggregate of 3.6 million shares are available for purchaseby employees at a purchase price that is 85.0 percent of the fair market value ofour common stock on either the first or last trading day of each calendar quarter,whichever is lower. Cash received from employees pursuant to the plan during fiscal<strong>2013</strong>, 2012 and 2011 was $7.3 million, $7.2 million and $7.4 million, respectively.NOTE 19COMMITMENTS ANDCONTINGENCIESAs collateral for performance on contracts and as credit guarantees to banksand insurers, we were contingently liable for guarantees of subsidiary obligationsunder standby letters of credit. At May 26, <strong>2013</strong> and May 27, 2012, we had$107.0 million and $99.2 million, respectively, of standby letters of credit relatedto workers’ compensation and general liabilities accrued in our consolidatedfinancial statements. At May 26, <strong>2013</strong> and May 27, 2012, we had $20.6 millionand $20.3 million, respectively, of standby letters of credit related to contractualoperating lease obligations and other payments. All standby letters of credit arerenewable annually.At May 26, <strong>2013</strong> and May 27, 2012, we had $4.2 million and $5.4 million,respectively, of guarantees associated with leased properties that have beenassigned to third parties. These amounts represent the maximum potential amountof future payments under the guarantees. The fair value of these potential paymentsdiscounted at our pre-tax cost of capital at May 26, <strong>2013</strong> and May 27, 2012,amounted to $3.4 million and $4.1 million, respectively. We did not accrue for theguarantees, as the likelihood of the third parties defaulting on the assignmentagreements was deemed to be less than probable. In the event of default by athird party, the indemnity and default clauses in our assignment agreementsgovern our ability to recover from and pursue the third party for damages incurredas a result of its default. We do not hold any third-party assets as collateral relatedto these assignment agreements, except to the extent that the assignmentallows us to repossess the building and personal property. These guaranteesexpire over their respective lease terms, which range from fiscal 2015 throughfiscal 2021.We are subject to private lawsuits, administrative proceedings and claimsthat arise in the ordinary course of our business. A number of these lawsuits,proceedings and claims may exist at any given time. These matters typicallyinvolve claims from guests, employees and others related to operational issuescommon to the restaurant industry, and can also involve infringement of, orchallenges to, our trademarks. While the resolution of a lawsuit, proceeding orclaim may have an impact on our financial results for the period in which it isresolved, we believe that the final disposition of the lawsuits, proceedings andclaims in which we are currently involved, either individually or in the aggregate,will not have a material adverse effect on our financial position, results of operationsor liquidity. The following is a brief description of the more significant ofthese matters.In September 2012, a collective action under the Fair Labor Standards Actwas filed in the United States District Court for the Southern District of Florida,Alequin v. <strong>Darden</strong> <strong>Restaurants</strong>, Inc., in which named plaintiffs claim that theCompany required or allowed certain employees at Olive Garden, Red Lobster,LongHorn Steakhouse, Bahama Breeze and Seasons 52 to work off the clock andrequired them to perform tasks unrelated to their tipped duties while taking atip credit against their hourly rate of pay. The plaintiffs seek an unspecifiedamount of alleged back wages, liquidated damages, and attorneys’ fees. In July<strong>2013</strong>, the District Court conditionally certified a nationwide class of servers andbartenders who worked in the aforementioned restaurants at any point fromSeptember 6, 2009 through September 6, 2012. Unlike a class action, a collectiveaction requires potential class members to “opt in” rather than “opt out,” andmembers of the class will have 90 days to opt in following the issuance of a notice.The Company will have an opportunity to seek to have the class de-certifiedand/or seek to have the case dismissed on its merits. We believe that our wageand hour policies comply with the law and that we have meritorious defenses tothe substantive claims and strong defenses supporting de-certification. An estimateof the possible loss, if any, or the range of loss cannot be made at this stageof the proceeding.NOTE 20SUBSEQUENT EVENTOn June 19, <strong>2013</strong>, the Board of Directors declared a cash dividend of $0.55 pershare to be paid August 1, <strong>2013</strong> to all shareholders of record as of the close ofbusiness on July 10, <strong>2013</strong>.64 <strong>Darden</strong> <strong>Restaurants</strong>, Inc. <strong>2013</strong> <strong>Annual</strong> <strong>Report</strong>
Notes to Consolidated Financial Statements<strong>Darden</strong>NOTE 21QUARTERLY DATA (UNAUDITED)The following table summarizes unaudited quarterly data for fiscal <strong>2013</strong> and fiscal 2012:Fiscal <strong>2013</strong> – Quarters Ended(in millions, except per share data) Aug. 26 Nov. 25 Feb. 24 May 26 TotalSales $2,034.8 $1,960.0 $2,258.2 $2,299.0 $8,551.9Earnings before income taxes 146.3 43.1 173.2 159.8 522.4Earnings from continuing operations 111.0 33.7 134.5 133.3 412.6Losses from discontinued operations, net of tax (0.2) (0.1) (0.1) (0.1) (0.7)Net earnings 110.8 33.6 134.4 133.2 411.9Basic net earnings per share:Earnings from continuing operations 0.87 0.26 1.04 1.03 3.20Losses from discontinued operations (0.01) – – – (0.01)Net earnings 0.86 0.26 1.04 1.03 3.19Diluted net earnings per share:Earnings from continuing operations 0.85 0.26 1.02 1.01 3.14Losses from discontinued operations – – – – (0.01)Net earnings 0.85 0.26 1.02 1.01 3.13Dividends paid per share 0.50 0.50 0.50 0.50 2.00Stock price:High 54.09 57.93 54.19 54.21 57.93Low 48.39 50.00 44.11 44.81 44.11Fiscal 2012 – Quarters Ended(in millions, except per share data) Aug. 28 Nov. 27 Feb. 26 May 27 TotalSales $1,942.0 $1,831.5 $2,159.7 $2,065.6 $7,998.7Earnings before income taxes 147.0 72.5 217.8 200.7 638.0Earnings from continuing operations 106.8 54.1 164.1 151.6 476.5Losses from discontinued operations, net of tax (0.2) (0.4) – (0.4) (1.0)Net earnings 106.6 53.7 164.1 151.2 475.5Basic net earnings per share:Earnings from continuing operations 0.80 0.42 1.28 1.18 3.66Losses from discontinued operations – (0.01) – – (0.01)Net earnings 0.80 0.41 1.28 1.18 3.65Diluted net earnings per share:Earnings from continuing operations 0.78 0.41 1.25 1.15 3.58Losses from discontinued operations – (0.01) – – (0.01)Net earnings 0.78 0.40 1.25 1.15 3.57Dividends paid per share 0.43 0.43 0.43 0.43 1.72Stock price:High 53.81 49.20 51.90 55.84 55.84Low 43.85 40.69 41.65 48.49 40.69<strong>Darden</strong> <strong>Restaurants</strong>, Inc. <strong>2013</strong> <strong>Annual</strong> <strong>Report</strong> 65
Five-Year Financial Summary<strong>Darden</strong>Fiscal Year EndedMay 26, May 27, May 29, May 30, May 31,(Dollars in millions, except per share data) <strong>2013</strong> 2012 2011 2010 2009 (2)Operating Results (3)Sales $8,551.9 $ 7,998.7 $7,500.2 $7,113.1 $7,217.5Costs and expenses:Cost of sales:Food and beverage 2,628.6 2,460.6 2,173.6 2,051.2 2,200.3Restaurant labor 2,698.0 2,502.0 2,396.9 2,350.6 2,308.2Restaurant expenses 1,334.4 1,200.6 1,129.0 1,082.2 1,128.4Total cost of sales, excluding restaurantdepreciation and amortization (4) $6,661.0 $ 6,163.2 $5,699.5 $5,484.0 $5,636.9Selling, general and administrative (1) 847.8 746.8 742.7 690.7 677.6Depreciation and amortization 394.8 349.1 316.8 300.9 283.1Interest, net 125.9 101.6 93.6 93.9 107.4Total costs and expenses $8,029.5 $ 7,360.7 $6,852.6 $6,569.5 $6,705.0Earnings before income taxes 522.4 638.0 647.6 543.6 512.5Income taxes 109.8 161.5 168.9 136.6 140.7Earnings from continuing operations $ 412.6 $ 476.5 $ 478.7 $ 407.0 $ 371.8(Losses) earnings from discontinued operations, net of tax (benefit)expense of $(0.4), (0.7), $(1.5), $(1.5) and $0.2 (0.7) (1.0) (2.4) (2.5) 0.4Net earnings $ 411.9 $ 475.5 $ 476.3 $ 404.5 $ 372.2Basic net earnings per share:Earnings from continuing operations $ 3.20 $ 3.66 $ 3.50 $ 2.92 $ 2.71(Losses) earnings from discontinued operations $ (0.01) $ (0.01) $ (0.02) $ (0.02) $ –Net earnings $ 3.19 $ 3.65 $ 3.48 $ 2.90 $ 2.71Diluted net earnings per share:Earnings from continuing operations $ 3.14 $ 3.58 $ 3.41 $ 2.86 $ 2.65(Losses) earnings from discontinued operations $ (0.01) $ (0.01) $ (0.02) $ (0.02) $ –Net earnings $ 3.13 $ 3.57 $ 3.39 $ 2.84 $ 2.65Average number of common shares outstanding:Basic 129.0 130.1 136.8 139.3 137.4Diluted 131.6 133.2 140.3 142.4 140.4Financial PositionTotal assets $6,936.9 $ 5,944.2 $5,466.6 $5,276.1 $5,056.6Land, buildings and equipment, net $4,391.1 $ 3,951.3 $3,622.0 $3,403.7 $3,306.7Working capital (deficit) $ (651.5) $(1,016.5) $ (623.0) $ (519.6) $ (493.8)Long-term debt, less current portion $2,496.2 $ 1,453.7 $1,407.3 $1,408.7 $1,632.3Stockholders’ equity $2,059.5 $ 1,842.0 $1,936.2 $1,894.0 $1,606.0Stockholders’ equity per outstanding share $ 15.81 $ 14.28 $ 14.38 $ 13.47 $ 11.53Other StatisticsCash flows from operations (3) $ 949.5 $ 762.2 $ 894.7 $ 903.4 $ 783.5Capital expenditures (3) $ 685.6 $ 639.7 $ 547.7 $ 432.1 $ 535.3Dividends paid $ 258.2 $ 223.9 $ 175.5 $ 140.0 $ 110.2Dividends paid per share $ 2.00 $ 1.72 $ 1.28 $ 1.00 $ 0.80Advertising expense (3) $ 409.2 $ 357.2 $ 340.2 $ 311.9 $ 308.3Stock price:High $ 57.93 $ 55.84 $ 52.12 $ 49.01 $ 40.26Low $ 44.11 $ 40.69 $ 37.08 $ 29.94 $ 13.54Close $ 52.83 $ 53.06 $ 50.92 $ 42.90 $ 36.17Number of employees 206,578 181,468 178,380 174,079 178,692Number of restaurants (3) 2,138 1,994 1,894 1,824 1,773(1) Includes asset impairment charges of $0.8 million, $0.5 million, $4.7 million, $6.2 million and $12.0 million, respectively.(2) Fiscal year 2009 consisted of 53 weeks while all other fiscal years consisted of 52 weeks.(3) Consistent with our consolidated financial statements, information has been presented on a continuing operations basis. Accordingly, the activities related to Smokey Bones, Rocky River Grillhouse and the nine BahamaBreeze restaurants closed or sold in fiscal 2007 and 2008 have been excluded.(4) Excludes restaurant depreciation and amortization of $373.7 million, $326.9 million, $295.6 million, $283.4 million and $267.1 million, respectively.66 <strong>Darden</strong> <strong>Restaurants</strong>, Inc. <strong>2013</strong> <strong>Annual</strong> <strong>Report</strong>
Board of DirectorsClarence Otis, Jr.Chairman of the Boardand Chief Executive Officer,<strong>Darden</strong> <strong>Restaurants</strong>, Inc.Andrew H. MadsenPresident andChief Operating Officer,<strong>Darden</strong> <strong>Restaurants</strong>, Inc.Michael W. BarnesChief Executive Officer ofSignet Jewelers Limited,a specialty retail jeweler.Dr. Leonard L. BerryPresidential Professor forTeaching Excellence,Distinguished Professor ofMarketing, and M.B. Zale Chairin Retailing and MarketingLeadership, Mays BusinessSchool, Texas A&M University.Christopher J. (CJ) FraleighChairman and Chief ExecutiveOfficer of Shearer’s Foods, Inc,a global manufacturer ofpotato chips andother snack foods.Victoria D. HarkerChief Financial Officerof Gannett Co., Inc.,an international mediaand marketingsolutions company.David H. HughesRetired Chairman of the Boardof Hughes Supply, Inc.,a building supply company.Charles A. Ledsinger, Jr.Chairman and Managing Directorof SunBridge Capital Management,LLC , an investment managementfirm. Retired Vice Chairman andChief Executive Officer ofChoice Hotels International, Inc.,a lodging franchisor.William M. Lewis, Jr.Managing Director andCo-Chairman of InvestmentBanking for Lazard Ltd.,an investment banking firm.Senator Connie Mack, IIIChairman Emeritus of LibertyPartners Group, a publicpolicy consulting firm.Former U.S. Senator.Michael D. RoseChairman of the Board ofMidaro Investments, Inc.,a privately held investment firm.Retired Chairman of the Boardof First Horizon NationalCorporation, a nationalfinancial services company.Maria A. SastrePresident and Chief OperatingOfficer of Signature FlightSupport Corporation,a fixed-based operation anddistribution network forbusiness aviation services.William S. SimonExecutive Vice Presidentof Wal-Mart Stores, Inc.,a global retailer, and Presidentand Chief Executive Officerof Walmart U.S.<strong>Darden</strong> <strong>Restaurants</strong>, Inc. <strong>2013</strong> <strong>Annual</strong> <strong>Report</strong> 67
Executive and Operating TeamsRonald BojaladSenior Vice President,Group HumanResourcesDavid GeorgePresident,Olive GardenValerie InsignaresPresident,LongHorn SteakhouseJames LawrenceSenior Vice President,Chief Supply ChainOfficerEugene LeePresident,Specialty RestaurantGroupKim LopdrupSenior Vice President,Business DevelopmentDave LothropSenior Vice President,Corporate ControllerRobert McAdamSenior Vice President,Government andCommunity AffairsDaisy NgSenior Vice President,Chief HumanResources OfficerDavid PickensChief RestaurantOperations OfficerPatti Reilly-WhiteSenior Vice President,Chief InformationOfficerBrad RichmondSenior Vice President,Chief Financial OfficerTeresa SebastianSenior Vice President,General Counseland SecretaryWill SetliffSenior Vice President,Chief MarketingOfficerSalli A. SettaPresident,Red LobsterSuk SinghSenior Vice President,Chief DevelopmentOfficer68 <strong>Darden</strong> <strong>Restaurants</strong>, Inc. <strong>2013</strong> <strong>Annual</strong> <strong>Report</strong>
Shareholder InformationCompany Address<strong>Darden</strong> <strong>Restaurants</strong>, Inc.1000 <strong>Darden</strong> Center DriveOrlando, FL 32837(407) 245-4000Mailing Address<strong>Darden</strong> <strong>Restaurants</strong>, Inc.P.O. Box 695011Orlando, FL 32869-5011Website Addresseswww.darden.comwww.redlobster.comwww.olivegarden.comwww.longhornsteakhouse.comwww.bahamabreeze.comwww.seasons52.comwww.thecapitalgrille.comwww.eddiev.comwww.yardhouse.comTransfer Agent, Registrar andDividend PaymentsWells Fargo Shareowner Services1110 Centre Pointe Curve, Suite 101MAC N9173-010Mendota Heights, MN 55120Phone: (877) 602-7596 or (651) 450-4064www.wellsfargo.com/com/investments/shareowner_servicesAddress correspondence as appropriate to theattention of:Address ChangesStock TransfersShareholder ServicesIndependent Registered Public Accounting FirmKPMG LLP111 North Orange AvenueSuite 1600Orlando, FL 32801Phone: (407) 423-3426Shareholder <strong>Report</strong>s/<strong>Investor</strong> InquiriesShareholders seeking information about <strong>Darden</strong> <strong>Restaurants</strong>, Inc.are invited to contact the <strong>Investor</strong> <strong>Relations</strong> Department at(800) 832-7336. Shareholders may request to receive,free of charge, copies of quarterly earnings releases.Information may also be obtained by visiting ourwebsite at www.darden.com. <strong>Annual</strong> reports, SEC filings,press releases and other Company news are readily availableon the website.Our website also includes corporate governance information,including our Corporate Governance Guidelines, Code of BusinessConduct and Ethics, and board committee charters, including thecharters for our Audit, Compensation and Nominating andGovernance Committees.Notice of <strong>Annual</strong> MeetingThe <strong>Annual</strong> Meeting of Shareholders will be held at 10:00 a.m.Eastern Daylight Savings Time on Wednesday, September 18,<strong>2013</strong>, at the The Peabody Orlando, 9801 International Drive,Orlando, Florida 32819.As of the close of business on June 28, <strong>2013</strong>, we had 41,679registered shareholders of record.MarketsNew York Stock ExchangeStock Exchange Symbol: DRIIn alignment with <strong>Darden</strong>’s commitment to sustainability,parts of this report have been printed on paper thatis manufactured with 10% post-consumer waste. Theseforests are certified to a responsibly managed forestmanagement standard.Diversity is both a core value and a competitive advantagefor <strong>Darden</strong>. As an example of our continuing commitment todiversity, this annual report was designed by a woman-ownedcompany, Corporate <strong>Report</strong>s Inc., Atlanta, GA. Printed byColorGraphics, Los Angeles, CA.Form 10-K <strong>Report</strong>Shareholders may request a free copy of ourForm 10-K, including schedules but excludingexhibits, by writing to:<strong>Investor</strong> <strong>Relations</strong>, <strong>Darden</strong> <strong>Restaurants</strong>, Inc.P.O. Box 695011, Orlando, FL 32869-5011Forward-Looking StatementsThis report contains forward-looking statements. By their nature,forward-looking statements involve risks and uncertainties thatcould cause actual results to differ materially from those set forthin or implied by such forward-looking statements. Additionalcautionary and other information with respect to these forwardlookingstatements is set forth in “Management’s Discussionand Analysis of Financial Condition and Results of Operations –Forward-Looking Statements.”
®1000 <strong>Darden</strong> Center DriveOrlando, FL 32837407-245-4000www.darden.com