Management’s Discussion and Analysisof Financial Condition and Results of Operations<strong>Darden</strong>This discussion and analysis below for <strong>Darden</strong> <strong>Restaurants</strong>, Inc. (<strong>Darden</strong>, theCompany, we, us or our) should be read in conjunction with our consolidatedfinancial statements and related financial statement notes found elsewhere inthis report. We operate on a 52/53 week fiscal year, which ends on the last Sundayin May. Fiscal <strong>2013</strong>, 2012 and 2011 each consisted of 52 weeks of operation.OVERVIEW OF OPERATIONSOur business operates in the full-service dining segment of the restaurant industry,primarily in the United States. At May 26, <strong>2013</strong>, we operated 2,138 Olive Garden®,Red Lobster®, LongHorn Steakhouse®, The Capital Grille®, Yard House®, BahamaBreeze®, Seasons 52®, Eddie V’s Prime Seafood® and Wildfish Seafood Grille®restaurants in the United States and Canada. Through subsidiaries, we own andoperate all of our restaurants in the United States and Canada, except for threerestaurants located in Central Florida and three restaurants in California that areowned jointly by us and third parties, and managed by us, and five franchisedrestaurants in Puerto Rico. We also have area development and franchise agreementswith unaffiliated operators to develop and operate our brands in Japan,the Middle East and Latin America. Pursuant to these agreements, as of May 26,<strong>2013</strong>, 37 franchised restaurants were in operation in Japan, the Middle East,Puerto Rico and Mexico.On August 29, 2012, we completed the acquisition of Yard House USA, Inc.(Yard House) for $585.0 million in cash. The acquired operations of Yard Houseincluded 40 restaurants that are included in the results of operations in ourconsolidated financial statements from the date of acquisition.Our mission is to be the best in full-service dining, now and for generations.We believe we can achieve this goal by continuing to build on our strategy to bea multi-brand restaurant growth company, which is grounded in:• Brand relevance;• Brand support;• A vibrant business model;• Competitively superior leadership; and• A unifying, motivating culture.We seek to increase profits by leveraging our fixed and semi-fixed costs withsales from new restaurants and increased guest traffic and sales at existing restaurants.To evaluate our operations and assess our financial performance, we monitora number of operating measures, with a special focus on two key factors:• Same-restaurant sales – which is a year-over-year comparison of eachperiod’s sales volumes for restaurants open at least 16 months, includingrecently acquired restaurants, regardless of when the restaurants wereacquired; and• Restaurant earnings – which is restaurant-level profitability (restaurantsales, less restaurant-level cost of sales, marketing and depreciation).Increasing same-restaurant sales can improve restaurant earnings becausethese incremental sales provide better leverage of our fixed and semi-fixedrestaurant-level costs. A restaurant brand can generate same-restaurant salesincreases through increases in guest traffic, increases in the average guest check,or a combination of the two. The average guest check can be impacted by menuprice changes and by the mix of menu items sold. For each restaurant brand, wegather daily sales data and regularly analyze the guest traffic counts and themix of menu items sold to aid in developing menu pricing, product offerings andpromotional strategies. We view same-restaurant guest counts as a measure ofthe long-term health of a restaurant brand, while increases in average check andmenu mix may contribute more significantly to near-term profitability. We focuson balancing our pricing and product offerings with other initiatives to producesustainable same-restaurant sales growth.We compute same-restaurant sales using restaurants open at least 16 monthsbecause this period is generally required for new restaurant sales levels to normalize.Sales at newly opened restaurants generally do not make a significantcontribution to profitability in their initial months of operation due to operatinginefficiencies. Our sales and expenses can be impacted significantly by the numberand timing of new restaurant openings and closings, relocation and remodeling ofexisting restaurants. Pre-opening expenses each period reflect the costs associatedwith opening new restaurants in current and future periods.Fiscal <strong>2013</strong> Financial HighlightsOur sales from continuing operations were $8.55 billion in fiscal <strong>2013</strong> comparedto $8.00 billion in fiscal 2012. The 6.9 percent increase was primarily driven bythe addition of 104 net new company-owned restaurants plus the addition of40 Yard House purchased restaurants and a 2.1 percent blended same-restaurantsales increase for The Capital Grille, Bahama Breeze and Seasons 52, partiallyoffset by the 1.3 percent blended same-restaurant sales decrease for Olive Garden,Red Lobster and LongHorn Steakhouse.Net earnings from continuing operations for fiscal <strong>2013</strong> were $412.6 million($3.14 per diluted share) compared with net earnings from continuing operationsfor fiscal 2012 of $476.5 million ($3.58 per diluted share). Net earningsfrom continuing operations for fiscal <strong>2013</strong> decreased 13.4 percent and dilutednet earnings per share from continuing operations decreased 12.3 percentcompared with fiscal 2012.Our net losses from discontinued operations were $0.7 million ($0.01 perdiluted share) for fiscal <strong>2013</strong>, compared with net losses from discontinuedoperations of $1.0 million ($0.01 per diluted share) for fiscal 2012. When combinedwith results from continuing operations, our diluted net earnings pershare were $3.13 and $3.57 for fiscal <strong>2013</strong> and 2012, respectively.Outlook and StrategyWe expect blended U.S. same-restaurant sales in fiscal 2014 to range from flat toan increase of 2.0 percent for Olive Garden, Red Lobster and LongHorn Steakhouse.Including the impact from operations of Yard House, we expect fiscal 2014 totalsales to increase between 6.0 percent and 8.0 percent. We expect food and beverageexpenses to be higher as a percent of sales based on our expectations of foodcost inflation. We also expect restaurant labor expenses to be higher as a percentof sales based on our expectations that manager incentive compensation willreturn to normal levels and the anticipated costs associated with implementationof the Affordable Care Act. We expect our remaining expense line items, restaurantexpenses, selling, general and administrative expenses and depreciation expense,to be relatively flat as a percent of sales. We expect diluted net earnings per share18 <strong>Darden</strong> <strong>Restaurants</strong>, Inc. <strong>2013</strong> <strong>Annual</strong> <strong>Report</strong>
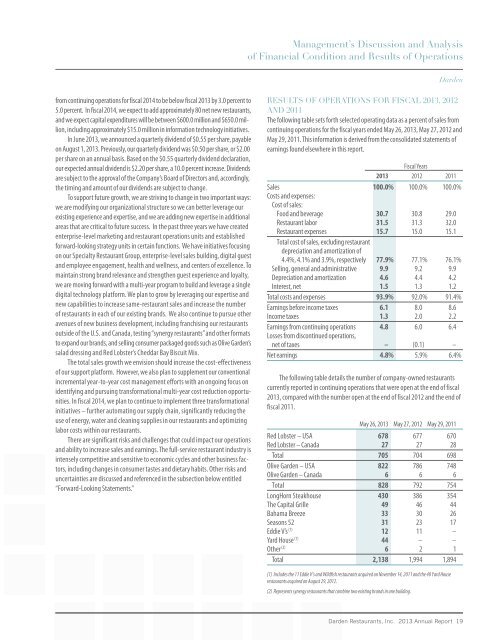
Management’s Discussion and Analysisof Financial Condition and Results of Operations<strong>Darden</strong>from continuing operations for fiscal 2014 to be below fiscal <strong>2013</strong> by 3.0 percent to5.0 percent. In fiscal 2014, we expect to add approximately 80 net new restaurants,and we expect capital expenditures will be between $600.0 million and $650.0 million,including approximately $15.0 million in information technology initiatives.In June <strong>2013</strong>, we announced a quarterly dividend of $0.55 per share, payableon August 1, <strong>2013</strong>. Previously, our quarterly dividend was $0.50 per share, or $2.00per share on an annual basis. Based on the $0.55 quarterly dividend declaration,our expected annual dividend is $2.20 per share, a 10.0 percent increase. Dividendsare subject to the approval of the Company’s Board of Directors and, accordingly,the timing and amount of our dividends are subject to change.To support future growth, we are striving to change in two important ways:we are modifying our organizational structure so we can better leverage ourexisting experience and expertise, and we are adding new expertise in additionalareas that are critical to future success. In the past three years we have createdenterprise-level marketing and restaurant operations units and establishedforward-looking strategy units in certain functions. We have initiatives focusingon our Specialty Restaurant Group, enterprise-level sales building, digital guestand employee engagement, health and wellness, and centers of excellence. Tomaintain strong brand relevance and strengthen guest experience and loyalty,we are moving forward with a multi-year program to build and leverage a singledigital technology platform. We plan to grow by leveraging our expertise andnew capabilities to increase same-restaurant sales and increase the numberof restaurants in each of our existing brands. We also continue to pursue otheravenues of new business development, including franchising our restaurantsoutside of the U.S. and Canada, testing “synergy restaurants” and other formatsto expand our brands, and selling consumer packaged goods such as Olive Garden’ssalad dressing and Red Lobster’s Cheddar Bay Biscuit Mix.The total sales growth we envision should increase the cost-effectivenessof our support platform. However, we also plan to supplement our conventionalincremental year-to-year cost management efforts with an ongoing focus onidentifying and pursuing transformational multi-year cost reduction opportunities.In fiscal 2014, we plan to continue to implement three transformationalinitiatives – further automating our supply chain, significantly reducing theuse of energy, water and cleaning supplies in our restaurants and optimizinglabor costs within our restaurants.There are significant risks and challenges that could impact our operationsand ability to increase sales and earnings. The full-service restaurant industry isintensely competitive and sensitive to economic cycles and other business factors,including changes in consumer tastes and dietary habits. Other risks anduncertainties are discussed and referenced in the subsection below entitled“Forward-Looking Statements.”RESULTS OF OPERATIONS FOR FISCAL <strong>2013</strong>, 2012AND 2011The following table sets forth selected operating data as a percent of sales fromcontinuing operations for the fiscal years ended May 26, <strong>2013</strong>, May 27, 2012 andMay 29, 2011. This information is derived from the consolidated statements ofearnings found elsewhere in this report.Fiscal Years<strong>2013</strong> 2012 2011Sales 100.0% 100.0% 100.0%Costs and expenses:Cost of sales:Food and beverage 30.7 30.8 29.0Restaurant labor 31.5 31.3 32.0Restaurant expenses 15.7 15.0 15.1Total cost of sales, excluding restaurantdepreciation and amortization of4.4%, 4.1% and 3.9%, respectively 77.9% 77.1% 76.1%Selling, general and administrative 9.9 9.2 9.9Depreciation and amortization 4.6 4.4 4.2Interest, net 1.5 1.3 1.2Total costs and expenses 93.9% 92.0% 91.4%Earnings before income taxes 6.1 8.0 8.6Income taxes 1.3 2.0 2.2Earnings from continuing operations 4.8 6.0 6.4Losses from discontinued operations,net of taxes – (0.1) –Net earnings 4.8% 5.9% 6.4%The following table details the number of company-owned restaurantscurrently reported in continuing operations that were open at the end of fiscal<strong>2013</strong>, compared with the number open at the end of fiscal 2012 and the end offiscal 2011.May 26, <strong>2013</strong> May 27, 2012 May 29, 2011Red Lobster – USA 678 677 670Red Lobster – Canada 27 27 28Total 705 704 698Olive Garden – USA 822 786 748Olive Garden – Canada 6 6 6Total 828 792 754LongHorn Steakhouse 430 386 354The Capital Grille 49 46 44Bahama Breeze 33 30 26Seasons 52 31 23 17Eddie V’s (1) 12 11 –Yard House (1) 44 – –Other (2) 6 2 1Total 2,138 1,994 1,894(1) Includes the 11 Eddie V’s and Wildfish restaurants acquired on November 14, 2011 and the 40 Yard Houserestaurants acquired on August 29, 2012.(2) Represents synergy restaurants that combine two existing brands in one building.<strong>Darden</strong> <strong>Restaurants</strong>, Inc. <strong>2013</strong> <strong>Annual</strong> <strong>Report</strong> 19


