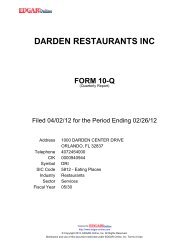
Consolidated Statements of Cash Flows<strong>Darden</strong>Fiscal Year EndedMay 26, May 27, May 29,(in millions) <strong>2013</strong> 2012 2011Cash flows – operating activitiesNet earnings $ 411.9 $ 475.5 $ 476.3Losses from discontinued operations, net of tax 0.7 1.0 2.4Adjustments to reconcile net earnings from continuing operations to cash flows:Depreciation and amortization 394.8 349.1 316.8Asset impairment charges, net 0.8 0.5 4.7Amortization of loan costs 13.0 6.7 2.8Stock-based compensation expense 49.3 56.1 66.6Change in current assets and liabilities 40.1 (191.4) 12.2Contributions to pension and postretirement plan (3.2) (22.7) (13.2)Loss on disposal of land, buildings and equipment 8.1 7.1 6.9Change in cash surrender value of trust-owned life insurance (16.8) 4.1 (13.7)Deferred income taxes (2.1) 36.1 28.8Change in deferred rent 26.8 18.5 17.1Change in other assets and liabilities 17.1 15.8 (15.4)Income tax benefits from exercise of stock-based compensation credited to goodwill 0.1 0.6 0.2Other, net 8.9 5.2 2.2Net cash provided by operating activities of continuing operations $ 949.5 $ 762.2 $ 894.7Cash flows – investing activitiesPurchases of land, buildings and equipment (685.6) (639.7) (547.7)Proceeds from disposal of land, buildings and equipment 0.4 3.3 7.0Purchases of marketable securities (12.9) (32.1) (6.5)Proceeds from sale of marketable securities 26.0 21.3 5.1Cash used in business acquisitions, net of cash acquired (577.4) (58.5) –Increase in other assets (40.9) (15.9) (10.6)Net cash used in investing activities of continuing operations $(1,290.4) $ (721.6) $ (552.7)Cash flows – financing activitiesProceeds from issuance of common stock 64.4 70.2 63.0Income tax benefits credited to equity 13.6 17.9 17.7Dividends paid (258.2) (223.9) (175.5)Purchases of common stock (52.4) (375.1) (385.5)ESOP note receivable repayments 1.1 2.1 1.8Proceeds from issuance of short-term debt 2,670.3 2,321.0 1,454.9Repayments of short-term debt (2,768.4) (2,243.8) (1,269.4)Repayments of long-term debt (355.9) (2.1) (226.8)Proceeds from issuance of long-term debt 1,050.0 400.0 –Payment of debt issuance costs (7.4) (5.1) –Principal payments on capital leases (1.7) (1.6) (1.2)Net cash provided by (used in) financing activities of continuing operations $ 355.4 $ (40.4) $ (521.0)Cash flows – discontinued operationsNet cash used in operating activities of discontinued operations (0.2) (0.5) (2.1)Net cash provided by investing activities of discontinued operations 3.4 0.3 2.8Net cash provided by (used in) discontinued operations $ 3.2 $ (0.2) $ 0.7Increase (decrease) in cash and cash equivalents 17.7 – (178.3)Cash and cash equivalents – beginning of year 70.5 70.5 248.8Cash and cash equivalents – end of year $ 88.2 $ 70.5 $ 70.5Cash flows from changes in current assets and liabilitiesReceivables, net (9.4) (6.1) (5.9)Inventories 50.6 (103.0) (79.3)Prepaid expenses and other current assets (11.7) (6.6) (5.0)Accounts payable 10.8 (10.2) 5.5Accrued payroll (9.3) (13.3) 5.3Prepaid/accrued income taxes 22.5 (16.3) 4.7Other accrued taxes 6.4 (3.9) 2.3Unearned revenues 36.4 31.1 27.3Other current liabilities (56.2) (63.1) 57.3Change in current assets and liabilities $ 40.1 $ (191.4) $ 12.2See accompanying notes to consolidated financial statements.38 <strong>Darden</strong> <strong>Restaurants</strong>, Inc. <strong>2013</strong> <strong>Annual</strong> <strong>Report</strong>
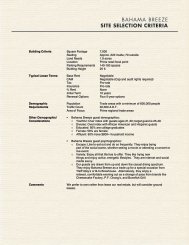
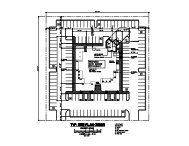
Notes to Consolidated Financial Statements<strong>Darden</strong>NOTE 1SUMMARY OF SIGNIFICANTACCOUNTING POLICIESOperations and Principles ofConsolidationThe accompanying consolidated financial statements include the operations of<strong>Darden</strong> <strong>Restaurants</strong>, Inc. and its wholly owned subsidiaries (<strong>Darden</strong>, the Company,we, us or our). We own and operate the Olive Garden®, Red Lobster®, LongHornSteakhouse®, The Capital Grille®, Yard House®, Bahama Breeze®, Seasons 52®,Eddie V’s Prime Seafood® and Wildfish Seafood Grille® restaurant brands locatedin the United States and Canada. Through subsidiaries, we own and operate allof our restaurants in the United States and Canada, except for three restaurantslocated in Central Florida and three restaurants in California that are owned jointlyby us and third parties, and managed by us, and five franchised restaurants inPuerto Rico. We also have area development and franchise agreements withunaffiliated operators to develop and operate our brands in Japan, the Middle Eastand Latin America. Pursuant to these agreements, as of May 26, <strong>2013</strong>, 37 franchisedrestaurants were in operation in Japan, the Middle East, Puerto Rico and Mexico.All significant inter-company balances and transactions have been eliminatedin consolidation.Basis of PresentationOn August 29, 2012, we completed the acquisition of Yard House USA, Inc.(Yard House) for $585.0 million in cash. The acquired operations of Yard Houseincluded 40 restaurants that are included in the results of operations in ourconsolidated financial statements from the date of acquisition.The assets and liabilities of Yard House were recorded at their respectivefair values as of the date of acquisition. The following table summarizes thefinal allocation of the purchase price as of May 26, <strong>2013</strong>:(in millions)FinalCurrent assets $ 16.0Buildings and equipment 152.2Trademark 109.3Other assets 9.8Goodwill 369.8Total assets acquired $657.1Current liabilities 40.8Other liabilities 31.3Total liabilities assumed $ 72.1Net assets acquired $585.0The excess of the purchase price over the aggregate fair value of net assetsacquired was allocated to goodwill. Of the $369.8 million recorded as goodwill,$37.9 million is expected to be deductible for tax purposes. The portion of thepurchase price attributable to goodwill represents benefits expected as a resultof the acquisition, including sales and unit growth opportunities in addition tosupply-chain and administrative cost synergies. The trademark has an indefinitelife based on the expected use of the asset and the regulatory and economicenvironment within which it is being used. The trademark represents a highlyrespected brand with positive connotations and we intend to cultivate and protectthe use of this brand. Goodwill and indefinite-lived trademarks are not amortizedbut are reviewed annually for impairment or more frequently if indicators ofimpairment exist. Buildings and equipment will be depreciated over a period of7 months to 21 years. Other assets and liabilities include values associated withfavorable and unfavorable market leases that will be amortized over a weightedaverageperiod of 16 years.As a result of the acquisition and related integration efforts, we incurredexpenses of approximately $12.3 million (net of tax) during the fiscal year endedMay 26, <strong>2013</strong> which are included in restaurant expenses, selling, general andadministrative expenses and depreciation expense in our consolidated statementsof earnings. Pro-forma financial information for the combined entities for periodsprior to the acquisition is not presented due to the immaterial impact of thefinancial results of Yard House on our consolidated financial statements.During fiscal 2007 and 2008 we closed or sold all Smokey Bones Barbeque &Grill (Smokey Bones) and Rocky River Grillhouse restaurants and we closed nineBahama Breeze restaurants. These restaurants and their related activities havebeen classified as discontinued operations. Therefore, for fiscal <strong>2013</strong>, 2012 and2011, all impairment losses and disposal costs, gains and losses on dispositionattributable to these restaurants have been aggregated in a single caption entitled“Losses from discontinued operations, net of tax benefit” on the accompanyingconsolidated statements of earnings.Unless otherwise noted, amounts and disclosures throughout these notesto consolidated financial statements relate to our continuing operations.Fiscal YearWe operate on a 52/53 week fiscal year, which ends on the last Sunday in May.Fiscal <strong>2013</strong>, 2012 and 2011 consisted of 52 weeks of operation.Use of EstimatesWe prepare our consolidated financial statements in conformity with U.S.generally accepted accounting principles. The preparation of these financialstatements requires us to make estimates and assumptions that affect thereported amounts of assets and liabilities and disclosure of contingent assetsand liabilities at the date of the financial statements, and the reported amountsof sales and expenses during the reporting period. Actual results could differfrom those estimates.Cash EquivalentsCash equivalents include highly liquid investments such as U.S. Treasury bills,taxable municipal bonds and money market funds that have an original maturityof three months or less. Amounts receivable from credit card companies arealso considered cash equivalents because they are both short term and highlyliquid in nature and are typically converted to cash within three days of thesales transaction.<strong>Darden</strong> <strong>Restaurants</strong>, Inc. <strong>2013</strong> <strong>Annual</strong> <strong>Report</strong> 39