NFEPA Atlas 5.3_20111025_FINAL.indd - Biodiversity GIS - SANBI
NFEPA Atlas 5.3_20111025_FINAL.indd - Biodiversity GIS - SANBI
NFEPA Atlas 5.3_20111025_FINAL.indd - Biodiversity GIS - SANBI
- No tags were found...

You also want an ePaper? Increase the reach of your titles
YUMPU automatically turns print PDFs into web optimized ePapers that Google loves.
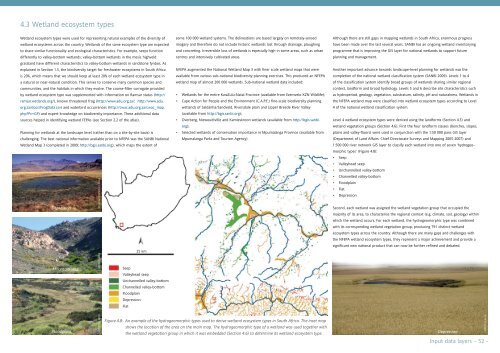
4.3 Wetland ecosystem typesWetland ecosystem types were used for representing natural examples of the diversity ofwetland ecosystems across the country. Wetlands of the same ecosystem type are expectedto share similar functionality and ecological characteristics. For example, seeps functiondifferently to valley-bottom wetlands; valley-bottom wetlands in the mesic highveldgrassland have different characteristics to valley-bottom wetlands in sandstone fynbos. Asexplained in Section 1.5, the biodiversity target for freshwater ecosystems in South Africais 20%, which means that we should keep at least 20% of each wetland ecosystem type ina natural or near-natural condition. This serves to conserve many common species andcommunities, and the habitats in which they evolve. The coarse-filter surrogate providedby wetland ecosystem type was supplemented with information on Ramsar status (http://ramsar.wetlands.org/), known threatened frog (http://www.adu.org.za/; http://www.adu.org.za/docs/FrogData.csv) and waterbird occurrences (http://cwac.adu.org.za/cwac_map.php?Pv=GP) and expert knowledge on biodiversity importance. These additional datasources helped in identifying wetland FEPAs (see Section 2.2 of the atlas).Planning for wetlands at the landscape level (rather than on a site-by-site basis) ischallenging. The best national information available prior to <strong>NFEPA</strong> was the <strong>SANBI</strong> NationalWetland Map 3 (completed in 2009; http://bgis.sanbi.org), which maps the extent ofDepressionMountain seepPeter Chadwick/WWF-SAKate Snaddon25 kmSeepValleyhead seepUnchannelled valley-bottomChannelled valley-bottomFloodplainDepressionFlatsome 100 000 wetland systems. The delineations are based largely on remotely-sensedimagery and therefore do not include historic wetlands lost through drainage, ploughingand concreting. Irreversible loss of wetlands is especially high in some areas, such as urbancentres and intensively cultivated areas.<strong>NFEPA</strong> augmented the National Wetland Map 3 with finer scale wetland maps that wereavailable from various sub-national biodiversity planning exercises. This produced an <strong>NFEPA</strong>wetland map of almost 200 000 wetlands. Sub-national wetland data included:• Wetlands for the entire KwaZulu-Natal Province (available from Ezemvelo KZN Wildlife);• Cape Action for People and the Environment (C.A.P.E.) fine-scale biodiversity planningwetlands of Saldanha/Sandveld, Riversdale plain and Upper Breede River Valley(available from http://bgis.sanbi.org);• Overberg, Niewoudtville and Kamieskroon wetlands (available from http://bgis.sanbi.org);• Selected wetlands of conservation importance in Mpumalanga Province (available fromMpumalanga Parks and Tourism Agency).Although there are still gaps in mapping wetlands in South Africa, enormous progresshave been made over the last several years. <strong>SANBI</strong> has an ongoing wetland inventoryingprogramme that is improving the <strong>GIS</strong> layer for national wetlands to support futureplanning and management.Another important advance towards landscape-level planning for wetlands was thecompletion of the national wetland classification system (<strong>SANBI</strong> 2009). Levels 1 to 4of the classification system identify broad groups of wetlands sharing similar regionalcontext, landform and broad hydrology. Levels 5 and 6 describe site characteristics suchas hydroperiod, geology, vegetation, substratum, salinity, pH and naturalness. Wetlands inthe <strong>NFEPA</strong> wetland map were classified into wetland ecosystem types according to Level4 of the national wetland classification system.Level 4 wetland ecosystem types were derived using the landforms (Section 4.5) andwetland vegetation groups (Section 4.6). First the four landform classes (benches, slopes,plains and valley-floors) were used in conjunction with the 1:50 000 pans <strong>GIS</strong> layer(Department of Land Affairs: Chief Directorate Surveys and Mapping 2005-2007) and1:500 000 river network <strong>GIS</strong> layer to classify each wetland into one of seven ‘hydrogeomorphictypes’ (Figure 4.8):• Seep• Valleyhead seep• Unchannelled valley-bottom• Channelled valley-bottom• Floodplain• Flat• DepressionSecond, each wetland was assigned the wetland vegetation group that occupied themajority of its area, to characterise the regional context (e.g. climate, soil, geology) withinwhich the wetland occurs. For each wetland, the hydrogeomorphic type was combinedwith its corresponding wetland vegetation group, producing 791 distinct wetlandecosystem types across the country. Although there are many gaps and challenges withthe <strong>NFEPA</strong> wetland ecosystem types, they represent a major achievement and provide asignificant new national product that can now be further refined and debated.FloodplainKate SnaddonFigure 4.8: An example of the hydrogeomorphic types used to derive wetland ecosystem types in South Africa. The inset mapshows the location of the area on the main map. The hydrogeomorphic type of a wetland was used together withthe wetland vegetation group in which it was embedded (Section 4.6) to determine its wetland ecosystem type.DepressionKate SnaddonInput data layers- 52 -