- Page 1 and 2:
Dottorato di Ricercain Ingegneria d
- Page 7:
AcknowledgementsI would like to exp
- Page 10 and 11:
Abstractinclusion of fibers and the
- Page 13:
ContentsAcknowledgementsAbstractTab
- Page 16 and 17:
Contents8.6.1 Tensile tests . . . .
- Page 18 and 19:
List of Figures2.1 Fine and coarse
- Page 20 and 21:
List of Figures4.16 Pull-out simula
- Page 22 and 23:
List of Figures6.14 Crack paths of
- Page 25:
List of Tables2.1 Mix design per cu
- Page 28 and 29:
Chapter 1. Introduction1.1.1 Fiber
- Page 30 and 31:
Chapter 1. Introductionthe fiber ad
- Page 32 and 33:
Chapter 1. Introductionand mechanic
- Page 34 and 35:
Chapter 1. Introduction[Vrech and E
- Page 36 and 37:
Chapter 1. IntroductionDespite the
- Page 38 and 39:
Chapter 1. Introduction(Figure 1.4)
- Page 40 and 41:
Chapter 1. IntroductionFigure 1.8:
- Page 42 and 43:
Chapter 1. Introductionfor structur
- Page 44 and 45:
Chapter 1. Introductioncracking beh
- Page 46 and 47:
Chapter 1. Introduction• "c" if 0
- Page 48 and 49:
Chapter 1. Introductionsumed due to
- Page 50 and 51:
Chapter 1. Introductionaleatoric na
- Page 52 and 53:
Chapter 1. IntroductionFigure 1.13:
- Page 54 and 55:
Chapter 1. IntroductionElement Meth
- Page 56 and 57:
Chapter 2. Experimental characteriz
- Page 58 and 59:
Chapter 2. Experimental characteriz
- Page 60 and 61:
Chapter 2. Experimental characteriz
- Page 62 and 63:
Chapter 2. Experimental characteriz
- Page 64 and 65:
Chapter 2. Experimental characteriz
- Page 66 and 67:
Chapter 2. Experimental characteriz
- Page 68 and 69:
Chapter 2. Experimental characteriz
- Page 70 and 71:
Chapter 3. Zero-thickness interface
- Page 72 and 73:
Chapter 3. Zero-thickness interface
- Page 74 and 75:
Chapter 3. Zero-thickness interface
- Page 76 and 77:
Chapter 3. Zero-thickness interface
- Page 78 and 79:
Chapter 3. Zero-thickness interface
- Page 80 and 81:
Chapter 3. Zero-thickness interface
- Page 82 and 83:
Chapter 3. Zero-thickness interface
- Page 84 and 85:
Chapter 3. Zero-thickness interface
- Page 86 and 87:
Chapter 3. Zero-thickness interface
- Page 88 and 89:
Chapter 3. Zero-thickness interface
- Page 90 and 91:
Chapter 3. Zero-thickness interface
- Page 93 and 94: 4 Bond behavior of fibers in cement
- Page 95 and 96: 4.2. Bond behavior of fibers in con
- Page 97 and 98: 4.3. Elasto-plastic joint/interface
- Page 99 and 100: 4.3. Elasto-plastic joint/interface
- Page 101 and 102: 4.3. Elasto-plastic joint/interface
- Page 103 and 104: 4.3. Elasto-plastic joint/interface
- Page 105 and 106: 4.3. Elasto-plastic joint/interface
- Page 107 and 108: 4.4. Fracture energy-based interfac
- Page 109 and 110: 4.4. Fracture energy-based interfac
- Page 111 and 112: 4.5. Numerical results and experime
- Page 113 and 114: 4.5. Numerical results and experime
- Page 115 and 116: 4.5. Numerical results and experime
- Page 117 and 118: 4.6. Closing remarksMPa3.02.5Pi N2.
- Page 119 and 120: 5 Model performance and numericalpr
- Page 121 and 122: 5.1. Numerical analysesones mention
- Page 123 and 124: 5.1. Numerical analysesshown in Fig
- Page 125 and 126: 5.1. Numerical analysesconsidered,
- Page 127 and 128: 5.1. Numerical analysestic behavior
- Page 129 and 130: 5.1. Numerical analysesσ MPa121086
- Page 131 and 132: 5.2. Cracking analysis of the propo
- Page 133 and 134: 4 03 02 01 001 0 09 08 07 06 05 04
- Page 135 and 136: 5.2. Cracking analysis of the propo
- Page 137 and 138: 5.2. Cracking analysis of the propo
- Page 139: 5.3. Closing remarksconnecting node
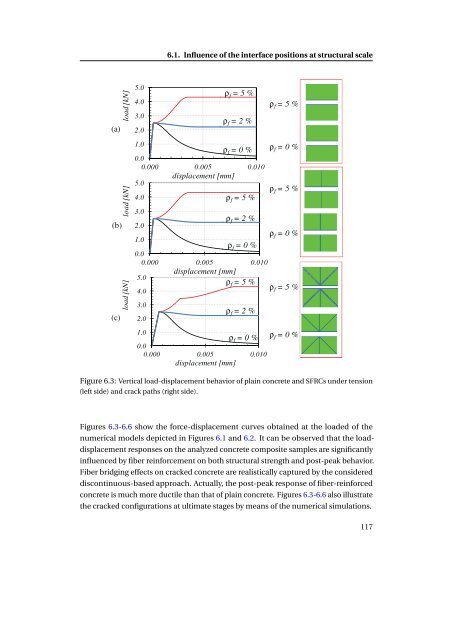
- Page 144 and 145: Chapter 6. Structural scale failure
- Page 146 and 147: Chapter 6. Structural scale failure
- Page 148 and 149: Chapter 6. Structural scale failure
- Page 150 and 151: Chapter 6. Structural scale failure
- Page 152 and 153: Chapter 6. Structural scale failure
- Page 154 and 155: Chapter 6. Structural scale failure
- Page 156 and 157: Chapter 6. Structural scale failure
- Page 158 and 159: Chapter 6. Structural scale failure
- Page 160 and 161: Chapter 6. Structural scale failure
- Page 162 and 163: Chapter 6. Structural scale failure
- Page 164 and 165: Chapter 6. Structural scale failure
- Page 167 and 168: 7 Cracked hinge numerical modelfor
- Page 169 and 170: 7.1. Basic assumptionsSection at no
- Page 171 and 172: 7.1. Basic assumptions1997, Stankow
- Page 173 and 174: 7.2. Bond-slip bridging of fibers o
- Page 175 and 176: 7.4. Numerical predictionsvertical
- Page 177: 7.5. Closing remarksthe experimenta
- Page 180 and 181: Chapter 8. Elasto-plastic microplan
- Page 182 and 183: Chapter 8. Elasto-plastic microplan
- Page 184 and 185: Chapter 8. Elasto-plastic microplan
- Page 186 and 187: Chapter 8. Elasto-plastic microplan
- Page 188 and 189: Chapter 8. Elasto-plastic microplan
- Page 190 and 191: Chapter 8. Elasto-plastic microplan
- Page 192 and 193:
Chapter 8. Elasto-plastic microplan
- Page 194 and 195:
Chapter 8. Elasto-plastic microplan
- Page 196 and 197:
Chapter 8. Elasto-plastic microplan
- Page 198 and 199:
Chapter 8. Elasto-plastic microplan
- Page 200 and 201:
Chapter 9. Conclusionsof first-crac
- Page 202 and 203:
Chapter 9. Conclusionsfibers in con
- Page 204 and 205:
Chapter 9. Conclusions9.6 Future re
- Page 206 and 207:
BibliographyN. Banthia and N. Nanda
- Page 208 and 209:
BibliographyM. Butler, V. Mechtcher
- Page 210 and 211:
BibliographyCUR. Bepaling van de Bu
- Page 212 and 213:
BibliographyEN-12390-3. Testing of
- Page 214 and 215:
BibliographyT. Guttema. Ein Beitrag
- Page 216 and 217:
BibliographyE. Kuhl, P. Steinmann,
- Page 218 and 219:
BibliographyO. Manzoli, J. Oliver,
- Page 220 and 221:
BibliographyK. Park, G. Paulino, an
- Page 222 and 223:
BibliographyI. Singh, B. Mishra, an
- Page 224:
BibliographyG. Wells and L. Sluys.