tesi A. Caggiano.pdf - EleA@UniSA - Università degli Studi di Salerno
tesi A. Caggiano.pdf - EleA@UniSA - Università degli Studi di Salerno
tesi A. Caggiano.pdf - EleA@UniSA - Università degli Studi di Salerno
- No tags were found...

Create successful ePaper yourself
Turn your PDF publications into a flip-book with our unique Google optimized e-Paper software.
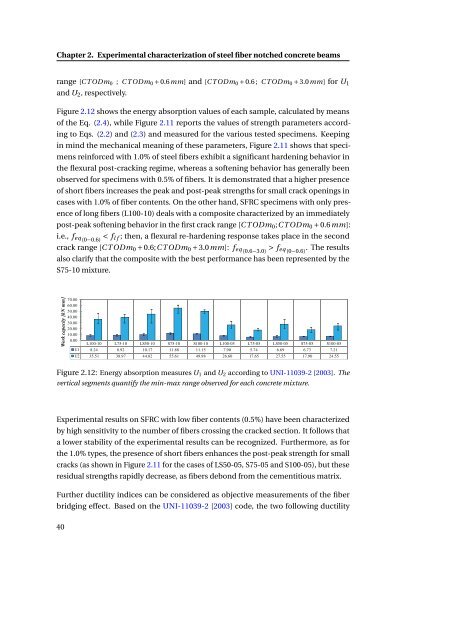
Chapter 2. Experimental characterization of steel fiber notched concrete beamsrange [C T ODm 0 ; C T ODm 0 + 0.6mm] and [C T ODm 0 + 0.6 ; C T ODm 0 + 3.0mm] for U 1and U 2 , respectively.Figure 2.12 shows the energy absorption values of each sample, calculated by meansof the Eq. (2.4), while Figure 2.11 reports the values of strength parameters accor<strong>di</strong>ngto Eqs. (2.2) and (2.3) and measured for the various tested specimens. Keepingin mind the mechanical meaning of these parameters, Figure 2.11 shows that specimensreinforced with 1.0% of steel fibers exhibit a significant hardening behavior inthe flexural post-cracking regime, whereas a softening behavior has generally beenobserved for specimens with 0.5% of fibers. It is demonstrated that a higher presenceof short fibers increases the peak and post-peak strengths for small crack openings incases with 1.0% of fiber contents. On the other hand, SFRC specimens with only presenceof long fibers (L100-10) deals with a composite characterized by an imme<strong>di</strong>atelypost-peak softening behavior in the first crack range [C T ODm 0 ;C T ODm 0 + 0.6mm]:i.e., f eq (0−0.6)< f l f ; then, a flexural re-hardening response takes place in the secondcrack range [C T ODm 0 + 0.6;C T ODm 0 + 3.0mm]: f eq (0.6−3.0)> f eq (0−0.6). The resultsalso clarify that the composite with the best performance has been represented by theS75-10 mixture.Work capacity [kN mm]70.0060.0050.0040.0030.0020.0010.000.00L100-10 L75-10 LS50-10 S75-10 S100-10 L100-05 L75-05 LS50-05 S75-05 S100-05U1 8.24 8.92 10.17 11.88 11.15 7.90 5.74 6.69 6.73 7.21U2 35.51 38.97 44.82 55.61 49.98 26.60 17.65 27.55 17.90 24.55Figure 2.12: Energy absorption measures U 1 and U 2 accor<strong>di</strong>ng to UNI-11039-2 [2003]. Thevertical segments quantify the min-max range observed for each concrete mixture.Experimental results on SFRC with low fiber contents (0.5%) have been characterizedby high sensitivity to the number of fibers crossing the cracked section. It follows thata lower stability of the experimental results can be recognized. Furthermore, as forthe 1.0% types, the presence of short fibers enhances the post-peak strength for smallcracks (as shown in Figure 2.11 for the cases of LS50-05, S75-05 and S100-05), but theseresidual strengths rapidly decrease, as fibers debond from the cementitious matrix.Further ductility in<strong>di</strong>ces can be considered as objective measurements of the fiberbridging effect. Based on the UNI-11039-2 [2003] code, the two following ductility40