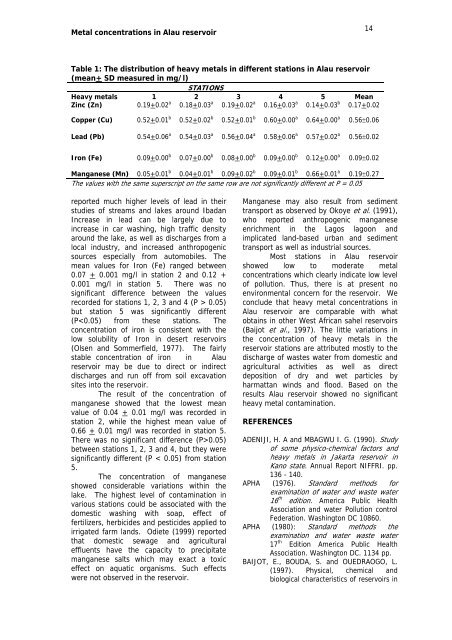
IDOWU, Rachel Toyisi et al.1365.0 km 2 (CBDA 1986). It was constructed in1987 by damming river Ngadda, which wasthe first in a series <strong>of</strong> impoundment’s inBorno-state, and it lies entirely within theNigerian savannah.Three seasonal periods - dry hot, dryharmattan and rainy season - typical <strong>of</strong> theNorth-eastern sahel zone <strong>of</strong> Nigeria dominate.The seasonal rainfall causes flooding <strong>of</strong> thelake and this increases the water level duringthe rainy season. The rainy season lasts <strong>from</strong>June to September. The dry harmattanseason is characterized by low temperatureand high harmattan wind, and lasts <strong>from</strong>October to February. The dry hot season haspronounced high temperature and causesextreme aridity between March and May(Bankole e t al., 1994; Odunze et al., 1995).Sampling Methodology and Analysis:Water samples were collected bimonthly atfive sites on Alau reservoir, <strong>from</strong> October2001-September 2002. Surface watersamples were collected using fabricated 2 litrewater samplers. Samples were placed in acidwashed (10 % HCl) 250 ml polyethylenebottles and taken to the laboratory. In thelaboratory, 200 ml aliquot <strong>of</strong> each originalsample was filtered using 0.45 µ membranefilter, for dissolved metal analysis. The filteredsample was acidified with 1 ml <strong>of</strong>concentrated analytic grade HCl and stored ina polyethylene bottle at 50 0 C. All glasswares, pipettes and filters used in theseprocedures were rinsed with 10% HCl,deionized water and distilled water. Analysis<strong>of</strong> concentrations <strong>of</strong> copper (Cu), iron (Fe),manganese (Mn), lead (Pb) and zinc (Zn)were performed on the filtered, acidifiedsamples (following appropriate dilution orconcentration procedures), using a Perkin-Elmer Atomic Absorption Spectrophotometer(Model 403), as described by Olsen (1975),APHA (1976, 1980), Mackereth et al. (1978),and Boyd (1979). Comparison <strong>of</strong> databetween stations and sampling periods wasmade using one-way ANOVA and t-test at 5%level <strong>of</strong> probability.RESULTS AND DISCUSSIONSThe heavy metal concentrations inwater <strong>from</strong> the different stations in Alaureservoir are presented in Table 1. The tableshows that the concentration <strong>of</strong> dissolvedZinc (Zn) in Alau reservoir ranged <strong>from</strong> 0.14+ 0.3 mg/l in station 5 to 0.19 + 0.02 mg/l instations 1 and 3. There was a significantdifference (P < 0.05) between the valuerecorded in station 5 and all other stations.The values in other stations were notsignificantly different (P > 0.05). Theconcentration <strong>of</strong> zinc showed little fluctuationbetween stations. This may be due to theeffect <strong>of</strong> fertilizers that were applied to theirrigated farm land around the reservoir. Thevalues <strong>of</strong> zinc observed in this study werelower than those recorded in Jankarareservoir which ranged <strong>from</strong> 0.8 to 2.10 mg/l(Adeniji and Mbagwu, 1990). Bincy et al(1994) reported a higher zinc concentration(2.85 mg/l) for lake Nakuru, Kenya. Thevalues recorded in Alau reservoir exceededthe permissible pollution limit <strong>of</strong> 0.10 mg/lrecommended by Deininger (1980), but wasbelow the WHO limit <strong>of</strong> 1.5 mg/l (Kaluku etal., 1987).The copper concentration ranged<strong>from</strong> 0.52 + 0.01 mg/l in stations 1 and 3 to0.64 + 0.01 mg/l in station 5. There was nosignificant difference (P > 0.05) between thevalues in stations 4 and 5, but these weresignificantly different (P < 0.05) <strong>from</strong> thevalues recorded in stations 1, 2 and 3. Thecopper values <strong>of</strong> this study were lower than0.95 mg/l recorded in Arizona desert reservoir(Olsen and Sommerfield, 1977) and showedlittle variation between stations. Thesignificant increase in copper concentration instations 4 and 5 may be linked to theactivities occurring in these stations, such asexcessive run <strong>of</strong>f into the water, humannavigation activities and washing <strong>of</strong> fishingequipment directly into the water.The highest mean value <strong>of</strong> lead (Pb)was 0.58 + 0.06 mg/l recorded in station 4,while the lowest mean value <strong>of</strong> 0.54 + 0.03mg/l was recorded in station 2. No significantdifference was observed between the stations(P > 0.05). The value recorded for leadremained stable throughout the study period.This concentration <strong>of</strong> lead in Alau reservoirwas lower than the concentration recorded inKainji lake where UNIFE (1986) observed arange <strong>of</strong> 0.16 to 0.87 mg/l. The valuerecorded in Alau reservoir may be regardedas adequate for photosynthesis andphytoplankton productivity. GESAMP (1988)observed that low concentration <strong>of</strong> less than0.02 mg/l may affect photosynthesis, as wellas delay embryonic development and reducegrowth in adult fish, molluscs andcrustaceans. Mombeshora et al. (1983).
Metal concentrations in Alau reservoir14Table 1: The distribution <strong>of</strong> heavy metals in different stations in Alau reservoir(mean+ SD measured in mg/l)STATIONSHeavy metals 1 2 3 4 5 MeanZinc (Zn) 0.19+0.02 a 0.18+0.03 a 0.19+0.02 a 0.16+0.03 a 0.14+0.03 b 0.17+0.02Copper (Cu) 0.52+0.01 b 0.52+0.02 b 0.52+0.01 b 0.60+0.00 a 0.64+0.00 a 0.56±0.06Lead (Pb) 0.54+0.06 a 0.54+0.03 a 0.56+0.04 a 0.58+0.06 a 0.57+0.02 a 0.56±0.02Iron (Fe) 0.09+0.00 b 0.07+0.00 b 0.08+0.00 b 0.09+0.00 b 0.12+0.00 a 0.09±0.02Manganese (Mn) 0.05+0.01 b 0.04+0.01 b 0.09+0.02 b 0.09+0.01 b 0.66+0.01 a 0.19±0.27The values with the same superscript on the same row are not significantly different at P = 0.05reported much higher levels <strong>of</strong> lead in theirstudies <strong>of</strong> streams and lakes around IbadanIncrease in lead can be largely due toincrease in car washing, high traffic densityaround the lake, as well as discharges <strong>from</strong> alocal industry, and increased anthropogenicsources especially <strong>from</strong> automobiles. Themean values for Iron (Fe) ranged between0.07 + 0.001 mg/l in station 2 and 0.12 +0.001 mg/l in station 5. There was nosignificant difference between the valuesrecorded for stations 1, 2, 3 and 4 (P > 0.05)but station 5 was significantly different(P0.05)between stations 1, 2, 3 and 4, but they weresignificantly different (P < 0.05) <strong>from</strong> station5.The concentration <strong>of</strong> manganeseshowed considerable variations within thelake. The highest level <strong>of</strong> contamination invarious stations could be associated with thedomestic washing with soap, effect <strong>of</strong>fertilizers, herbicides and pesticides applied toirrigated farm lands. Odiete (1999) reportedthat domestic sewage and agriculturaleffluents have the capacity to precipitatemanganese salts which may exact a toxiceffect on aquatic <strong>org</strong>anisms. Such effectswere not observed in the reservoir.Manganese may also result <strong>from</strong> sedimenttransport as observed by Okoye et al. (1991),who reported anthropogenic manganeseenrichment in the Lagos lagoon andimplicated land-based urban and sedimenttransport as well as industrial sources.Most stations in Alau reservoirshowed low to moderate metalconcentrations which clearly indicate low level<strong>of</strong> pollution. Thus, there is at present noenvironmental concern for the reservoir. Weconclude that heavy metal concentrations inAlau reservoir are comparable with whatobtains in other West African sahel reservoirs(Baijot et al., 1997). The little variations inthe concentration <strong>of</strong> heavy metals in thereservoir stations are attributed mostly to thedischarge <strong>of</strong> wastes water <strong>from</strong> domestic andagricultural activities as well as directdeposition <strong>of</strong> dry and wet particles byharmattan winds and flood. Based on theresults Alau reservoir showed no significantheavy metal contamination.REFERENCESADENIJI, H. A and MBAGWU I. G. (1990). Study<strong>of</strong> some physico-chemical factors andheavy metals in Jakarta reservoir inKano state. Annual Report NIFFRI. pp.136 - 140.APHA (1976). Standard methods forexamination o f water and waste water16 th edition. America Public HealthAssociation and water Pollution controlFederation. Washington DC 10860.APHA (1980): Standard methods theexamination and water waste water17 th Edition America Public HealthAssociation. Washington DC. 1134 pp.BAIJOT, E., BOUDA, S. and OUEDRAOGO, L.(1997). Physical, chemical andbiological characteristics <strong>of</strong> reservoirs in
- Page 2 and 3: Animal ResearchInternational ®Anim
- Page 4 and 5: Animal Research International (2004
- Page 6 and 7: Length-weight relationships of fish
- Page 9 and 10: EZENWAJI, Henry Maduka Godfrey 6sta
- Page 11 and 12: NGWU, Godwin Ikechukwu et al.8Studi
- Page 13 and 14: NGWU, Godwin Ikechukwu et al.betwee
- Page 15: Animal Research International (2004
- Page 19 and 20: Animal Research International (2004
- Page 21 and 22: Oxygen consumption rate of crab18Ef
- Page 23 and 24: Oxygen consumption rate of crab20O
- Page 25 and 26: Oxygen consumption rate of crab22MA
- Page 27 and 28: UBACHUKWU, Patience Obiageli24group
- Page 29: UBACHUKWU, Patience Obiageli26Table
- Page 32 and 33: Perception and treatment of onchoce
- Page 34 and 35: Animal Research International (2004
- Page 36 and 37: Differences in meristic counts of t
- Page 38 and 39: Differences in meristic counts of t
- Page 40 and 41: EYO, Joseph Effiong and INYANG, Nic
- Page 42 and 43: EYO, Joseph Effiong and INYANG, Nic
- Page 44 and 45: EYO, Joseph Effiong and INYANG, Nic
- Page 46 and 47: OSAKWE, Isaac, Ikechukwu and STEING
- Page 48 and 49: OSAKWE, Isaac, Ikechukwu and STEING
- Page 50 and 51: Animal Research International (2004
- Page 52 and 53: Oviposition, fecundity and developm
- Page 54 and 55: Oviposition, fecundity and developm
- Page 56 and 57: OLUAH, Ndubuisi Stanley and MGBENKA
- Page 58 and 59: OLUAH, Ndubuisi Stanley and MGBENKA
- Page 60 and 61: Animal Research International (2004
- Page 62 and 63: Community participation in the cont
- Page 64 and 65: Community participation in the cont
- Page 66 and 67:
Community participation in the cont
- Page 68 and 69:
OKAFOR, Fabian Chukwuemenam et al.6
- Page 70 and 71:
OKAFOR, Fabian Chukwuemenam et al.6
- Page 72 and 73:
OKAFOR, Fabian Chukwuemenam et al.6