Length-weight relationship of fishes from Anambra ... - Zoo-unn.org
Length-weight relationship of fishes from Anambra ... - Zoo-unn.org
Length-weight relationship of fishes from Anambra ... - Zoo-unn.org
- No tags were found...

Create successful ePaper yourself
Turn your PDF publications into a flip-book with our unique Google optimized e-Paper software.
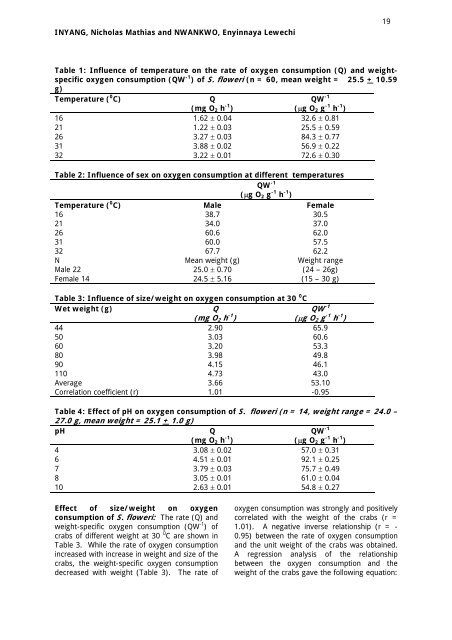
INYANG, Nicholas Mathias and NWANKWO, Enyinnaya Lewechi19Table 1: Influence <strong>of</strong> temperature on the rate <strong>of</strong> oxygen consumption (Q) and <strong>weight</strong>specificoxygen consumption (QW -1 ) <strong>of</strong> S. floweri (n = 60, mean <strong>weight</strong> = 25.5 + 10.59g)Temperature ( 0 C)Q(mg O 2 h -1 )QW -1(µg O 2 g -1 h -1 )16 1.62 ± 0.04 32.6 ± 0.8121 1.22 ± 0.03 25.5 ± 0.5926 3.27 ± 0.03 84.3 ± 0.7731 3.88 ± 0.02 56.9 ± 0.2232 3.22 ± 0.01 72.6 ± 0.30Table 2: Influence <strong>of</strong> sex on oxygen consumption at different temperaturesQW -1(µg O 2 g -1 h -1 )Temperature ( 0 C) Male Female16 38.7 30.521 34.0 37.026 60.6 62.031 60.0 57.532 67.7 62.2N Mean <strong>weight</strong> (g) Weight rangeMale 22 25.0 ± 0.70 (24 – 26g)Female 14 24.5 ± 5.16 (15 – 30 g)Table 3: Influence <strong>of</strong> size/<strong>weight</strong> on oxygen consumption at 30 0 CWet <strong>weight</strong> (g)Q(mg O 2 h -1 )QW -1(µg O 2 g -1 h -1 )44 2.90 65.950 3.03 60.660 3.20 53.380 3.98 49.890 4.15 46.1110 4.73 43.0Average 3.66 53.10Correlation coefficient (r) 1.01 -0.95Table 4: Effect <strong>of</strong> pH on oxygen consumption <strong>of</strong> S. floweri (n = 14, <strong>weight</strong> range = 24.0 –27.0 g, mean <strong>weight</strong> = 25.1 + 1.0 g)pHQ(mg O 2 h -1 )QW -1(µg O 2 g -1 h -1 )4 3.08 ± 0.02 57.0 ± 0.316 4.51 ± 0.01 92.1 ± 0.257 3.79 ± 0.03 75.7 ± 0.498 3.05 ± 0.01 61.0 ± 0.0410 2.63 ± 0.01 54.8 ± 0.27Effect <strong>of</strong> size/<strong>weight</strong> on oxygenconsumption <strong>of</strong> S. floweri: The rate (Q) and<strong>weight</strong>-specific oxygen consumption (QW -1 ) <strong>of</strong>crabs <strong>of</strong> different <strong>weight</strong> at 30 0 C are shown inTable 3. While the rate <strong>of</strong> oxygen consumptionincreased with increase in <strong>weight</strong> and size <strong>of</strong> thecrabs, the <strong>weight</strong>-specific oxygen consumptiondecreased with <strong>weight</strong> (Table 3). The rate <strong>of</strong>oxygen consumption was strongly and positivelycorrelated with the <strong>weight</strong> <strong>of</strong> the crabs (r =1.01). A negative inverse <strong>relationship</strong> (r = -0.95) between the rate <strong>of</strong> oxygen consumptionand the unit <strong>weight</strong> <strong>of</strong> the crabs was obtained.A regression analysis <strong>of</strong> the <strong>relationship</strong>between the oxygen consumption and the<strong>weight</strong> <strong>of</strong> the crabs gave the following equation: