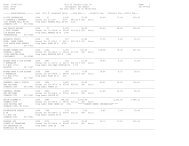
CITY OF JOHNSON CITY, TENNESSEECOMBINING STATEMENT OF NET ASSETSNONMAJOR PROPRIETARY FUNDSJune 30, 2011RegionalTotalGolf Solid Mass Storm water NonmajorCourse Waste Transit Management ProprietaryFund Fund Fund Fund FundsASSETS:Current Assets:Cash on Hand $ 1,000 1,917 2,917Cash Due from Central Depository 2,639,792 145,874 1,046,676 3,832,342Accounts Receivable (Net) 38,155 16,364 96,943 151,462Due from Federal Government 460,326 460,326Due from State Government 155,933 155,933Inventories 88,833 88,833Prepaid Expenses 2,250 2,250Total Current Assets 92,083 2,677,947 780,414 1,143,619 4,694,063Noncurrent Assets:Capital Assets:Land 2,014,580 205,990 1,111,541 3,332,111Buildings 753,613 179,207 2,020,369 305,456 3,258,645Improvements Other than Buildings 868,891 222,145 9,740 1,100,776Equipment and Vehicles 937,267 1,747,514 4,190,916 915,580 7,791,277Less: Accumulated Depreciation (1,969,044) (822,201) (3,156,723) (280,879) (6,228,847)Construction in Progress 146,235 406,300 552,535Net Capital Assets 2,605,307 1,104,520 3,628,932 2,467,738 9,806,497Other Assets:Bond Issue Costs (Net) 9,745 9,745Total Noncurrent Assets 2,615,052 1,104,520 3,628,932 2,467,738 9,816,242Total Assets 2,707,135 3,782,467 4,409,346 3,611,357 14,510,305LIABILITIES:Current Liabilities:Cash Due to Central Depository 2,096,897 2,096,897Accounts Payable 13,985 46,668 98,557 74,463 233,673Accrued Payroll Expenses 31,780 27,335 46,408 19,448 124,971Accrued Expenses 8,759 8,759Deferred Revenue 34,250 750 . 35,000Retainage Payable 7,312 7,312Compensated Absences - Current Portion 24,389 22,922 54,643 10,281 112,235Bonds Payable- Current Portion 210,000 210,000Total Current Liabilities 2,420,060 96,925 207,670 104,192 2,828,847Noncurrent Liabilities:Compensated Absences 6,483 6,093 14,526 2,733 29,835Bonds Payable 945,000 945,000Less: Deferred Debt Refunding (36, l 07) (36, I 07)Special Commission Bonds 11,756 11,756Total Noncurrent Liabilities 915,376 17,849 14,526 2,733 950,484Total Liabilities 3,335,436 114,774 222,196 106,925 3,779,331NET ASSETS:Invested in Capital Assets, Net ofRelated Debt 1,450,307 1,104,520 3,628,932 2,467,738 8,651,497Unrestricted (2,078,608) 2,563,173 558,218 1,036,694 2,079,477Total Net Assets $ (628,301) 3,667,693 4,187,150 3,504,432 10,730,974See Independent Auditors' <strong>Report</strong>.156
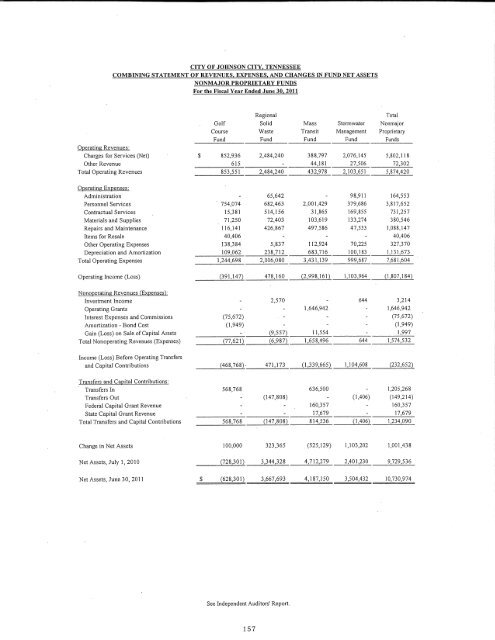
CITY OF JOHNSON CITY, TENNESSEECOMBINING STATEMENT OF REVENUES, EXPENSES, AND CHANGES IN FUND NET ASSETSNONMAJOR PROPRIETARY FUNDSFor the Fiscal Year Ended June 30, 2011RegionalTotalGolf Solid Mass Storm)'>'ater NonmajorCourse Waste Transit Management ProprietaryFund Fund Fund Fund FundsOperating Revenues:Charges for Services (Net) $ 852,9.36 2,484,240 388,797 2,076,145 5,802,118Other Revenue 615 44,181 27,506 72,302Total Operating Revenues 853,551 2,484,240 432,978 2,103,651 5,874,420Operating Expenses:Administration 65,642 98,911 164,553Personnel Services 754,074 682,463 2,001,429 379,686 3,817,652Contractual Services 15,381 514,156 31,865 169,855 731,257Materials and Supplies 71,250 72,403 103,619 133,274 380,546Repairs and Maintenance 116,141 426,867 497,586 47,553 1,088,147Items for Resale 40,406 40,406Other Operating Expenses 138,384 5,837 1f2,924 70,225 327,370Depreciation and Amortization 109,062 238,712 683,716 100,183 1,131,673Total Operating Expenses 1,244,698 2,006,080 3,431,139 999,687 7,681,604Operating Income (Loss) (391,147) 478,160 (2,998, 161) 1,103,964 (1,807, 184)Nonoperating Revenues {Expenses):Investment Income 2,570 644 3,214Operating Grants 1,646,942 1,646,942Interest Expenses and Commissions (75,672) (75,672)Amortization -Bond Cost (I ,949) (1,949)Gain (Loss) on Sale of Capital Assets (9,557) 11,554 1,997Total Nonoperating Revenues (Expenses) (77,621) (6,987) 1,658,496 644 1,574,532Income (Loss) Before Operating Transfersand Capital Contributions (468,768)- 471,173 (1,339,665) 1,104,608 (232,652)Transfers and Capital Contributions:Transfers In 568,768 636,500 1,205,268Transfers Out (147,808) (1 ,406) (149,214)Federal Capital Grant Revenue 160,357 160,357State Capital Grant Revenue 17,679 17,679Total Transfers and Capital Contributions 568,768 (147,808) 814,536 (I ,406) 1,234,090Change in Net Assets 100,000 323,365 (525,129) 1,103,202 1,001,438Net Assets, July I, 2010 (728,301) 3,344,328 4,712,279 2,401,230 9,729,536Net Assets, June 30, 2011 $ (628,301) 3,667,693 4,187,150 3,504,432 I 0,730,974See Independent Auditors' <strong>Report</strong>.157
- Page 1 and 2:
Ciity ofJohnson City,TennesseeCompr
- Page 3 and 4:
CITY OF JOHNSON CITY, TENNESSEEBASI
- Page 5 and 6:
CITY OF JOHNSON CITY, TENNESSEECOMP
- Page 7 and 8:
CITY OF JOHNSON CITY, TENNESSEECOMP
- Page 9 and 10:
Budgeting Controls. In addition, th
- Page 11 and 12:
Certificate ofAchievementfor Excell
- Page 13 and 14:
CITY OF JOHNSON CITY, TENNESSEECITY
- Page 15 and 16:
Honorable Mayor and Board of Commis
- Page 17 and 18:
Both of the government-wide financi
- Page 19 and 20:
City of Johnson City's Net AssetsGo
- Page 21 and 22:
Financial Analysis of the City's Fu
- Page 23 and 24:
Final Amended Budget and Actual Amo
- Page 25 and 26:
Economic Factors and Next Year's Bu
- Page 27 and 28:
CITY OF JOHNSON CITY, TENNESSEESTAT
- Page 29 and 30:
CITY OF JOHNSON CITY, TENNESSEESTAT
- Page 31 and 32:
CITY OF JOHNSON CITY 2 TENNESSEEBAL
- Page 33 and 34:
CITY OF JOHNSON CITY, TENNESSEESTAT
- Page 35 and 36:
CITY OF JOHNSON CITY, TENNESSEERECO
- Page 37 and 38:
CITY OF JOHNSON CITY, TENNESSEESTAT
- Page 39 and 40:
CITY OF JOHNSON CITY, TENNESSEESTAT
- Page 41 and 42:
CITY OF JOHNSON CITY, TENNESSEESTAT
- Page 43 and 44:
CITY OF JOHNSON CITY, TENNESSEESTAT
- Page 45 and 46:
CITY OF JOHNSON CITY, TENNESSEESTAT
- Page 47 and 48:
CITY OF JOHNSON CITY, TENNESSEESTAT
- Page 49 and 50:
CITY OF JOHNSON CITY, TENNESSEESTAT
- Page 51 and 52:
CITY OF JOHNSON CITY, TENNESSEESTAT
- Page 53 and 54:
CITY OF JOHNSON CITY, TENNESSEENOTE
- Page 55 and 56:
CITY OF JOHNSON CITY, TENNESSEENOTE
- Page 57 and 58:
CITY OF JOHNSON CITY, TENNESSEENOTE
- Page 59 and 60:
CITY OF JOHNSON CITY, TENNESSEENOTE
- Page 61 and 62:
CITY OF JOHNSON CITY, TENNESSEENOTE
- Page 63 and 64:
CITY OF JOHNSON CITY, TENNESSEENOTE
- Page 65 and 66:
CITY OF JOHNSON CITY 1 TENNESSEENOT
- Page 67 and 68:
CITY OF JOHNSON CITY, TENNESSEENOTE
- Page 69 and 70:
CITY OF JOHNSON CITY, TENNESSEENOTE
- Page 71 and 72:
CITY OF JOHNSON CITY, TENNESSEENOTE
- Page 73 and 74:
CITY OF JOHNSON CITY, TENNESSEENOTE
- Page 75 and 76:
CITY OF JOHNSON CITY, TENNESSEENOTE
- Page 77 and 78:
CITY OF JOHNSON CITY 2 TENNESSEENOT
- Page 79 and 80:
CITY OF JOHNSON CITY, TENNESSEENOTE
- Page 81 and 82:
CITY OF JOHNSON CITY, TENNESSEENOTE
- Page 83 and 84:
CITY OF JOHNSON CITY, TENNESSEENOTE
- Page 85 and 86:
CITY OF JOHNSON CITY, TENNESSEENOTE
- Page 87 and 88:
CITY OF JOHNSON CITY, TENNESSEENOTE
- Page 89 and 90:
CITY OF JOHNSON CITY, TENNESSEENOTE
- Page 91 and 92:
CITY OF JOHNSON CITY, TENNESSEENOTE
- Page 93 and 94:
CITY OF JOHNSON CITY, TENNESSEENOTE
- Page 95 and 96:
CITY OF JOHNSON CITY, TENNESSEENOTE
- Page 97 and 98:
CITY OF JOHNSON CITY, TENNESSEENOTE
- Page 99 and 100:
CITY OF JOHNSON CITY, TENNESSEENOTE
- Page 101 and 102:
CITY OF JOHNSON CITY, TENNESSEENOTE
- Page 103 and 104:
CITY OF JOHNSON CITY, TENNESSEENOTE
- Page 105 and 106:
CITY OF JOHNSON CITY, TENNESSEENOTE
- Page 107 and 108:
CITY OF JOHNSON CITY, TENNESSEENOTE
- Page 109 and 110:
CITY OF JOHNSON CITY, TENNESSEENOTE
- Page 111 and 112:
CITY OF JOHNSON CITY, TENNESSEENOTE
- Page 113 and 114:
CITY OF JOHNSON CITY, TENNESSEENOTE
- Page 115 and 116:
CITY OF JOHNSON CITY 2 TENNESSEENOT
- Page 117 and 118:
CITY OF JOHNSON CITY, TENNESSEENOTE
- Page 119 and 120:
CITY OF JOHNSON CITY, TENNESSEENOTE
- Page 121 and 122: CITY OF JOHNSON CITY, TENNESSEENOTE
- Page 123 and 124: CITY OF JOHNSON CITY, TENNESSEENOTE
- Page 125 and 126: CITY OF JOHNSON CITY, TENNESSEENOTE
- Page 127 and 128: CITY OF JOHNSON CITY, TENNESSEENOTE
- Page 129 and 130: CITY OF JOHNSON CITY, TENNESSEENOTE
- Page 131 and 132: CITY OF JOHNSON CITY, TENNESSEENOTE
- Page 133 and 134: CITY OF JOHNSON CITY, TENNESSEENOTE
- Page 135 and 136: CITY OF JOHNSON CITY, TENNESSEENOTE
- Page 137 and 138: CITY OF JOHNSON CITY, TENNESSEENOTE
- Page 139 and 140: CITY OF JOHNSON CITY, TENNESSEENOTE
- Page 141 and 142: CITY OF JOHNSON CITY, TENNESSEENOTE
- Page 143 and 144: CITY OF JOHNSON CITY, TENNESSEE·NO
- Page 145 and 146: CITY OF JOHNSON CITY, TENNESSEENOTE
- Page 147 and 148: CITY OF JOHNSON CITY, TENNESSEEREQU
- Page 149 and 150: CITY OF JOHNSON CITY, TENNESSEESCHE
- Page 151 and 152: CITY OF JOHNSON CITY, TENNESSEESCHE
- Page 153 and 154: CITY OF JOHNSON CITY, TENNESSEECOMB
- Page 155 and 156: CITY OF JOHNSON CITY, TENNESSEECOMB
- Page 157 and 158: CITY OF JOHNSON CITY, TENNESSEECOMB
- Page 159 and 160: CITY OF JOHNSON CITY, TENNESSEECOMB
- Page 161 and 162: CITY OF JOHNSON CITY, TENNESSEECOMB
- Page 163 and 164: CITY OF JOHNSON CITY, TENNESSEESCHE
- Page 165 and 166: CITY OF JOHNSON CITY, TENNESSEESCHE
- Page 167 and 168: CITY OF JOHNSON CITY, TENNESSEESCHE
- Page 169 and 170: CITY OF JOHNSON CITY, TENNESSEESCHE
- Page 171: NONMAJOR PROPRIETARY FUNDSProprieta
- Page 175 and 176: CITY OF JOHNSON CITY, TENNESSEECOMB
- Page 177 and 178: CITY OF JO~NSON CITY, TENNESSEECOMB
- Page 179 and 180: CITY OF JOHNSON CITY, TENNESSEECOMB
- Page 181 and 182: CITY OF JOHNSON CITY, TENNESSEECAPI
- Page 183 and 184: I This schedule presents only the c
- Page 185 and 186: CITY OF JOHNSON CITY, TENNESSEESCHE
- Page 187 and 188: CITY OF JOHNSON CITY, TENNESSEESCHE
- Page 189 and 190: CITY OF JOHNSON CITY, TENNESSEESCHE
- Page 191 and 192: CITY OF JOHNSON CITY, TENNESSEESCHE
- Page 193 and 194: CITY OF JOHNSON CITY, TENNESSEESCHE
- Page 195 and 196: STATISTICAL SECTIONThis part of the
- Page 197 and 198: CITY OF JOHNSON CITY, TENNESSEECHAN
- Page 199 and 200: CITY OF JOHNSON CITY, TENNESSEECHAN
- Page 201 and 202: CITY OF JOHNSON CITY, TENNESSEEFUND
- Page 203 and 204: CITY OF JOHNSON CITY, TENNESSEECHAN
- Page 205 and 206: CITY OF JOHNSON CITY, TENNESSEEPROP
- Page 207 and 208: CITY OF JOHNSON CITY, TENNESSEEPROP
- Page 209 and 210: CITY OF JOHNSON CITY, TENNESSEERATI
- Page 211 and 212: CITY OF JOHNSON CITY, TENNESSEELEGA
- Page 213 and 214: CITY OF JOHNSON CITY, TENNESSEEPLED
- Page 215 and 216: CITY OF JOHNSON CITY, TENNESSEEPRIN
- Page 217 and 218: CITY OF JOHNSON CITY, TENNESSEEOPER
- Page 219 and 220: CITY OF JOHNSON CITY, TENNESSEESCHE
- Page 221 and 222: CITY OF JOHNSON CITY~ TENNESSEESCHE
- Page 223 and 224:
CITY OF JOHNSON CITY, TENNESSEEUTIL
- Page 225 and 226:
~ ~~~~-li--~-B~kbur~ Childers&Steag
- Page 227 and 228:
CERTIFIED P uBLIC A ccouNTANTS AND
- Page 229 and 230:
CITY OF JOHNSON CITY, TENNESSEESCHE
- Page 231 and 232:
CITY OF JOHNSON CITY, TENNESSEESCHE