

Deeper_Dive_into_Afterschool
Deeper_Dive_into_Afterschool
Deeper_Dive_into_Afterschool

You also want an ePaper? Increase the reach of your titles
YUMPU automatically turns print PDFs into web optimized ePapers that Google loves.
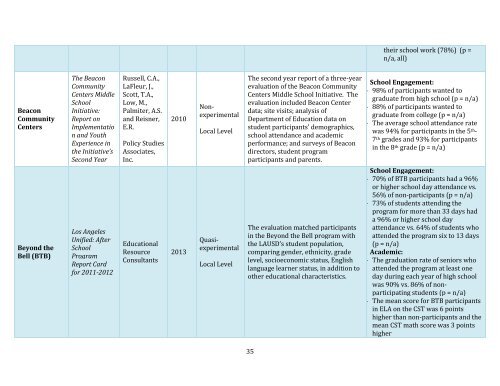
their school work (78%) (p =n/a, all)BeaconCommunityCentersThe BeaconCommunityCenters MiddleSchoolInitiative:Report onImplementation and YouthExperience inthe Initiative’sSecond YearRussell, C.A.,LaFleur, J.,Scott, T.A.,Low, M.,Palmiter, A.S.and Reisner,E.R.Policy StudiesAssociates,Inc.2010NonexperimentalLocal LevelThe second year report of a three-yearevaluation of the Beacon CommunityCenters Middle School Initiative. Theevaluation included Beacon Centerdata; site visits; analysis ofDepartment of Education data onstudent participants’ demographics,school attendance and academicperformance; and surveys of Beacondirectors, student programparticipants and parents.School Engagement:- 98% of participants wanted tograduate from high school (p = n/a)- 88% of participants wanted tograduate from college (p = n/a)- The average school attendance ratewas 94% for participants in the 5 th -7 th grades and 93% for participantsin the 8 th grade (p = n/a)Beyond theBell (BTB)Los AngelesUnified: AfterSchoolProgramReport Cardfor 2011-2012EducationalResourceConsultants2013QuasiexperimentalLocal LevelThe evaluation matched participantsin the Beyond the Bell program withthe LAUSD’s student population,comparing gender, ethnicity, gradelevel, socioeconomic status, Englishlanguage learner status, in addition toother educational characteristics.School Engagement:- 70% of BTB participants had a 96%or higher school day attendance vs.56% of non-participants (p = n/a)- 73% of students attending theprogram for more than 33 days hada 96% or higher school dayattendance vs. 64% of students whoattended the program six to 13 days(p = n/a)Academic:- The graduation rate of seniors whoattended the program at least oneday during each year of high schoolwas 90% vs. 86% of nonparticipatingstudents (p = n/a)- The mean score for BTB participantsin ELA on the CST was 6 pointshigher than non-participants and themean CST math score was 3 pointshigher35