

Top-Down vs. Bottom Up: Working Towards Consensus ... - CASIOPA
Top-Down vs. Bottom Up: Working Towards Consensus ... - CASIOPA
Top-Down vs. Bottom Up: Working Towards Consensus ... - CASIOPA
- No tags were found...

Create successful ePaper yourself
Turn your PDF publications into a flip-book with our unique Google optimized e-Paper software.
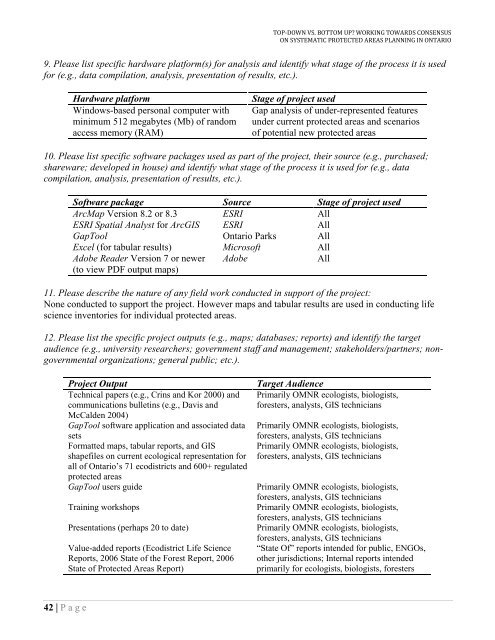
TOP-DOWN VS. BOTTOM UP? WORKING TOWARDS CONSENSUSON SYSTEMATIC PROTECTED AREAS PLANNING IN ONTARIO9. Please list specific hardware platform(s) for analysis and identify what stage of the process it is usedfor (e.g., data compilation, analysis, presentation of results, etc.).Hardware platformWindows-based personal computer withminimum 512 megabytes (Mb) of randomaccess memory (RAM)Stage of project usedGap analysis of under-represented featuresunder current protected areas and scenariosof potential new protected areas10. Please list specific software packages used as part of the project, their source (e.g., purchased;shareware; developed in house) and identify what stage of the process it is used for (e.g., datacompilation, analysis, presentation of results, etc.).Software package Source Stage of project usedArcMap Version 8.2 or 8.3 ESRI AllESRI Spatial Analyst for ArcGIS ESRI AllGapTool Ontario Parks AllExcel (for tabular results) Microsoft AllAdobe Reader Version 7 or newer(to view PDF output maps)AdobeAll11. Please describe the nature of any field work conducted in support of the project:None conducted to support the project. However maps and tabular results are used in conducting lifescience inventories for individual protected areas.12. Please list the specific project outputs (e.g., maps; databases; reports) and identify the targetaudience (e.g., university researchers; government staff and management; stakeholders/partners; nongovernmentalorganizations; general public; etc.).Project OutputTechnical papers (e.g., Crins and Kor 2000) andcommunications bulletins (e.g., Davis andMcCalden 2004)GapTool software application and associated datasetsFormatted maps, tabular reports, and GISshapefiles on current ecological representation forall of Ontario‟s 71 ecodistricts and 600+ regulatedprotected areasGapTool users guideTraining workshopsPresentations (perhaps 20 to date)Value-added reports (Ecodistrict Life ScienceReports, 2006 State of the Forest Report, 2006State of Protected Areas Report)Target AudiencePrimarily OMNR ecologists, biologists,foresters, analysts, GIS techniciansPrimarily OMNR ecologists, biologists,foresters, analysts, GIS techniciansPrimarily OMNR ecologists, biologists,foresters, analysts, GIS techniciansPrimarily OMNR ecologists, biologists,foresters, analysts, GIS techniciansPrimarily OMNR ecologists, biologists,foresters, analysts, GIS techniciansPrimarily OMNR ecologists, biologists,foresters, analysts, GIS technicians“State Of” reports intended for public, ENGOs,other jurisdictions; Internal reports intendedprimarily for ecologists, biologists, foresters42 | P a g e