Commuter Rail Extension Alternatives Analysis - Transportation ...
Commuter Rail Extension Alternatives Analysis - Transportation ...
Commuter Rail Extension Alternatives Analysis - Transportation ...

Create successful ePaper yourself
Turn your PDF publications into a flip-book with our unique Google optimized e-Paper software.
DRAFTCALTRAIN EXTENSIONTO MONTEREY COUNTY<strong>Alternatives</strong> <strong>Analysis</strong>Prepared forbyParsonsSeptember 2006Revised April 2007DRAFT
DRAFTDRAFT
CALTRAIN EXTENSION TO MONTEREY COUNTYALTERNATIVES ANALYSISCONTENTSChapterPageEXECUTIVE SUMMARYES-11 INTRODUCTION 1Overview of Monterey County Fixed Guideway Study 1U.S. 101 Corridor Element 1Monterey Peninsula Corridor Element 3The Alternative <strong>Analysis</strong> Process 6Study Initiation 6Development of Initial <strong>Alternatives</strong> 9Screening of Initial <strong>Alternatives</strong> 10<strong>Analysis</strong> Refinement and Evaluation of the <strong>Alternatives</strong> 15Selection of the Locally Preferred Alternative 152 EXISTING AND FORECAST CONDITIONS 17Regional Overview 17Monterey Bay Area Overview 17U.S. 101 21Existing U.S. 101 Conditions and Traffic Volumes 22Traffic Projections 23Commuting Trends 27Santa Clara County Traffic Conditions 27Regional <strong>Rail</strong> 30Caltrain Service 30Altamont <strong>Commuter</strong> Express 42parsons CONTENTS iii
CALTRAIN EXTENSION TO MONTEREY COUNTYALTERNATIVES ANALYSISCONTENTS (continued)ChapterPage3 DETAILED DEFINITION OF ALTERNATIVES 47Definition of the No Build Alternative 47U.S. 101 Safety and Operational Improvements—the Prunedale Improvement Project 49U.S. 101 Capacity Improvements—the U.S. 101 Prunedale Freeway 49State Route 156 Widening 50MST Public <strong>Transportation</strong> Plans 51Caltrain <strong>Commuter</strong> <strong>Rail</strong> Service 52Definition of the Caltrain <strong>Extension</strong> Alternative 52Institutional Framework 52Proposed <strong>Extension</strong> of Caltrain Service to Salinas 55Physical Station, Yard and Track Components of theCaltrain <strong>Extension</strong> Alternative 64Definition of the Express Bus Alternative—Express Bus Service toSan Francisco Peninsula 76Fixed Guideway Investment 76Service/Stations/Stops 76Operations 77Vehicle Requirements 78Fares and Revenues 78Physical Facilities of the Express Bus Alternative 78<strong>Alternatives</strong> Considered, but Rejected 87Shuttle Bus Service to Gilroy 87Limited Stop Bus Service to San Jose 87Shuttle Train Service to Gilroy 89Independent Train Service to San Francisco 89Bus Rapid Transit Service 924 TRAVEL DEMAND FORECASTS 95Introduction 95Demographic Data 96<strong>Commuter</strong> Data 98Caltrain <strong>Extension</strong> Ridership Forecast 105Summary of Ridership Forecasts 112parsons CONTENTS iv
CALTRAIN EXTENSION TO MONTEREY COUNTYALTERNATIVES ANALYSISCONTENTS (continued)ChapterPage5 ENVIRONMENTAL ANALYSIS 115Transit Vehicle Operating Environments 117Gilroy to Pajaro 117Pajaro to Castroville 120Castroville to Salinas 120Transit Station Environments 121Pajaro Station/Park-and-Ride Site (Watsonville Junction) 121Castroville Station/Park-and-Ride Site 123Salinas Intermodal <strong>Transportation</strong> Center and Caltrain Layover Facility 125Marina/CSUMB MST Transit Center and Park-and-Ride 127Frank J. Lichtanski Monterey Bay Operations Center Expansion 128Environmental Justice 132Racial and Ethnic Populations 132Income Levels 1326 ESTIMATION OF CAPITAL, OPERATING AND MAINTENANCECOSTS, AND REVENUE 145Caltrain <strong>Extension</strong> Alternative Capital Cost Estimates 145Express Bus Alternative Capital Costs 149Caltrain <strong>Extension</strong> Alternative Operating and Maintenance Cost Estimates 153Operating Plan for Caltrain <strong>Extension</strong> Alternative 153Operating and Maintenance Cost Estimates for Caltrain<strong>Extension</strong> Alternative 156Express Bus Alternative Operating and Maintenance Cost Estimates 157Passenger Revenues 162parsons CONTENTS v
CALTRAIN EXTENSION TO MONTEREY COUNTYALTERNATIVES ANALYSISCONTENTS (continued)ChapterPage7 FINDINGS FROM PUBLIC AND STAKEHOLDER WORKSHOPSON ALTERNATIVES 167Pajaro Community 167Castroville Community 168Salinas Property Owners Meeting 169Salinas Community Meeting 169Monterey Peninsula Communities 169Service 170Alignment 170Equipment 170Stations 170Other Public Information Mechanisms 171Consultations 175Summary of Public and Stakeholder Input 1758 EVALUATION OF ALTERNATIVES 177Economic Performance of the Caltrain <strong>Extension</strong> and Express Bus <strong>Alternatives</strong> 177Travel Time Savings 177Vehicle Operating Costs 183Transit User Fees 183Crash Benefits 185Transit Accidents 188Environmental Costs 189Net Operating Costs 195Summary of Benefits 196Life-Cycle Benefits and Costs 196Social Performance of the Caltrain <strong>Extension</strong> and Express Bus <strong>Alternatives</strong> 199Daily Transit Riders 199Cost per Rider 200Farebox Recovery 201Population Served 202Racial and Ethnic Population Served 202Income Levels of Population Served 204Growth Inducement/Economic Development Potential 210Funding Availability 211Selection of the Locally Preferred Alternative 213parsons CONTENTS vi
CALTRAIN EXTENSION TO MONTEREY COUNTYALTERNATIVES ANALYSISCONTENTS (continued)ChapterPage9 SUMMARY 217Purpose and Need 217<strong>Alternatives</strong> <strong>Analysis</strong> Study Process 219Evaluation of Conceptual <strong>Alternatives</strong> 219Detailed Definition of <strong>Alternatives</strong> 221Caltrain <strong>Extension</strong> Alternative 221Express Bus Alternative 222Detailed Evaluation of <strong>Alternatives</strong> 224Frequently Asked Questions 225Selection of the Locally Preferred Alternative 229Partnerships and Collaboration 22910 APPENDICESA. CALTRAIN BASELINE (NO BUILD) SOUTH TERMINAL IMPROVEMENTSB. STATION PROGRAM REQUIREMENTSC. CALTRAIN EXTENSION RIDERSHIP ESTIMATESD. CALTRAIN EXTENSION TO SALINAS OPERATING ENVIRONMENTE. DETAILED COST ESTIMATES AND FTA WORKSHEETSparsons CONTENTS vii
CALTRAIN EXTENSION TO MONTEREY COUNTYALTERNATIVES ANALYSISFIGURESFigurePage1-1 Monterey County Fixed Guideway Travel Markets 21-2 Caltrain <strong>Extension</strong> to Monterey County Project Study Area 41-3 <strong>Alternatives</strong> Evaluation Process 71-4 Evaluation Criteria and Measures 81-5 Conceptual <strong>Alternatives</strong> 111-6 Qualitative Evaluation of Conceptual <strong>Alternatives</strong> 131-7 <strong>Alternatives</strong> Evaluation Process 162-1 Existing Traffic Volumes on U.S. 101 232-2 Projected Traffic Volumes on U.S. 101 (2020) 252-3 Traffic Count Trend Data Locations 282-4 AM Peak Period Traffic Year-by-Year Trends 292-5 2005 Freeway Level of Service in the AM Peak Period 312-6 2005 Freeway Level of Service in the PM Peak Period 322-7 2005 Freeway Level of Service F in the AM and PM Peak Periods 332-8 Origin–Destination Pair (Morgan Hill to Santa Clara) 342-9 Existing and Proposed Regional Passenger <strong>Rail</strong> Network 352-10 Caltrain Weekday Passenger Boardings for South Santa Clara County 382-11 Population Growth (1980–2025) 402-12 Employed Resident Growth (1980–2025) 402-13 Comparison of Growth in Employed Residents versus Jobs, 2025 412-14 Caltrain Ridership Demand through 2025 422-15 Altamont <strong>Commuter</strong> Express Average Daily Ridership Trends 443-1 U.S. 101 Prunedale Improvement Project 50parsons CONTENTS viii
CALTRAIN EXTENSION TO MONTEREY COUNTYALTERNATIVES ANALYSISFIGURES (continued)FigurePage3-2 Pajaro Valley Station Overall Site and Track Plan 673-3 Pajaro Valley Station Site Parking Lot Plan 683-4 Caltrain <strong>Extension</strong> Alternative Castroville Station Site Plan 693-5 Caltrain <strong>Extension</strong> Alternative Salinas Intermodal <strong>Transportation</strong>Center Expansion Option 18B 713-6 Caltrain <strong>Extension</strong> Alternative Salinas Layover Facility and Surface Parking 733-7 Caltrain <strong>Extension</strong> Alternative Gilroy Yard Necessary Improvements 743-8 Location of Express Bus Alternative Park-and-Ride Facilities 773-9 Express Bus Alternative Pajaro Valley Park-and-Ride 803-10 Express Bus Alternative Castroville Park-and-Ride 823-11 Express Bus Alternative Salinas Intermodal <strong>Transportation</strong> CenterExpansion Option 17 833-12 Express Bus Alternative Salinas Intermodal <strong>Transportation</strong> CenterExpansion Parking Structure Floor Plans 843-13 Express Bus Alternative Marina/CSUMB Monterey–Salinas Transit Center 864-1 Monterey County Station Locations and Access Buffers 974-2 Santa Clara County Station Locations and Access Buffers—North County 994-3 Santa Clara County Station Locations and Access Buffers—South County 1014-4 Altamont <strong>Commuter</strong> Express <strong>Rail</strong> Network 1074-5 Santa Clara County Altamont <strong>Commuter</strong> Express Station Locationsand Access Buffers 1135-1 Fixed Guideway/Roadways with Locations of Transit Stations 1185-2 Pajaro Site Location 1225-3 Castroville Site Location 1245-4 Salinas Site Location 126parsons CONTENTS ix
CALTRAIN EXTENSION TO MONTEREY COUNTYALTERNATIVES ANALYSISFIGURES (continued)FigurePage5-5 Salinas Amtrak Station 1305-6 Salinas Historic Freight Depot 1315-7 Salinas Historic Caboose 1335-8 Marina/CSUMB Site Location 1355-9 Marina/CSUMB Monterey–Salinas Transit Center and Park-and-RideFacility Site Map and Photographic Views 1305-10 Frank J. Lichtanski Monterey Bay Operations Center Site Location 1315-11 Monterey Bay Area Population and Race 1335-12 Monterey Bay Area Population by Poverty Level 1356-1 Caltrain Map and Fare Zones 1638-1 Travel Time Utilization—Method 1 1808-2 Annual Operating and Maintenance Expense ($ 2007) versusWeekday Ridership Levels 2018-3 Monterey County Station Locations and Access Buffers 2038-4 Monterey Bay Area Population and Race 2058-5 Monterey Bay Area Population by Poverty Level 2078-6 Santa Clara County Station Locations and Access Buffers—North County 2088-7 Santa Clara County Station Locations and Access Buffers—South County 2099-1 Caltrain <strong>Extension</strong> to Monterey County Project Study Area 2189-2 Locally Preferred Alternative Selection Process 2199-3 Preliminary <strong>Alternatives</strong> 220parsons CONTENTS x
CALTRAIN EXTENSION TO MONTEREY COUNTYALTERNATIVES ANALYSISTABLESTablePage1-1 Preliminary Capital Cost Estimates 122-1 Fourth Quarter Median House Prices 182-2 Percent of San Francisco Bay Area Residents Qualifying forHome Ownership (June 2004) 182-3 Monterey County and Santa Cruz County Commuting Trends (1990 and 2000) 192-4 Level of Service Criteria for Freeway Basic Segments 292-5 Origin–Destination Pair Travel Times (minutes of travel fromMorgan Hill to Santa Clara), 1997–2005 plus 2030 342-6 Caltrain Weekday Passenger Boardings 372-7 Altamont <strong>Commuter</strong> Express Rider Boarding Patterns 453-1 Description of Monterey County Fixed Guideway Study <strong>Alternatives</strong>Shortlisted for Detailed Definition and Evaluation 483-2 Caltrain Public Timetable 583-3 At-Grade Public Crossing Locations 603-4 Coast Line Existing and Expanded Freight Service (San Jose to Salinas) 613-5 Express Bus Alternative Service Matrix and Frequency of Service(Headway Minutes) 783-6 Monterey–Salinas Transit Lines 25 and 26: Caltrain Fastrack BoardingStatistics (January–February 2005) 883-7 Capital Costs of Independent Train Service to San Francisco Alternativeversus Caltrain <strong>Extension</strong> ($1,000 FY 2007) 913-8 Operating and Maintenance Costs of Independent Train Service toSan Francisco Alternative versus Caltrain <strong>Extension</strong> ($ FY 2007) 913-9 Capital Costs of Bus Rapid Transit Service to San Jose versusExpress Bus Alternative ($1,000 FY 2007) 933-10 Operating and Maintenance Costs of Bus Rapid Transit Service toSan Jose versus Express Bus Alternative ($ FY 2007) 93parsons CONTENTS xi
CALTRAIN EXTENSION TO MONTEREY COUNTYALTERNATIVES ANALYSISTABLES (continued)TablePage4-1 Socio-Economic Data with Buffer Information around Stations 984-2 <strong>Commuter</strong> <strong>Rail</strong> Access to Employment in Santa Clara County 1034-3 Monterey County Commuting Trends (1990 and 2000) 1034-4 Monterey County <strong>Commuter</strong> Forecasts 1044-5 Home to Work Commute (Time Leaving Home) 1054-6 Year 2000 <strong>Commuter</strong> <strong>Rail</strong> Corridor Assessment 1084-7 Transit Patronage Based on Trip Distance 1094-8 Trip Distance and Travel Times from Monterey County 1104-9 Year 2000 <strong>Commuter</strong>s to Caltrain Markets 1104-10 Calculation of Potential <strong>Rail</strong> Ridership (VTA Method) 1104-11 Caltrain <strong>Extension</strong> Ridership Estimates by Station (VTA Method) 1114-12 Altamont <strong>Commuter</strong> Express Ridership from San Joaquin Countyto Santa Clara County—2000 Survey 1114-13 Year 2000 <strong>Commuter</strong>s to Caltrain Markets 1114-14 Year 2000 <strong>Commuter</strong>s from San Joaquin County Served byAltamont <strong>Commuter</strong> Express Stations in Santa Clara County 1124-15 Future Ridership Forecasts from Monterey County 1145-1 Summary of Impacts and Mitigation Measures 1366-1 Caltrain <strong>Extension</strong> Alternative Capital Cost Estimate ($1,000 FY 2007) 1466-2 Main Worksheet—Build Alternative 1476-3 Annualized Cost—Build Alternative 1486-4 Express Bus Alternative Capital Cost Estimate ($1,000 FY 2007) 1496-5 TSM Alternative 1516-6 TSM Alternative Annualized Cost 152parsons CONTENTS xii
CALTRAIN EXTENSION TO MONTEREY COUNTYALTERNATIVES ANALYSISTABLES (continued)TablePage6-7 <strong>Commuter</strong> Service between Salinas and Mountain View—Depart Times 1546-8 Caltrain Public Timetable 1556-9 Peninsula Corridor Joint Powers Board Expense Budget (FY 2001–2007) 1566-10 Caltrain <strong>Extension</strong> Alternative Operating and Maintenance Cost ($ FY 2007) 1576-11 Monterey–Salinas Transit Fixed Route Bus Operating andMaintenance Cost Parameters 1586-12 Monterey–Salinas Transit Fixed Route Bus Operating Expense Recap 1596-13 Allocation of Monterey–Salinas Transit FY 2005–FY 2007 OperatingCosts to Cost Drivers 1606-14 Express Bus Alternative Operating Parameters 1616-15 Express Bus Alternative Operating and Maintenance Cost 1626-16 Proposed Fares and Zones ($ 2006) 1646-17 Maximum Caltrain Zone Ride Distance (Miles) 1646-18 Passenger Revenue (Eight-Zone Fare Structure—$ 2006) 1658-1 Existing and Estimated Travel Times 1778-2 Station Mode of Arrival/Egress Assumptions 1788-3 Total Travel Times (minutes) for Auto/Caltrain/Express Bus Journeys 1798-4 Travel Time Savings (minutes per one-way trip)—Method 1 1808-5 Travel Time Savings (minutes per one-way trip)—Method 3 1818-6 Selected Wage Rates (2004 unless noted) 1818-7 Annual Passengers—Caltrain <strong>Extension</strong> to Salinas 1818-8 User Time Benefits—Method 1 1828-9 User Time Benefits—Method 3 1828-10 2010 and 2030 Annual Passengers, Passenger Miles, andVehicle Equivalents—Caltrain <strong>Extension</strong> to Salinas 184parsons CONTENTS xiii
CALTRAIN EXTENSION TO MONTEREY COUNTYALTERNATIVES ANALYSISTABLES (continued)TablePage8-11 Fuel Consumption Rates (gallons/mile) 1858-12 Vehicle Operating Cost Savings 1858-13 California Crash Rates on State Highways (2004) 1858-14 Accident Cost Estimates 1878-15 Accident Cost Assumptions for TAMC ($ 2006) 1878-16 Crash Avoidance Benefits of Caltrain <strong>Extension</strong> and Express Bus <strong>Alternatives</strong> 1878-17 Default Fatality, Injury and Accident Rates per Million Vehicle-Miles 1888-18 Fatality, Injury and Property Damage Costs for Transit Accidents 1888-19 Transit Accident Disbenefits of Caltrain <strong>Extension</strong> and Express Bus <strong>Alternatives</strong> 1898-20 Emissions from Train Operation 1918-21 Emissions from Express Bus Operation 1918-22 Estimated Mode of Arrival by Station 1928-23 Emissions from Auto Access <strong>Commuter</strong> Vehicles (2010) 1928-24 Emissions from Auto Access <strong>Commuter</strong> Vehicles (2030) 1938-25 Emissions Reduction (Credit) from <strong>Commuter</strong> Vehicles 1938-26 Net Change of Operational Emissions Associated withCaltrain <strong>Extension</strong> Alternative (tons/year) 1948-27 Net Change of Operational Emissions Associated withExpress Bus Alternative (tons/year) 1948-28 Health Cost of Motor Vehicle Emissions ($/ton) 1958-29 Health Cost of Caltrain <strong>Extension</strong> and Express Bus <strong>Alternatives</strong> 1958-30 Net Operating Costs 1958-31 Summary of Caltrain <strong>Extension</strong> and Express Bus Alternative Benefits 1968-32 Life-Cycle Benefits and Costs of Caltrain <strong>Extension</strong> Alternative 1978-33 Life-Cycle Benefits and Costs of Express Bus Alternative 198parsons CONTENTS xiv
CALTRAIN EXTENSION TO MONTEREY COUNTYALTERNATIVES ANALYSISTABLES (continued)TablePage8-34 Summary of Benefit Cost <strong>Analysis</strong> Results 1988-35 2010 and 2030 Annual Passengers and Annual Passenger Miles 1998-36 Daily Caltrain <strong>Extension</strong> Transit Rider Equivalents Based on Trip Length (2004) 2008-37 Capital and Operating Costs per Rider and per Passenger Mile 2008-38 Socio-Economic Data with Buffer Information around Stations 2048-39 <strong>Commuter</strong> <strong>Rail</strong> Access to Employment in Santa Clara County 2108-40 Proposed Capital Budget for Caltrain <strong>Extension</strong> to Monterey County Project 2128-41 Regional <strong>Transportation</strong> Program Constrained Projects List 2139-1 Caltrain <strong>Extension</strong> Alternative Capital Cost Estimate ($1,000 FY 2007) 2229-2 Express Bus Alternative Capital Cost Estimate ($1,000 FY 2007) 2239-3 Summary of Caltrain <strong>Extension</strong> and Express Bus Alternative Benefits 2249-4 Summary of Benefit Cost <strong>Analysis</strong> Results 2259-5 Daily Caltrain <strong>Extension</strong> Transit Rider Equivalents Based on Trip Length (2004) 2269-6 Capital and Operating Costs per Rider and per Passenger Mile 2269-7 Caltrain <strong>Extension</strong> to Monterey County Capital Budget—Funding Element(year of expenditure dollars) 228parsons CONTENTS xv
CALTRAIN EXTENSION TO MONTEREY COUNTYALTERNATIVES ANALYSISABBREVIATIONS/ACRONYMSAADTACEAMBAGBRTCal-B/CCaltransCEQACMAQCOCSUMBDMUEA/EIREIREISEPAF&EFHWAFYFORAFRAFTAFYGDPaverage annual daily trafficAltamont <strong>Commuter</strong> ExpressAssociation of Monterey Bay Area Governmentsbus rapid transitCalifornia Life-Cycle Benefit/Cost <strong>Analysis</strong> ModelCalifornia Department of <strong>Transportation</strong>California Environmental Quality ActCongestion Mitigation and Air Quality Improvementcarbon monoxideCalifornia State University–Monterey Baydiesel multiple unit trainEnvironmental Assessment/Environmental Impact ReportEnvironmental Impact ReportEnvironmental Impact StatementEnvironmental Protection Agencyfreeway and expressway systemFederal Highway Administrationfiscal yearFort Ord Reuse AuthorityFederal <strong>Rail</strong>road AdministrationFederal Transit Administrationfiscal yeargross domestic productHCM Highway Capacity Manual 2000parsons CONTENTS xvi
CALTRAIN EXTENSION TO MONTEREY COUNTYALTERNATIVES ANALYSISABBREVIATIONS/ACRONYMS (continued)HOVRRSITCITSPJPBLOSLPALRTMISMOSMOUMPmphMSTMTCNEPANHSNO XO&MO–DPDOPDTPMPM 10high-occupancy vehicleInterregional Road SystemIntermodal <strong>Transportation</strong> CenterInterregional <strong>Transportation</strong> Strategic PlanPeninsula Corridor Joint Powers Boardlevel of servicelocally preferred alternativelight rail transitmajor investment studyminimum operating segmentmemorandum of understandingmilepostmiles per hourMonterey–Salinas TransitMetropolitan <strong>Transportation</strong> CommissionNational Environmental Policy ActNational Highway Systemnitrogen oxidesoperating and maintenance costorigin-destinationproperty damage onlyproject development teamparticulate matterparticulate matter up to 10 microns in sizeparsons CONTENTS xvii
CALTRAIN EXTENSION TO MONTEREY COUNTYALTERNATIVES ANALYSISABBREVIATIONS/ACRONYMS (continued)PSRPTARDARPCRSTPIRTPSamTransSCSSHELLSO XSRSTAASTEAM 2.0STIPSTRAHNETSVRTCTAMCTAZTCRPTEA-21TSMUPRRVMTVOCVTAproject study reportPublic <strong>Transportation</strong> AccountRedevelopment Agency<strong>Rail</strong> Policy CommitteeRegional Surface <strong>Transportation</strong> Program–InterestRegional <strong>Transportation</strong> PlanSan Mateo County TransitSchiermeyer Consulting ServicesState Highway Extra Legal Load Routesulfur oxidesState RouteSurface <strong>Transportation</strong> Assistance ActSurface <strong>Transportation</strong> Efficiency <strong>Analysis</strong> ModuleState <strong>Transportation</strong> Improvement ProgramStrategic Highway Corridor NetworkSilicon Valley Rapid Transit Corridor<strong>Transportation</strong> Agency for Monterey Countytransportation analysis zoneTraffic Congestion Relief Program<strong>Transportation</strong> Equity Act for the 21st Centurytransportation system managementUnion Pacific <strong>Rail</strong>roadvehicle miles traveledvolatile organic compoundsSanta Clara Valley <strong>Transportation</strong> Authorityparsons CONTENTS xviii
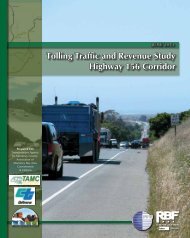
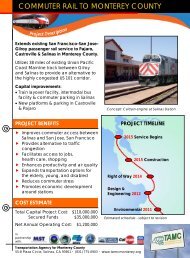
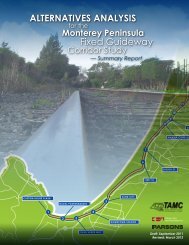
CALTRAIN EXTENSION TO MONTEREY COUNTYALTERNATIVES ANALYSISEXECUTIVE SUMMARYAn <strong>Alternatives</strong> <strong>Analysis</strong> study evaluates appropriate modal and alignment options for addressingmobility options in a given corridor. The study provides information to local officials on the benefits,costs, and impacts of alternative transportation investments developed to address the purpose andneed for an improvement in a corridor. An <strong>Alternatives</strong> <strong>Analysis</strong> study is required for a project toqualify for federal Section 5309 New Starts capital funding. The study is complete when a locallypreferred alternative (LPA) is selected by local and regional decision makers.PURPOSE AND NEED FOR TRANSPORTATION INVESTMENTThe U.S. 101 Corridor is heavily congested in the San Francisco Bay Area and portions of MontereyCounty. Caltrain commuter rail service currently extends from San Francisco in the north to Gilroy inthe south. The proposed Caltrain <strong>Extension</strong> to Monterey County project would extend Caltrain from itsexisting terminus in Gilroy to Monterey County, including stations in Pajaro (Watsonville Junction),Castroville, and Salinas. Figure 1 illustrates the project area and the existing and proposed stationlocations.The proposed extension of Caltrain to Salinas would provide an alternative means of travel betweenMonterey County and Santa Clara, San Mateo, and San Francisco counties, significantly reducingcongestion on U.S. 101 and improving regional air quality. The proposed rail service is also a costeffective alternative to widening U.S. 101.In addition to lowering congestion on the roadways, the commuter rail extension would bring a significantincrease in ridership to the existing Caltrain and connecting Capitol Corridor services. Otherbenefits include increased access to job opportunities, more transportation alternatives for seniorcitizens and those with physical disabilities, and increased access to educational and health careresources in the San Francisco Bay Area.Currently, job distribution and worker housing distribution patterns do not match in the MontereyCounty and San Francisco Bay Areas. The northern counties of San Francisco and Santa Clara havelarge job surpluses, requiring approximately 117,000 non-San Francisco Bay Area residents to fill theavailable positions as of 2000 (Metropolitan <strong>Transportation</strong> Commission). This pull of workersgenerates a large volume of inter-regional commuter traffic, adding to highway congestion and airquality impacts.The U.S. Census for 2000 estimated that 18,073 persons living in Monterey County work in anothercounty. Of this number, more than 30 percent are employed in Santa Clara County or other SanFrancisco Bay Area counties. Available public transportation between Monterey County and SantaClara County is limited to three northbound bus trips during the AM commute period and two southboundbus trips during the afternoon commute period. These buses are subject to traffic delays onU.S. 101 and SR 156parsons EXECUTIVE SUMMARY ES-1
CALTRAIN EXTENSION TO MONTEREY COUNTYALTERNATIVES ANALYSISFigure 1Caltrain <strong>Extension</strong> to Monterey County Project Study Areaparsons EXECUTIVE SUMMARY ES-2
CALTRAIN EXTENSION TO MONTEREY COUNTYALTERNATIVES ANALYSISALTERNATIVES ANALYSIS STUDY PROCESSThe proposed project is the outgrowth of a detailed analysis of alternatives conducted over a fiveyearperiod (2002–2007). The process followed by the alternatives analysis is consistent with guidanceprovided by the Federal Transit Administration (see Figure 2). This study identifies unmet intracountytravel needs in Monterey County and inter-county travel needs between Monterey County andsouthern Santa Cruz County and the San Francisco Bay Area. To address these travel markets, eightalternatives were identified, as depicted in Figure 3. These alternatives were conceptually definedinsofar as fixed guideway alignments, station locations, service characteristics and capital costs.Figure 2Locally Preferred Alternative Selection ProcessUniverse of <strong>Alternatives</strong>Initial ScreeningConceptual <strong>Alternatives</strong>Secondary EvaluationDetailed <strong>Analysis</strong>Detailed <strong>Alternatives</strong>FinalAlternative (locally preferredalternative)Figure 3Conceptual <strong>Alternatives</strong>ALTERNATIVE0 No Build <strong>Rail</strong> Service: Existing transit services and limited road improvements.1 Caltrain to Salinas <strong>Rail</strong> Service: Extend four commuter rail roundtrips from Gilroy to Salinas.2345678Monterey Peninsula to San Francisco Intercity <strong>Rail</strong> Service: Operate intercity train service between theMonterey Peninsula and San Francisco 2 or 3 roundtrips per day.Monterey Peninsula to San Francisco Intercity <strong>Rail</strong> Service Plus Caltrain to Salinas and MontereyPeninsula: Operate intercity train service between the Monterey Peninsula and San Francisco plus extendtwo Caltrain roundtrips from Gilroy to Salinas, and two roundtrips from Gilroy to the north side of Marina.Passenger <strong>Rail</strong> Shuttle to Castroville Caltrain Service: Extend four Caltrain commuter rail roundtrips fromGilroy to Salinas. Operate connecting shuttle service between Seaside and Castroville to meet Caltrainservice extension.Local Peninsula <strong>Rail</strong> or Bus Rapid Transit (BRT) Service: Construct light rail transit (LRT) or BRTguideway between Monterey and Marina, or extend LRT to Castroville. Potential intercity rail from Marina toSan Francisco under sub-option 5D. Includes Caltrain extension to Salinas.Salinas to Monterey Local <strong>Rail</strong> or BRT Service: Construct LRT or BRT guideway between Monterey andMarina. Extend LRT guideway to Castroville via MBL and Salinas along Coast Mainline. Alternately, extendBRT guideway to Salinas via Blanco or Davis roads. Includes Caltrain extension to Salinas.Monterey Peninsula to San Francisco Intercity Plus Salinas to Monterey Local <strong>Rail</strong> Service: ConstructLRT between Monterey, Castroville and Salinas. Operate intercity rail service from Monterey to SanFrancisco. Use FRA-compliant DMU for both services. Includes Caltrain extension to Salinas.Monterey County to San Francisco Peninsula Express Bus Service: Low cost transit investments tomatch locally preferred build alternative. Includes major roadway construction to provide capacity/reducecongestion.parsons EXECUTIVE SUMMARY ES-3
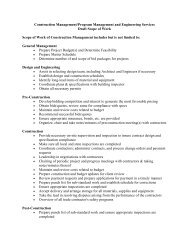
CALTRAIN EXTENSION TO MONTEREY COUNTYALTERNATIVES ANALYSISDETAILED DEFINITION OF ALTERNATIVESFollowing the shortlisting of conceptual alternatives for further refinement and evaluation, the <strong>Alternatives</strong><strong>Analysis</strong> Study was divided into two projects; one to serve intra-county needs and one to serveinter-county (Monterey to San Francisco Bay Area) needs. This <strong>Alternatives</strong> <strong>Analysis</strong> documentaddresses the inter-county commute market alternatives.Two alternatives were defined to address the inter-county travel market: the Caltrain <strong>Extension</strong> toSalinas Alternative (Build Alternative) and the Express Bus Alternative (<strong>Transportation</strong> System Management(TSM) Alternative).In addition to the Caltrain <strong>Extension</strong> Alternative and the Express Bus Alternative, five additionalalternatives were considered, but rejected for the U.S. 101 Corridor. These included:• Shuttle bus service to Gilroy• Limited stop bus service to San Jose• Shuttle train service to Gilroy• Independent train service to San Francisco• Bus rapid transit serviceThese alternatives were rejected as not being sufficiently attractive to capture ridership or not beingcost effective.Caltrain <strong>Extension</strong> AlternativeThe proposed project consists of four elements: commuter rail station construction at the communitiesof Pajaro and Castroville; renovations/expansions of an existing passenger rail station and constructionof a new parking facility at Salinas; and construction of a commuter rail layover facility at Salinas.Improvements to the Union Pacific <strong>Rail</strong>road (UPRR) Coast main line between Gilroy and Salinas andinstitutional arrangements required for construction and operation of commuter rail service betweenGilroy and Salinas are also part of the Caltrain <strong>Extension</strong> Alternative.Under the Caltrain <strong>Extension</strong> Alternative, existing Caltrain service to Gilroy would be extended toSalinas. Initially, two round trip trains would be operated on weekdays. As ridership warrants, servicewould be expanded to three round trips. As Caltrain service is restored to Gilroy (four round trips) andeventually expanded, service would be extended to Salinas as demand warrants. Trainsets would layover in Salinas in lieu of Gilroy. A Salinas layover yard would be constructed with capacity for fourtrainsets, but would be designed to expand to accommodate six trainsets.Weekday boardings at Monterey County stations (AM northbound) are forecast at 1,028 riders per day,based on Year 2000 commuting patterns. In the afternoon, an equal number of riders would board atSan Francisco Bay Area stations and ride south to Monterey County. These commuting patternsappear to hold true as of 2005/2006, and are assumed for 2010 opening year conditions. Year 2030boardings are forecast as 2,056 riders per day traveling in each direction (4,112 passenger trips).The physical components of the Caltrain <strong>Extension</strong> Alternative are described and detailed in theCaltrain <strong>Extension</strong> to Monterey County Project Study Report, dated February 21, 2006. The projectstudy report is a “Project Initiation Document” which provides sufficient project detail and cost estimatesparsons EXECUTIVE SUMMARY ES-4
CALTRAIN EXTENSION TO MONTEREY COUNTYALTERNATIVES ANALYSISto allow a project to be included in the State <strong>Transportation</strong> Improvement Program at the discretion ofthe California <strong>Transportation</strong> Commission. The Caltrain <strong>Extension</strong> to Monterey County ProjectStudy Report is included with this <strong>Alternatives</strong> <strong>Analysis</strong> by reference as the physical definitionof the Build Alternative. See Table 1 for the Caltrain <strong>Extension</strong> Alternative capital cost estimatesexpressed in FY 2007 and year of expenditure (YOE) dollars.Table 1 identifies a cost allowance of $8.8 million for vehicles. This rolling stock is not required toaccommodate peak passenger loads, and is included as a risk element for comparison with theExpress Bus Alternative. This potential cost is not reflected in the year of expenditure funding plan.Express Bus AlternativeThe Express Bus Alternative entails express bus service from Salinas to the San Francisco Bay Area.This alternative would attempt to provide equivalent travel time savings, comfort and convenience fortransit users as compared to the Caltrain <strong>Extension</strong> Alternative. Monterey–Salinas Transit expressbus service would be established as part of this alternative and would operate from four MontereyCounty Transit Centers to Santa Clara, San Mateo, and San Francisco counties. An MST TransitCenter/Park-n-Ride facility would be constructed at Eighth Street in Marina as part of the UniversityVillages redevelopment of Fort Ord. Additional transit centers with park-and-ride facilities would be locatedin Salinas, Castroville, and Pajaro with express bus service operating via existing surface roadsto Santa Clara and San Mateo counties, including non-stop service to select stations.Table 1Caltrain <strong>Extension</strong> Alternative Capital Cost Estimate ($1,000 FY 2007)Work DescriptionUPRRMainLineGilroyYardPajaroStationCastrovilleStationSalinasStationSalinasBusSalinasYard2007TotalsYOETotalsParking and access — — $ 1,805 $ 2,085 $ 2,244 $1,526 — $7,660 $8,426Pedestrian structures — — — 900 — — — 900 990Platform and station amenities — — 1,602 1,953 2,555 1,298 — 7,408 8,149Track and signal improvements 5,000 2,088 3,937 3,251 1,103 — 3,718 19,097 20,099Specialty items — — 179 — 227 — 202 608 669Mobilization — 209 753 729 613 282 392 2,978 3,276Contingencies — 804 2,897 3,122 2,360 1,087 1,509 11,779 12,957Construction Total $5,000 $3,101 $11,173 $12,040 $ 9,102 $4,193 $5,821 $50,430 $54,566Soft cost — 1,023 3,687 3,973 3,004 1,384 1,921 14,992 15,756Right-of-way — — 2,170 430 7,750 4,250 4,000 18,600 19,346Subtotal $5,000 $4,124 $17,030 $16,443 $19,856 $9,827 $11,742 $84,022 $89,668Vehicles (risk element) — — — — — — — 8,800 9,616Unallocated contingency 9,282 9,871Total $5,000 $4,124 $17,030 $16,443 $19,856 $9,827 $11,742 $102,104 $109,155High-speed transmission, over the road 40-foot coaches would be acquired for this service with acapacity of 45 to 49 passengers per vehicle. Twenty-five vehicles (plus 5 spares) would be requiredto operate the service in the near term to carry 1,028 commuters to the San Francisco Peninsulaeach weekday. Of these, 21 vehicles would operate to/from Santa Clara County and 4 vehicles wouldparsons EXECUTIVE SUMMARY ES-5
CALTRAIN EXTENSION TO MONTEREY COUNTYALTERNATIVES ANALYSISoperate to/from San Mateo and San Francisco counties. This is equivalent to two Caltrain trips extendedfrom Gilroy to Salinas. Longer term, a fleet of 60 motor coaches (50 vehicles in revenueservice plus 10 spares) would be required to accommodate the four Caltrain each way ridershipscenario. The same fare structure as proposed for the Caltrain <strong>Extension</strong> Alternative is assumed forthe Express Bus Alternative. All fare revenues would be used to offset operating and maintenanceexpenses. Table 2 outlines the Express Bus Alternative capital cost estimates.Table 2Express Bus Alternative Capital Cost Estimate ($1,000 FY 2007)Work DescriptionPajaroPark-and-RideCastrovilleParkand-RideSalinasStationSalinasBusSalinasPark-and-RideMarinaBusMarinaParkand-Ride2007TotalsYOETotalsParking and access $2,227 $1,426 — $1,215 $ 8,888 $ 485 $1,390 $15,631 $17,194Pedestrian structures — 900 — — — — — 900 990Platform and station amenities 576 453 2,301 1,298 — 1,204 — 5,832 6,415Track and signal improvements — 605 316 — — — — 921 1,013Specialty items 50 100 75 50 — — — 275 303Mobilization 285 349 269 256 889 169 139 2,356 2,592Contingencies 1,098 1,341 1,036 987 1,955 650 535 7,602 8,362Construction Total $4,236 $5,174 $3,997 $3,806 $11,732 $2,508 $2,064 $33,517 36,271Soft cost 1,398 1,707 1,319 1,256 4,106 702 681 11,169 11,741Right-of-way 2,170 409 — 4,250 1,650 74 2,622 11,175 11,593Subtotal $7,804 $7,290 $5,316 $9,312 $17,488 $3,284 $5,367 $55,861 59,605Vehicles — — — — — — — 30,000 36,383Maintenance facility — — — — — — — 6,000 6,493Unallocated contingency — — — — — — — 4,593 4,866Total $7,804 $7,290 $5,316 $9,312 $17,488 $3,284 $5,367 $96,454 $107,347DETAILED EVALUATION OF ALTERNATIVESThe <strong>Alternatives</strong> <strong>Analysis</strong> study includes a detailed evaluation of how well each alternative/alignmentoption can meet the goals and objectives established for the project. These goals/objectives are to:• Improve mobility• Improve the environment• Optimize transit operating efficiencies• Provide a cost-effective solution• Support local land use plans and respond to growth.The evaluation methodology was designed to ensure that local priorities and Federal Transit Administrationcriteria were met. Table 3 shows some of the key results of the evaluation. These resultscompare the Caltrain <strong>Extension</strong> Alternative to the Express Bus Alternative for the selected evaluationcriteria, including cost and user benefits. The benefits monetized in Table 3 are expressed as positiveparsons EXECUTIVE SUMMARY ES-6
CALTRAIN EXTENSION TO MONTEREY COUNTYALTERNATIVES ANALYSISdollars, while costs are expressed as (negative) dollars. Table 3 demonstrates that the benefits of theCaltrain <strong>Extension</strong> Alternative exceed the benefits of the Express Bus alternative in both 2010 and2030.Table 3Summary of Caltrain <strong>Extension</strong> and Express Bus Alternative BenefitsUser Benefits2010 2030Benefit Type Caltrain Express Bus Caltrain Express BusIn-vehicle travel time $ 252,032 $ 252,032 $ 6,985,931 $ 4,160,454Fuel costs 4,499,622 4,499,622 8,631,039 8,631,039Non-fuel operating cost savings 1,925,316 1,925,316 3,693,083 3,693,083Transit user fees (3,310,612) (3,310,612) (6,320,790) (6,320,790)Internal accident costs or savings—Highway 3,144,040 3,144,040 6,027,934 6,027,934Transit (150,545) (893,907) (304,004) (1,698,612)Revenue Transfers (Fuel Taxes) (893,915) (893,915) (1,714,681) (1,714,681)Reduction in External CostsEmissions 14,361 (105,368) (136,415) (381,210)Highway accidents 554,830 554,830 1,063,753 1,063,753Transit accidents (14,406) (148,306) (28,744) (284,432)Net Public Operating Costs (1,175,068) (5,256,095) (2,393,619) (10,812,623)Total $4,845,655 ($232,363) $15,503,487 $2,363,915The evaluation of the Caltrain <strong>Extension</strong> and Express Bus alternatives assumed equal ridership forboth the commuter rail and express bus modes. For this reason, most of the user benefits identifiedabove are equal between the Caltrain and Express Bus options. By the year 2030, in-vehicle traveltime for the Express Bus Alternative will be longer due to increased roadway congestion; however, forthe most part benefits are the same or similar between the two modal options. The significantdifference is “Net Public Operating Costs” which is the difference between total operations and maintenanceexpense and fare revenues (transit user fees) paid to ride the service. Operation of a largebus fleet with limited seating capacity between Monterey County and San Francisco Peninsulastations is far more expensive than the incremental cost of extending Caltrain service 37 miles fromGilroy to Salinas.The Caltrain <strong>Extension</strong> and Express Bus alternatives are assumed to be implemented by 2010, withthe initiation of service occurring in 2011. An analysis of life-cycle benefits and costs indicates thatthe Caltrain <strong>Extension</strong> Alternative will have a higher benefit-cost ratio than the Express Bus Alternativeover a 20-year, 2011 to 2030 payback period, as indicated in Table 4. Higher operating costsand the need to more frequently replace express bus vehicles result in less favorable performance forthe Express Bus Alternative compared to the Caltrain <strong>Extension</strong> Alternative. The payback period isthe amount of time measured in years to recover the life cycle investments (capital and net publicoperating costs). The table shows that public investment in the Express Bus Alternative will never bepaid back.parsons EXECUTIVE SUMMARY ES-7
CALTRAIN EXTENSION TO MONTEREY COUNTYALTERNATIVES ANALYSISThis analysis includes estimates of user benefits including travel time savings, reductions in out-ofpockettravel expenses, and reduced accident costs. Estimates of revenue transfers (reduced publictax revenue collections) are included in the analysis. The economic analysis also measures externalcosts such as the health cost of motor vehicle emissions and accident costs which are not perceivedby users.Table 4Summary of Benefit Cost <strong>Analysis</strong> ResultsCaltrain <strong>Extension</strong>Express BusLife cycle benefits/total costs ratio $203 M/$102 M = 1.99 $21 M/$116 M = 0.18Net present value of benefits/costs at 7% discount rate $77 M/$88 M = 0.88 $7 M/$84 M = 0.08Payback period at 7% discount rate 23.5 years Not paid backSelection of a locally preferred alternative is seldom based on cost/benefit information alone. For thisreason, social or societal performance indicators have been included to address key issues of projectfeasibility.FREQUENTLY ASKED QUESTIONS1. Will the fixed guideway investment attract sufficient ridership to be worthy of the investment?The Caltrain <strong>Extension</strong> Alternative and Express Bus Alternative are forecast to attractapproximately 1,028 riders each direction (2,056 riders per day) as of 2010, and twice thisnumber by 2030. Spread over a two-hour commute window, this ridership would be equivalent toapproximately one-quarter of one freeway lane times 74.2 miles (equal to 18.5 lane miles) in2010, and one-half of one freeway lane times 74.2 miles (equal to 37 lane miles) in 2030. Bothtransit alternatives would be capable of carrying additional riders as demand warrants, and couldtherefore provide additional freeway equivalent capacity to the U.S. 101 Corridor over and abovethese levels. When compared to the cost of constructing equivalent freeway capacity (at $5million per lane mile for freeway construction), the proposed transit fixed guidewayinvestment will pay for itself in one year.When compared to other transit investments, the Monterey County Caltrain <strong>Extension</strong> andExpress Bus <strong>Alternatives</strong> perform very well from a passenger miles traveled perspective.Table 5 indicates that Monterey County’s 2,056 daily riders (2010 ridership), for example, isequivalent to more than 12,000 Bay Area Rapid Transit (BART) riders, based on passenger milestraveled.2. Is the proposed fixed guideway investment cost effective?The benefit-cost analysis summarized above indicates that the Caltrain <strong>Extension</strong> Alternative iscost effective and yields life cycle benefits which nearly equal costs. The Express Bus Alternativeis one-tenth as cost effective. Table 6 compares ridership with annualized capital costs,operations and maintenance costs, and net public (subsidy) costs. Relative to other (national)transit fixed guideway investments, both the Caltrain <strong>Extension</strong> and Express Busalternatives are cost effective ($10.29 to $24.03 of public investment per rider).parsons EXECUTIVE SUMMARY ES-8
CALTRAIN EXTENSION TO MONTEREY COUNTYALTERNATIVES ANALYSISTable 5Daily Caltrain <strong>Extension</strong> Transit Rider Equivalents Based on Trip Length (2004)Mode/ServiceAverage TripLength (miles)Trip LengthRatio*Daily RiderEquivalent†Monterey County Caltrain/Express Bus (2010) 74.2 1 2,056National<strong>Commuter</strong> rail 23.5 3.16 6,497Heavy rail 5.2 14.27 29,339Light rail 4.5 16.49 33,903Bus 3.7 20.05 41,223San Francisco Bay AreaCaltrain Peninsula Corridor Joint Powers Board 20.07 3.70 7,607Altamont <strong>Commuter</strong> Express 47.92 1.55 3,187Bay Area Rapid Transit (BART) 12.59 5.89 12,110Santa Clara Valley <strong>Transportation</strong> Authority 4.42 16.79 34,520Source: 2004 National Transit Database, Parsons*Trip Length Ratio = Monterey County Average Trip Length ÷ Average Trip Length†Daily Rider Equivalent = Trip Length Ratio × Monterey County Daily Rider Equivalent645188AA-102Table 6Capital and Operating Costs per Rider and per Passenger MileCaltrain <strong>Extension</strong> AlternativeExpress Bus AlternativeParameter 2010 2030 2010 2030Annual ridership 524,280 1,001,130 524,280 1,001,130Annual passenger miles 38,903,565 74,642,682 38,903,565 74,642,682Annualized capital cost ($ 2007) $7,150,000 $7,905,137 $7,337,476 $9,226,006Annualized capital cost per rider $13.64 $7.90 $14.00 $9.22Annualized capital cost per passenger mile $0.184 $0.106 $0.189 $0.124Annual O&M cost ($ 2007) $4,485,680 $8,714,409 $8,566,7071 $17,133,413O&M cost per rider $8.56 $8.70 $16.34 $17.11O&M cost per passenger mile $0.115 $0.117 $0.220 $0.230Annual fare revenue $3,310,612 $6,320,790 $3,310,612 $6,320,790Annual net public operating cost $1,175,068 $2,393,619 $5,256,095 $10,812,623Net public operating cost per rider $2.24 $2.39 $10.03 $10.80Net public operating cost per passenger mile $0.030 $0.032 $0.135 $0.1453. Will the proposed fixed guideway investment equitably serve Monterey County residents?The proposed Caltrain <strong>Extension</strong> and the Express Bus alternatives will provide Monterey Countyresidents with public transportation access to relatively high paying jobs, colleges anduniversities, health care facilities, sports venues, national/international airports, recreational destinationsand shopping attractions in the San Francisco Bay Area.As of 2000, more than 233,000 residents of Monterey County and southern Santa Cruz Countylived within 4.5 miles of one of the three Caltrain <strong>Extension</strong> commuter rail stations. Based on thefindings of the 2000 census, more than 50 percent of the population served is likely to be ofparsons EXECUTIVE SUMMARY ES-9
CALTRAIN EXTENSION TO MONTEREY COUNTYALTERNATIVES ANALYSISHispanic/Latino background and nearly 50 percent of the population served is classified as beingof low or moderate income. In Santa Clara County, the average wage of all private workers isnearly double the average in Monterey County; while the average wage of high tech workers isnearly three and one-half times that paid by Monterey County employers. As of 2000, more than570,000 jobs were available in Santa Clara County/Silicon Valley. Both the Caltrain <strong>Extension</strong> andthe Express Bus alternatives will provide travel time competitive, affordable transit access tothese higher paying jobs.4. Will the proposed fixed guideway investment generate economic benefits for MontereyCounty?Population and housing growth are forecast for the communities and neighborhoods surroundingthe proposed fixed guideway stations. The Caltrain <strong>Extension</strong> and Express Bus alternatives couldhelp to accommodate this growth by providing efficient public transportation options.Beneficial impacts to community cohesion and quality of life would occur for residents and businessesnear the proposed rail stations or park-and-ride facilities. Residential property values areexpected to increase slightly near transit stations. <strong>Rail</strong> stations have a higher correlation withtransit-oriented development and increase in property values than bus centers. (See the responseto question 5 for more on transit-oriented development.)Employment growth at the proposed station sites would result mostly from a redistribution of existingemployment. Access to regional jobs and educational and entertainment opportunities wouldincrease for residents living near proposed stations, including environmental justice populations.As noted above, the proposed project will provide access to higher paying jobs in Santa ClaraCounty/Silicon Valley, as well as jobs located in San Mateo and San Francisco counties. Inaddition to jobs, educational opportunities that provide entry level access to these higher payingjobs will be accessible by the proposed Caltrain <strong>Extension</strong> and Express Bus alternatives.Higher wages earned by Monterey County residents working in the San Francisco Bay Area willlikely create secondary employment opportunities in the Monterey Bay region.5. Will the proposed transit centers promote localized transit-oriented development?The <strong>Transportation</strong> Agency for Monterey County has adopted a set of guidelines for communitydevelopment that encourage the siting of higher density housing and mixed-use developmentsaround transit centers. Higher density housing near rail stations could provide additionalaffordable or workforce housing. The Agency will partner with jurisdictions to promote transitorienteddevelopment around transit centers. The <strong>Transportation</strong> Agency also administers the<strong>Transportation</strong> for Livable Communities Transit-Oriented Development incentive grant program,which rewards jurisdictions who approve such developments with funds for transportationprojects. Encouraging this kind of growth around transit maximizes the investment in thetransportation networks by promoting transit use and infill development in walkable areas, therebyincreasing living and transportation choices while reducing reliance on automobiles.General and local community plans show higher density housing and mixed-use developments inproximity to the three proposed rail stations. The draft Castroville Community Plan proposeshousing and mixed-use developments proximate to the rail station. The City of Salinas’s GeneralPlan and Downtown Rebound Plan both call for redevelopment around the intermodaltransportation center. In Pajaro, the County Redevelopment and Housing office is planning for ajob-training center next to the rail station. All three plans actively support the transit centers asfocal points for redevelopment and infill development.parsons EXECUTIVE SUMMARY ES-10
CALTRAIN EXTENSION TO MONTEREY COUNTYALTERNATIVES ANALYSIS6. Is funding available to implement the proposed transit service?Table 7 lists the proposed capital budget for the Caltrain <strong>Extension</strong> to Monterey County project.The total estimated project cost is $99.5 million expressed in year-of-expenditure dollars,including a layover facility, bus transfer center, and commuter parking in Salinas, a platform andparking in Castroville, a platform and parking in Pajaro, and main line Union Pacific trackupgrades in Gilroy and between Gilroy and Salinas. The budget does not include an allowance forCaltrain rolling stock as sufficient passenger capacity exists to implement the two-train and fourtrainscenarios without need for additional passenger coaches.Funding for the Caltrain <strong>Extension</strong> project includes the State Traffic Congestion Relief Program,Proposition 116 rail bond funds, State <strong>Transportation</strong> Improvement Program–Public <strong>Transportation</strong>Account funds, Regional Surface <strong>Transportation</strong> Program-Interest, a federal earmark, CongestionMitigation and Air Quality Improvement funding, and contributions from local partneragencies. A proposed application for FTA New Starts funding in the amount of $45.0 million fillsthe gap between the available funding and the estimated total project cost. These fund sourcesand amounts are preliminary and are subject to change.Three sources of funds required to meet net public operating costs (subsidize transit operationsand maintenance expenses) are anticipated: Local <strong>Transportation</strong> funds, State Transit Assistancefunds, and local sales tax funds. 1Table 7Caltrain <strong>Extension</strong> to Monterey County Capital Budget—Funding Element(year of expenditure dollars)Funding SourcesIdentified FundsAvailable Secured Proposed Grand TotalRegional Surface <strong>Transportation</strong> Program–Interest $ 315,000 $ 315,000 $ 0 $ 315,000Federal earmark $ 990,644 $ 990,644 $ 0 $ 990,644Congestion Mitigation and Air Quality Improvement $ 975,000 $ 975,000 $ 0 $ 975,000Proposition 116 rail bond funds $ 3,000,000 $ 3,000,000 $ 0 $ 3,000,000State <strong>Transportation</strong> Improvement Program $ 4,520,000 $ 4,520,000 $ 0 $ 4,520,000Traffic Congestion Relief Program $ 20,000,000 $20,000,000 $ 0 $ 20,000,000Local contributions $ 16,865,000 $ 1,165,000 $15,700,000 $ 16,865,000Monterey–Salinas Transit Federal grant/local match $ 9,411,000 $ 0 $ 9,411,000 $ 9,411,000Federal New Starts $ 45,000,200 $ 0 $45,000,200 $ 45,000,200Total Revenues $101,076,844 $30,965,644 $70,111,200 $101,076,844Source: TAMC—subject to changePARTNERSHIPS AND COLLABORATIONThere is strong local support for the proposed service extension due to the projected populationgrowth in the Monterey Bay Area and the increasing numbers of San Francisco Bay Area workerswho are making their homes in San Benito, Santa Cruz, and Monterey counties. A multi-agency taskforce comprised of the Santa Clara Valley <strong>Transportation</strong> Authority, <strong>Transportation</strong> Agency forMonterey County, Association of Monterey Bay Area Governments, MST, Caltrans, Santa Cruz1 A local transportation sales tax is proposed as a November 2008 ballot initiative.parsons EXECUTIVE SUMMARY ES-11
CALTRAIN EXTENSION TO MONTEREY COUNTYALTERNATIVES ANALYSISCounty Regional <strong>Transportation</strong> Commission, San Benito County, and the cities of Salinas andWatsonville has been meeting to discuss and plan the initial steps to creating this train serviceextension. This project is an outgrowth of their multi-agency coordination.Local and regional agencies representing the study area or portions thereof have conducted manystudies that serve as precursors or complements to this selection of a locally preferred alternative.The project has been coordinated with the Union Pacific <strong>Rail</strong>road, the Peninsula Corridor JointPowers Board, Caltrans, the Santa Clara Valley <strong>Transportation</strong> Authority, the City of Salinas, theRedevelopment Agency of Monterey County, Monterey–Salinas Transit, the City of Watsonville, theSanta Cruz County Regional <strong>Transportation</strong> Commission, and the Santa Cruz Metropolitan TransitDistrict.Specific ongoing efforts include the City of Salinas’ plans for intensified transit-oriented developmentnear the Salinas station site, Caltrans’ plans for upgrading SR 156 east of Castroville Boulevard, theCastroville Community Plan, the Pajaro Community Plan, Union Pacific’s short- and long-term plansfor freight and yard operations, and the California Passenger <strong>Rail</strong> System Five-Year ImprovementPlan.SELECTION OF THE LOCALLY PREFERRED ALTERNATIVEThe results of this <strong>Alternatives</strong> <strong>Analysis</strong> study indicate that the Caltrain <strong>Extension</strong> to MontereyCounty is the most cost-effective alternative for serving inter-county commuters to SiliconValley and providing access to educational and health care resources in the San FranciscoBay Area. Selection of this option will meet the purpose and need of the proposed investment by providingadditional transportation capacity in the U.S. 101 travel corridor. Further, selection of the Caltrain<strong>Extension</strong> modal option can increase capacity over and above that defined for the Caltrain<strong>Extension</strong> Alternative by increasing the length of the trains and/or increasing the number of trains.The Caltrain <strong>Extension</strong> Alternative is also superior to the Express Bus Alternative for stimulating thelocal economy and supporting transit-oriented development.For the purpose of evaluating project worthiness, the Federal Transit Administration requires thatproject applicants for federal “New Starts” discretionary funding provide comparative information on aExpress Bus or “best bus” alternative. For this reason, performance characteristics of a “baseline”alternative have been included in this study along with those of the Caltrain <strong>Extension</strong> Alternative andthe minimum operating segment of the Caltrain <strong>Extension</strong> Alternative.Based on the array of technical information, evaluation findings and public input, a key outcome ofthe detailed <strong>Alternatives</strong> <strong>Analysis</strong> is the selection of a preferred long-term strategy for the corridor.The long-term strategy is defined as investments required to address the 2030 planning horizon. As asubcomponent of the locally preferred alternative, a reduced scope alternative is defined to addressnear term, opening year needs. This reduced scope alternative is known as the “minimum operatingsegment.” The minimum operating segment must address the purpose and need for the project withinthe context of near-term demographic and travel conditions. For the purpose of this study, the neartermminimum operating segment is defined for 2010 conditions.Three stations would initially be constructed as proposed for the full Caltrain <strong>Extension</strong> Alternative.Parking supplies would be reduced, however, commensurate with ridership expectations for the2010–2015 initial years of service operation. Other aspects of the minimum operating segment wouldbe as defined for the full Caltrain <strong>Extension</strong> Alternative.parsons EXECUTIVE SUMMARY ES-12
CALTRAIN EXTENSION TO MONTEREY COUNTYALTERNATIVES ANALYSISCHAPTER 1: INTRODUCTIONOVERVIEW OF MONTEREY COUNTY FIXED GUIDEWAY STUDYThe Monterey County Fixed Guideway Study considers major transit capital investment for intercountycommuting and intra-county travel needs. Inter-county commuting consists of travel betweennorthern Monterey County and southern Santa Cruz County to the San Francisco Bay Area. Intracountytravel consists of trips along the Monterey Peninsula and trips between the MontereyPeninsula and Salinas. Figure 1-1 illustrates and summarizes the travel markets considered by theMonterey County Fixed Guideway Study.The Monterey County Fixed Guideway Study had its origins in 1990 with the passage of Proposition116, a California voter initiative which identified Monterey County as a recipient of rail bond capitalfunds for passenger rail projects within the county.In 1990, the Governor approved Assembly Bill No. 222, which appropriated $100,000 for a rail passengerfeasibility study for the Gilroy–Monterey portion of the San Francisco–Monterey rail corridor.Passenger <strong>Rail</strong> Feasibility Study No. 05D423 was prepared for the California Department of <strong>Transportation</strong>(Caltrans) District 5 in 1992 and finalized in September 1993. It addressed the feasibility ofpassenger rail service between San Francisco, Monterey, Salinas, and Hollister. The study found amarket for work trips using passenger rail between Salinas and Silicon Valley, and indicated thatservice to Salinas would be the most feasible short-term corridor due to the presence of existing railfacilities. A daily schedule of two northbound trains departing from Salinas and two southbound trainsterminating in Salinas was recommended.Subsequent to this study, Monterey County officials apportioned the Proposition 116 bond fundingbetween the U.S. 101 Corridor and Monterey Peninsula travel markets.U.S. 101 Corridor ElementInsofar as the U.S. 101 Corridor fixed guideway alternative(s), project scoping activities for anextension of Caltrain to Monterey County have been ongoing since 1996. From June 1996 to June1998, the City of Salinas sponsored investigations of development options for a Salinas Intermodal<strong>Transportation</strong> Center to be developed at the site of the existing Amtrak Station. Phase 1 of thetransportation center, consisting of bus layover bays, surface parking, site landscaping and lighting,was subsequently constructed and placed into operation in 1999.In 1997, the City of Watsonville prepared a Draft Pajaro Valley Station Project Study Report, incooperation with Monterey County, the <strong>Transportation</strong> Agency of Monterey County (TAMC) and theSanta Cruz County Regional <strong>Transportation</strong> Commission. While not finalized, the draft project studyreport (PSR) identified a potential site location and set of program requirements for this station.During the time period from 1998 to 2000, these program requirements and opportunities for adjacentsite development were further refined and explored by a Monterey County–sponsored Pajaro<strong>Rail</strong>yards Area Feasibility Study. This study, as well as the draft PSR, sited the Pajaro Valley Stationadjacent to the former Southern Pacific Passenger Depot, accessed from Salinas Road.parsons CHAPTER 1: INTRODUCTION 1
CALTRAIN EXTENSION TO MONTEREY COUNTYALTERNATIVES ANALYSISFigure 1-1Monterey County Fixed Guideway Travel Markets Intra-County <strong>Transportation</strong> Issues:Peak period congestion on• SR 1 between Marina and Monterey• SR 68 between Monterey/Seaside and Salinas• Reservation Road/Blanco Road between Marina and Salinas Inter-County <strong>Transportation</strong> Issues:Peak period congestion on• SR 1 north of Marina to Santa Cruz• U.S. 101 from Salinas to San Francisco• SR 156 between SR 1 and U.S. 101645188AA-001v1parsons CHAPTER 1: INTRODUCTION 2
CALTRAIN EXTENSION TO MONTEREY COUNTYALTERNATIVES ANALYSISIn 2000, TAMC sponsored the preparation of the <strong>Extension</strong> of Caltrain <strong>Commuter</strong> Service toMonterey County Business Plan. The business plan considered, but did not thoroughly evaluate,alternative sites for stations at Pajaro and Castroville and a layover yard in Salinas.Coinciding with the preparation of the Business Plan, the State of California enacted the TrafficCongestion Relief Act of 2000, which earmarked $20 million for the Caltrain extension to Salinas. Tosecure state funding, a transportation project in California must be included in the State<strong>Transportation</strong> Improvement Program. To enter the State <strong>Transportation</strong> Improvement Program,projects must have a “project initiation document” which is typically a PSR. The intent of the PSR is toprovide decision makers with sufficient information to make budget decisions. In the case of theCaltrain <strong>Extension</strong> project, the PSR was initiated on March 28, 2002 and completed on February 21,2006. The extensive time required to prepare this document resulted from citizen and agency inputregarding definition of the Build Alternative.A California Environmental Quality Act Environmental Impact Report was also prepared in parallel tothe PSR, with a Draft Environmental Impact Report circulated for public review on April 26, 2006 anda Final Environmental Impact Report certified on August 23, 2006.The proposed project consists of four elements: commuter rail station construction at the communitiesof Pajaro and Castroville; renovations/expansions of an existing passenger rail station andconstruction of a new parking facility at Salinas; and construction of a commuter rail layover facility atSalinas (Figure 1-2). Improvements to the Union Pacific <strong>Rail</strong>road (UPRR) Coast main line betweenGilroy and Salinas and institutional arrangements required for construction and operation ofcommuter rail service between Gilroy and Salinas are also part of the Caltrain <strong>Extension</strong> Alternative.Monterey Peninsula Corridor ElementIn parallel with the Caltrain <strong>Extension</strong> to Salinas project, a number of studies have been undertakento define fixed guideway service in the Monterey Peninsula Corridor.The Caltrans-sponsored “Passenger <strong>Rail</strong> Feasibility Study” cited above was completed in September1993 by Wilbur Smith & Associates in response to a state legislative requirement. This studyexamined both intercity and commuter rail services from San Francisco to Monterey, Salinas andHollister and intercity service from San Francisco to Los Angeles that would also provide servicebetween San Francisco and Salinas. As a result of this study, a locally-preferred alternative (LPA)was adopted in the 1994 Regional <strong>Transportation</strong> Plan. This LPA was comprised of short-term andlong-term elements. In the short-term all rail services were to serve Salinas to minimize capital costsand included extension of one Caltrain commute train, a San Francisco to Salinas intercity train and aSan Francisco to Los Angeles train serving Salinas. In the long-term, rail service into Monterey wouldbe restored either via the Monterey branch line from Castroville or via a new alignment from Salinasthrough Fort Ord to Monterey.The “San Francisco–Monterey Intercity <strong>Rail</strong> Service Implementation Plan” was completed in January1998 by De Leuw, Cather & Company for TAMC. The study examined the travel market from the SanFrancisco Bay Area to the Monterey Bay Area by all modes. It found that there is a market for a oncedaily Friday through Monday rail service from San Francisco to Seaside in the morning and return inthe evening with shuttle buses from Seaside to Monterey destinations. It also estimated the incrementalridership that would be generated by a bus connection from Castroville to Salinas and throughconnections with the Capitol Corridor at San Jose when the market justifies a second daily train.parsons CHAPTER 1: INTRODUCTION 3
CALTRAIN EXTENSION TO MONTEREY COUNTYALTERNATIVES ANALYSISFigure 1-2Caltrain <strong>Extension</strong> to Monterey County Project Study Areaparsons CHAPTER 1: INTRODUCTION 4
CALTRAIN EXTENSION TO MONTEREY COUNTYALTERNATIVES ANALYSISProducts from this study included:• Strategic planning and railroad negotiations (October 1995–December 1997)• Sand City/Seaside Station Plans (October 1996)• Market Research and Ridership Forecasts (December 1996) Monterey Branch LineEngineering Investigations (January and February 1997)• <strong>Rail</strong> Development Issues and Implementation Plan (February 1997)The “Around the Bay <strong>Rail</strong> Study” was completed in July 1998 by LS Transit Systems for TAMC andthe Santa Cruz County Regional <strong>Transportation</strong> Commission. This study examined joint services fromthe San Francisco Bay Area to Monterey and Santa Cruz. It projected the ridership for weekendservices building over time to frequent daily services. It analyzed the operating cost advantage ofdiesel multiple unit rolling stock in comparison to locomotive-hauled trains.In 1999, STV Incorporated was contracted by TAMC to prepare environmental reports and apreliminary design of improvements necessary to accommodate intercity passenger rail servicebetween Monterey and San Francisco on the Monterey branch line. This effort was completed inMarch 2003. Satisfying the Federal Transit Administration requirement for a major investment study(MIS) was also included in the scope of work.Accordingly, TAMC formed a major investment study task force on March 28, 2000. This task forcemet on April 25, 2000 and identified four alternatives—a Base-Case Alternative (no action or nobuild), a Transit Demand Alternative, a Build Alternative to establish a limited stop bus service, and aBuild Alternative to establish an intercity rail service. The Build Alternative (Caltrain <strong>Extension</strong>Alternative) assumed operation of a passenger rail service from San Francisco to Monterey via theCaltrain line to San Jose, the UPRR from San Jose to Castroville (shared with limited Caltrain serviceto Gilroy and a future extension to Salinas) and the Monterey branch line to a Monterey Bay station tobe constructed at Fort Ord. Shuttle buses serving various Monterey destinations would meet thetrains at the Monterey Bay station.Following the completion of the STV study, TAMC contracted with Kleinfelder, Inc. for the preparationof a Phase II Site Assessment for the 13-mile segment of the Monterey branch line owned by theUPRR between Castroville and Seaside. This work was completed in June 2003.TAMC subsequently purchased the Monterey branch line from UPRR in September 2003; usingProposition 116 state rail bond funding. Use of the Monterey branch line for public transportation isconditioned on certification of the California Environmental Quality Act and National EnvironmentalPolicy Act environmental documents.To address concerns regarding noise impacts associated with intercity train service, and to potentiallyqualify the Monterey Peninsula service for “New Starts” discretionary funding, TAMC contracted withParsons <strong>Transportation</strong> Group Inc. in June 2004 to undertake a Monterey Peninsula Fixed Guideway[<strong>Alternatives</strong> <strong>Analysis</strong>] Study. At the request of the Federal Transit Administration (FTA) staff, thescope of this study was later expanded to include the Caltrain <strong>Extension</strong> to Salinas project, in additionto examining Monterey Peninsula service options.A long list of alternatives was developed and reviewed with local policy makers and the public duringthe June 2004 to June 2005 timeframe. The list of alternatives was then narrowed between June andAugust 2005, and subsequently refined through April 2006. The rest of this chapter summarizesthese activities.parsons CHAPTER 1: INTRODUCTION 5
CALTRAIN EXTENSION TO MONTEREY COUNTYALTERNATIVES ANALYSISTHE ALTERNATIVE ANALYSIS PROCESSThe development and screening of alternatives are very important steps within the <strong>Alternatives</strong><strong>Analysis</strong> for the Monterey County Fixed Guideway Study. This alternatives analysis is both a planningactivity and an evaluative process, consisting of interrelated analytical phases (see Figure 1-3). A keydecision point in the study is the selection and adoption of a locally preferred alternative for the U.S.101 Corridor and Monterey Peninsula elements of the Monterey County Fixed Guideway Study.Figure 1-4 illustrates the evaluation criteria and measures utilized during this process.The overall planning and project development process for federally-funded transit projects is prescribedby the FTA and is referred to as the New Starts process. The following paragraphs provide abrief description of the analytical phases within the FTA New Starts process that provide decisionmaking framework for the Monterey County Fixed Guideway Study.Study InitiationIn this phase, the purpose and need for transportation improvements is carefully defined for the studyarea. Travel patterns, transportation system performance, and past studies are reviewed andanalyzed. The Purpose and Need statement summarizes this technical information along with publicinput and identifies key trends and issues. These issues lead to the determination of objectives to beachieved by transportation improvements in the study area.The <strong>Alternatives</strong> <strong>Analysis</strong> conducted to date indicates there are two separate but interrelated travelmarkets for fixed guideway transit serving Monterey County. One of these travel markets is the U.S.101 commuter market between northern Monterey County and southern Santa Cruz County to theSan Francisco Bay Area. This market and associated studies are referred to as the Monterey CountyFixed Guideway Study: 101 Corridor Element. The vast majority of this alternatives analysis report,following this chapter, pertains solely to the 101 Corridor Element.A second travel market is the Monterey Peninsula transportation market. It includes trips madebetween Peninsula cities and intra-county connections to Salinas and Castroville. These connectionsadditionally accommodate inter-city service to/from the San Francisco Bay Area. This market andassociated studies is referred to as the Monterey Peninsula Fixed Guideway Study.The “Build Alternative” of the Monterey County Fixed Guideway Study: 101 Corridor Elementis the Caltrain <strong>Extension</strong> to Monterey County. Hereafter, this alternatives analysis will bereferenced by that name.The U.S. 101 Corridor is heavily congested in the San Francisco Bay Area and portions of MontereyCounty. The proposed project would extend Caltrain commuter rail service from the existing terminusin Gilroy to Monterey County, including stations in Pajaro, Castroville, and Salinas, to relievecongestion, improve regional air quality, and provide transportation alternatives for commuters andresidents traveling between Monterey County and southern Santa Cruz County to the San FranciscoBay Area.The proposed extension of Caltrain to Salinas would provide an alternative means of travel betweenthese counties, significantly reducing congestion along U.S. 101 into Santa Clara, San Mateo, andSan Francisco counties, and improving regional air quality. In addition, the proposed rail service is acost effective alternative to widening U.S. 101.parsons CHAPTER 1: INTRODUCTION 6
CALTRAIN EXTENSION TO MONTEREY COUNTYALTERNATIVES ANALYSISFigure 1-3<strong>Alternatives</strong> Evaluation Process645188AA-002parsons CHAPTER 1: INTRODUCTION 7
CALTRAIN EXTENSION TO MONTEREY COUNTYALTERNATIVES ANALYSISFigure 1-4Evaluation Criteria and Measures645188AA-054parsons CHAPTER 1: INTRODUCTION 8
CALTRAIN EXTENSION TO MONTEREY COUNTYALTERNATIVES ANALYSISIn addition to lowering congestion on the roadways, the commuter rail extension would bring asignificant increase in ridership to both the existing Caltrain and the connecting Capitol Corridorservices. Other benefits to this new service include an increase in access to job opportunities, moretransportation alternatives for senior citizens and those with physical disabilities, increased access toeducational resources and health care in the San Francisco Bay Area.Currently in the Monterey County and San Francisco Bay areas, job distribution and worker housingdistribution patterns do not match. The northern counties of San Francisco and Santa Clara havelarge job surpluses, requiring approximately 117,000 non-San Francisco Bay Area residents to fill theavailable positions as of 2000 (Metropolitan <strong>Transportation</strong> Commission). This pull of workersgenerates a large volume of inter-regional commuter traffic, adding to highway congestion and airquality impacts.The U.S. Census for 2000 estimated that 18,073 persons living in Monterey County work in anothercounty. Of this number, more than 30 percent are employed within Santa Clara County or other BayArea counties. Available public transportation choices between Monterey County and Santa ClaraCounty are limited to three northbound bus trips (two Greyhound and one MST) during the AMcommute period and two southbound bus trips (one Amtrak Thruway and one MST) during theafternoon commute period. These buses are subject to traffic delays on U.S. 101 and SR 156.Development of Initial <strong>Alternatives</strong>As part of this phase, a candidate pool of initial conceptual alternatives is developed to addressmobility problems and other concerns in the study area. This initial set of conceptual alternatives isstructured to provide a range of multi-modal transportation infrastructure and service improvements.The transportation alternatives emphasize candidate alignments and levels of investment and thusaddress different aspects of the study purpose and need. Included in the initial set of alternatives arebaseline alternatives which assume there is no new major transit capital investment and various buildalternatives which may include major investments in bus and/or rail transit technologies. For theMonterey County Fixed Guideway Study 1 , the conceptual alternatives considered included:• No Build <strong>Rail</strong> Service• Caltrain to Salinas <strong>Rail</strong> Service• Monterey Peninsula to San Francisco Intercity <strong>Rail</strong> Service• Monterey Peninsula to San Francisco Intercity <strong>Rail</strong> Service plus Caltrain to Salinas and MontereyPeninsula• Monterey Peninsula Passenger <strong>Rail</strong> Shuttle to Castroville Caltrain Service• Local Monterey Peninsula LRT (light rail transit) or BRT (bus rapid transit) Service• Salinas to Monterey Local <strong>Rail</strong> Service• Monterey Peninsula to San Francisco Intercity <strong>Rail</strong> plus Salinas to Monterey Local <strong>Rail</strong>Service• Enhanced Local Bus plus Monterey County to San Francisco Peninsula Express Bus Service(transportation system management (TSM))See Figure 1-5 for a brief description and location of the preliminary alternatives.1Combined study of the U.S. 101 Corridor and Monterey Peninsula elements.parsons CHAPTER 1: INTRODUCTION 9
CALTRAIN EXTENSION TO MONTEREY COUNTYALTERNATIVES ANALYSISScreening of Initial <strong>Alternatives</strong>These eight alternatives were defined for capital cost estimating purposes. Capital cost information(Table 1-1), together with mode technology information, right-of-way utilization and potential stationrenderings, public involvement findings, and a qualitative evaluation of alternative performance (seeFigure 1-6), was presented to the <strong>Rail</strong> Policy Committee (RPC) in June 2005, along with a ProjectDevelopment Team recommendation of shortlisted alternatives showing strong potential forimplementation. This short list recommendation along with subsequent refinements and revisionswere discussed with RPC at their July, August, and September 2005 meetings along with individualbriefings with committee members on request.Following the shortlisting of conceptual alternatives for further refinement and evaluation, the<strong>Alternatives</strong>-<strong>Analysis</strong> study was divided into two projects; one to serve intra-county needs and one toserve inter-county (Monterey to San Francisco Bay Area) needs. This <strong>Alternatives</strong> <strong>Analysis</strong>document addresses the inter-county commute market alternatives.Two alternatives were defined to address the inter-county travel market: the Caltrain <strong>Extension</strong> toSalinas Alternative (Build Alternative) and the Express Bus Alternative (<strong>Transportation</strong> SystemsManagement (TSM) Alternative). Five additional alternatives were considered, but rejected. Theseincluded:• Shuttle bus service to Gilroy• Limited stop bus service to San Jose• Shuttle train service to Gilroy• Independent train service to San Francisco• Bus rapid transit service(These alternatives that were considered, but rejected, are discussed in Chapter 3 along with theBuild Alternative and the TSM Alternative.)As a result of this public involvement and policy review process, four alternatives emerged for furtherrefinement and testing. These four alternatives, labeled A through D, are listed below:A. Caltrain to Salinas <strong>Rail</strong> Service (four roundtrips on weekdays) and Intracounty BRTService (Monterey to Castroville and Marina to Salinas).B. Intracounty BRT/LRT Service (BRT from Monterey to north Marina and Marina to Salinas,LRT from Monterey to Castroville), Monterey Peninsula to San Francisco Intercity <strong>Rail</strong>Service (Monterey to San Francisco) and Caltrain to Salinas <strong>Rail</strong> Service (<strong>Commuter</strong> <strong>Rail</strong>).C. Intracounty LRT Service (local LRT from Monterey to north Marina, LRT extension fromNorth Marina to Castroville and Castroville to Salinas), Monterey Peninsula to San FranciscoIntercity <strong>Rail</strong> Service (passenger rail from Monterey to San Francisco) and Caltrain toSalinas <strong>Rail</strong> Service.D. Express Bus Service to San Francisco Peninsula (between Monterey County Transit Centersand Santa Clara, San Mateo and San Francisco County Caltrain Station Sets) and EnhancedLocal Bus Service (Monterey to Marina and Marina to Salinas).parsons CHAPTER 1: INTRODUCTION 10
CALTRAIN EXTENSION TO MONTEREY COUNTYALTERNATIVES ANALYSISFigure 1-5Conceptual <strong>Alternatives</strong>ALTERNATIVE0No Build <strong>Rail</strong> ServiceExisting transit services and limited road improvements.• Caltrain• Intercity <strong>Rail</strong>• Regional Express Bus1Caltrain to Salinas <strong>Rail</strong> ServiceExtend four commuter rail roundtrips from Gilroy to Salinas.2Monterey Peninsula to San Francisco Intercity <strong>Rail</strong> ServiceOperate intercity train service between the Monterey Peninsula and San Francisco 2or 3 roundtrips per day.345Monterey Peninsula to San Francisco Intercity <strong>Rail</strong> Service PlusCaltrain to Salinas and Monterey PeninsulaOperate intercity train service between the Monterey Peninsula and San Franciscoplus extend two Caltrain roundtrips from Gilroy to Salinas, and two roundtrips fromGilroy to the north side of Marina.Passenger <strong>Rail</strong> Shuttle to Castroville Caltrain ServiceExtend four Caltrain commuter rail roundtrips from Gilroy to Salinas. Operateconnecting shuttle service between Seaside and Castroville to meet Caltrain serviceextension.Local Peninsula <strong>Rail</strong> or BRT ServiceConstruct LRT or BRT Guideway between Monterey and Marina, or extend LRT toCastroville. Potential intercity rail from Marina to San Francisco under sub-option 5D.Includes Caltrain extension to Salinas.• Caltrain• Intercity <strong>Rail</strong>• Local LRT• Local BRT• Enhanced Local Bus• Regional Express Bus• Caltrain• Local LRT• Regional Express Bus6Salinas to Monterey Local <strong>Rail</strong> or BRT ServiceConstruct LRT or BRT guideway between Monterey and Marina. Extend LRTguideway to Castroville via MBL and Salinas along Coast Mainline. Alternately,extend BRT guideway to Salinas via Blanco or Davis roads. Includes Caltrainextension to Salinas.7Monterey Peninsula to San Francisco Intercity Plus Salinas toMonterey Local <strong>Rail</strong> ServiceConstruct LRT between Monterey, Castroville and Salinas. Operate intercity railservice from Monterey to San Francisco. Use FRA-compliant diesel multiple railequipment for both services. Includes Caltrain extension to Salinas.• Local BRT• Enhanced Bus8Monterey County to San Francisco Peninsula Express BusService (TSM)Low cost transit investments to match locally preferred build alternative. Includesmajor roadway construction to provide capacity/reduce congestion.645188AA-055parsons CHAPTER 1: INTRODUCTION 11
CALTRAIN EXTENSION TO MONTEREY COUNTYALTERNATIVES ANALYSISTable 1-1Preliminary Capital Cost EstimatesAlternativeAlternative Name and Description0 No Build <strong>Rail</strong> Service—Existing transit services andlimited road improvements1 Caltrain to Salinas <strong>Rail</strong> Service—Extend fourcommuter rail roundtrips from Gilroy to Salinas2 Monterey Peninsula to San Francisco Intercity<strong>Rail</strong> Service —Operate intercity train servicebetween the Monterey Peninsula and San Francisco2 or 3 roundtrips per day3 Monterey Peninsula to San Francisco Intercity<strong>Rail</strong> Service Plus Caltrain to Salinas and MontereyPeninsula—Operate intercity train service betweenthe Monterey Peninsula and San Francisco plusextend two Caltrain roundtrips from Gilroy to Salinas,and two roundtrips from Gilroy to the north side ofMarina.4 Passenger <strong>Rail</strong> Shuttle to Castroville CaltrainService—Extend four Caltrain commuter railroundtrips from Gilroy to Salinas. Operate connectingshuttle service between Seaside and Castroville tomeet Caltrain service extension.5 Local Peninsula <strong>Rail</strong> or BRT Service—ConstructLRT or BRT guideway between Monterey and Marina,or extend LRT to Castroville. Potential intercity railfrom Marina to San Francisco under sub-option 5D.Includes Caltrain extension to Salinas.6 Salinas to Monterey Local <strong>Rail</strong> or BRT Service—Construct LRT or BRT guideway between Montereyand Marina. Extend LRT guideway to Castroville viaMonterey branch line and Salinas along Coast mainline. Alternately, extend BRT guideway to Salinas viaBlanco or Davis roads. Includes Caltrain extension toSalinas.7 Monterey Peninsula to San Francisco IntercityPlus Salinas to Monterey Local <strong>Rail</strong> Service—Construct LRT between Monterey, Castroville andSalinas. Operate intercity rail service from Montereyto San Francisco. Use FRA*-compliant diesel multiplerail equipment for both services. Includes Caltrainextension to Salinas.8 Monterey County to San Francisco PeninsulaExpress Bus Service—Low cost transit investmentsto match locally preferred Caltrain <strong>Extension</strong>Alternative. Includes major roadway construction toprovide capacity/reduce congestion.<strong>Transportation</strong> Investment ComponentMontereyPeninsulaFixed Guideway 1Caltrain<strong>Extension</strong>to Salinas 2HighwayElementsTotal0 0 0 00 $75M 0 $75M$44M 0 0 $44M$22M $75M 0 $97M$82M $75M 0 $157M5A—$ 88M5B—$125M5C—$ 75M5D—$117MSource:1 Capital Cost Report for the Monterey Branch Line, Parsons, February 20052 Draft Caltrain <strong>Extension</strong> to Monterey County Project Study Report, Parsons, February 2005*Federal <strong>Rail</strong>road Administration0$75M000000$ 88M$200M$ 75M$117M$155M $75M 0 $230M$155M $75M 0 $230MTBD TBD $1,234M $1,234M645188AA-065parsons CHAPTER 1: INTRODUCTION 12
CALTRAIN EXTENSION TO MONTEREY COUNTYALTERNATIVES ANALYSISFigure 1-6Qualitative Evaluation of Conceptual <strong>Alternatives</strong>ALTERNATIVE ADDRESSES PURPOSE AND NEED COMMUNITY ACCEPTANCE FUNDABLE CAPITAL AND OPERATING COSTS POTENTIAL FOR PHASED IMPLEMENTATION0No Build <strong>Rail</strong> ServiceExisting transit services and limited road improvements.• Congested corridors remain so• Continuation of status quo• Residential growth compounds problems• Residents desire traffic relief• Visitor and agricultural businesses desire traffic relief• Noise, air pollution, traffic reduce neighborhood cohesion/quality of life• Monterey Branch line ROW purchased for $9.3 million• Local/state funding inadequate for county andinterregional highway projects• Limited public financial support for transportation• Basic bus service expanded as funding permits• Limited roadway construction as funding permits• Local initiative sales tax for transportation pending localand state economic recovery12Caltrain to Salinas <strong>Rail</strong> ServiceExtend four commuter rail roundtrips from Gilroy to Salinas.Monterey Peninsula to San Francisco Intercity<strong>Rail</strong> ServiceOperate intercity train service between the Monterey Peninsula andSan Francisco 2 or 3 roundtrips per day.• Provides capacity/reduces traffic in U.S. 101 corridorbetween Salinas and Santa Clara/San Mateocounties• Stations centrally located in Salinas, Castroville, andPajaro/Watsonville• Trains operated during off-peak commute hours• Limited ridership forecast by earlier studies• One station proposed at former Fort Ord• Wide public support in station communities• Supported by regional agencies• Reduces long distance vehicle trips, thereby improving air quality• Station investments viewed as visual/community improvements• Community opposed to large train equipment (conventionallocomotive hauled passenger coaches)• Small diesel multiple unit trains proposed to address noise andvibration concerns• $75 million order of magnitude cost for 3 stations,layover facility, and track improvements. UPRRrequirements may increase costs• Net annual operating cost low, $1–2 million/year due tohigh fare revenues• $44 million order of magnitude capital cost, excludingequipment• $5 million net annual operating cost• Stations can be constructed as funding permits• Incremental parking supplies and stationenhancements• Low potential for phasing• Requires restoration of branch line track and bridgesbetween Castroville and Monterey Bay station3Monterey Peninsula to San Francisco Intercity<strong>Rail</strong> Service Plus Caltrain to Salinas andMonterey PeninsulaOperate intercity train service between the Monterey Peninsula andSan Francisco plus extend two Caltrain roundtrips from Gilroy toSalinas, and two roundtrips from Gilroy to the north side of Marina.• Provides capacity/reduces traffic in the U.S. 101corridor between Prunedale and Santa Clara/SanMateo counties• Monterey Peninsula station would be inconvenientlylocated, north of Marina near SR 1 and Del MonteAvenue• Community opposition to large train equipment (conventional Caltrainlocomotive and passenger coaches) would reposition Monterey Baystation• Out of sight station and service• Requires Caltrain investment ($75 million for Salinas,Castroville and Pajaro studies) plus $22 million for5 miles of Monterey branch line track and bridgerestoration• Caltrain service split between Salinas and MontereyPeninsula could reduce ridership yielding higher netpublic costs. $7 million annually for combined services• Caltrain service could be phased to service eitherSalinas or Monterey Peninsula• Stations can be constructed as funding permits• Requires restoration of branch line track and bridgesbetween Castroville and Monterey Bay station4Passenger <strong>Rail</strong> Shuttle to CastrovilleCaltrain ServiceExtend four Caltrain commuter rail roundtrips from Gilroy to Salinas.Operate connecting shuttle service between Seaside andCastroville to meet Caltrain service extension.• Provides capacity/reduces traffic in U.S. 101, SR 1,and SR 156 corridors• Stations centrally located in Seaside, Marina,Salinas, Castroville and Pajaro/Watsonville• Wide public support for Caltrain extension in Salinas, Castroville andPajaro• Caltrain extension supported by regional agencies• <strong>Rail</strong> shuttle would extend “reach” of Caltrain service, with smallervehicles• Reduces long distance vehicle trips, thereby improving air quality• $75 million capital cost for Caltrain extension• $82 million capital cost for Monterey branch line shuttle• Low net annual operating cost, $2–3 million/year forcombined service• Passenger rail shuttle requires construction andoperation of Caltrain extension to Salinas• Passenger rail shuttle could be added later• Shuttle service could be extended to Montereystation(s)5Local Peninsula <strong>Rail</strong> or BRT ServiceConstruct LRT or BRT Guideway between Monterey and Marina, orextend LRT to Castroville. Potential intercity rail from Marina to SanFrancisco under sub-option 5D. Includes Caltrain extension toSalinas.• Provides capacity/reduces traffic in U.S. 101, SR 1,and SR 156 corridors• Stations located throughout Monterey,Seaside/Sand City and Marina• Wide public support for Caltrain extension in Salinas, Castroville andPajaro• Provides local peninsula service, voiced in numerous public meetings• Provides local stations, serving local residents• Option 5D addresses visitor trips, without Caltrain connection• $75 million capital cost for Caltrain extension• $75 to 125 million capital cost for Monterey branch linelocal service, depending on length of service• Relatively low net annual operating cost. LocalLRT/BRT replaces existing bus route• Caltrain or Peninsula local service constructedindependent from one another• Local service extended in stages• Marina to Castroville local service requiresreplacement of Salinas River bridge6Salinas to Monterey Local <strong>Rail</strong> or BRT ServiceConstruct LRT or BRT guideway between Monterey and Marina.Extend LRT guideway to Castroville via Monterey branch line andSalinas along Coast Mainline. Alternately, extend BRT guideway toSalinas via Blanco or Davis roads. Includes Caltrain extension toSalinas.• Provides capacity/reduces traffic in U.S. 101, SR 1,and SR 68, SR 156, Blanco/Davis Road corridors• Stations located throughout Monterey, Seaside,Sand City, Marina, Castroville and Salinas• Wide public support for Caltrain extension in Salinas, Castroville andPajaro• Provides local Peninsula and Salinas to Peninsula service, voiced innumerous public meetings• Provides local stations, serving local residents• Environmental constraints may limit options for BRT guidewayconstruction between Marina and Salinas• $75 million capital cost for Caltrain extension• $155 million capital cost for Monterey branch line localand intracounty service, depending on mode of service• Relatively low net annual operating cost. LocalLRT/BRT replaces existing bus route• Caltrain or Peninsula local and intracounty serviceconstructed independent from one another• Local and intracounty service extended in stages• Marina to Castroville service requires replacement ofSalinas River bridge7Monterey Peninsula to San Francisco Intercity PlusSalinas to Monterey Local <strong>Rail</strong> ServiceConstruct LRT between Monterey, Castroville and Salinas. Operateintercity rail service from Monterey to San Francisco. Use FRAcompliantdiesel multiple rail equipment for both services. IncludesCaltrain extension to Salinas.• Provides capacity/reduces traffic in U.S. 101, SR 1,and SR 68, SR 156, Blanco/Davis Road corridors• Stations located throughout Monterey, Seaside,Sand City, Marina, Castroville and Salinas• Wide public support for Caltrain extension in Salinas, Castroville andPajaro• Provides local Peninsula and Salinas to Peninsula, and intercityservice to San Francisco service, voiced in numerous public meetings• Provides local stations, serving local residents and visitors• Diesel multiple unit (DMU) equipment requires taller (higher) stationplatforms• $75 million capital cost for Caltrain extension• $155 million capital cost for Monterey branch line localand intracounty service• Relatively low net annual operating cost for localintracounty and Caltrain extension services• $5 million annual net public cost for intercity service toSan Francisco• Caltrain or Peninsula local and intracounty serviceconstructed independent from one another• Intercity service can be added when funding permits• Local and intracounty service extended in stages• Marina to Castroville service requires replacement ofSalinas River bridge8Monterey County to San Francisco PeninsulaExpress Bus ServiceLow cost transit investments to match locally preferred buildalternative. Includes major roadway construction to providecapacity/reduce congestion.• Express bus is not enoughWidening U.S. 101, SR 1, SR 68, SR 183 orSR 156, and Blanco/Davis Roads will addresstransportation needs• Roadway improvement needs are well recognized• Environmental and funding constraints limit transportation solutions• $1,234 million of roadway projects identified by RTP toaddress specific purpose and need of transit investment• CT 036 – SR 156 West, $198 M current to 2020• CT 015 – SR 1 Sand City, $45 M, 2011–20• MYC 151 – Marina/Salinas, $35M, 2011–20• MRY 004 – Del Monte EB Lane, $30 M, 2011–20• CT 029 – 101 Prunedale Bypass, $421 M, 2011–30• CT 038 – SR 183 Widening, $50 M, not funded• CT 016 – SR 68 Bypass, $395 M, not funded• CT 028 – 101-Las Aromitas, $60 M, not funded645188AA-056parsons CHAPTER 1: INTRODUCTION 13
CALTRAIN EXTENSION TO MONTEREY COUNTYALTERNATIVES ANALYSISThis page intentionally left blank.parsons CHAPTER 1: INTRODUCTION 14
CALTRAIN EXTENSION TO MONTEREY COUNTYALTERNATIVES ANALYSISCommon to all Build <strong>Alternatives</strong> (A–C) is the extension of Caltrain service to MontereyCounty. This commonality reflects the conscious decision on the part of the RPC to excludefrom further consideration any build alternative which did not include the extension of Caltrainservice to Salinas.<strong>Analysis</strong> Refinement and Evaluation of the <strong>Alternatives</strong>During the analytical phase, many technical studies are performed on the final set of alternatives.The purpose of these studies is to elicit evaluative information on the alternatives as well as provide ahigher level of definition of their respective operational and physical characteristics. These technicalstudies include:• Detailed definition of alternatives and conceptual engineering• Travel demand forecasting• Environmental analysis• Estimation of capital, operating and maintenance costs• Financial capacity analysis.Once the technical studies are completed, the results are used to assess the travel benefits, costs,and impacts of the proposed alternatives. Key trade-offs among the alternatives are also evaluatedand discussed.Figure 1-7 illustrates this alternative evaluation process whereby alternatives undergo successivetesting, refinement and shortlisting, all directed toward the selection of the locally preferredalternative.Selection of the Locally Preferred AlternativeBased on the array of technical information, evaluation findings and public input, a key outcome ofthe detailed <strong>Alternatives</strong> <strong>Analysis</strong> is the selection of a preferred long-term strategy for the corridor.The long-term strategy is defined as investments required to address the 2030 planning horizon. As asubcomponent of the LPA, a reduced scope alternative is defined to address near term, opening yearneeds. This reduced scope alternative is known as the “minimum operating segment,” or MOS.The MOS must address the purpose and need for the project within the context of near-termdemographic and travel conditions. For the purpose of this study, the near-term MOS is defined for2010 conditions.For the purpose of evaluating project worthiness, the FTA requires that project applicants for federal“New Starts” discretionary funding also provide comparative information on a TSM or “best bus”alternative. For this reason, performance characteristics of a “baseline” alternative are included alongwith those of the Caltrain <strong>Extension</strong> Alternative minimum operating segment for comparison.parsons CHAPTER 1: INTRODUCTION 15
CALTRAIN EXTENSION TO MONTEREY COUNTYALTERNATIVES ANALYSISFigure 1-7<strong>Alternatives</strong> Evaluation Processparsons CHAPTER 1: INTRODUCTION 16
CALTRAIN EXTENSION TO MONTEREY COUNTYALTERNATIVES ANALYSISCHAPTER 2: EXISTING AND FORECAST CONDITIONSThe purpose of this project is to cost-effectively accommodate the existing and projected needs ofcommute-oriented traffic traveling between Monterey County and Santa Clara County, in order toprovide capacity for the U.S. 101 Corridor and therefore avoid or postpone the need for widening thisfacility beyond currently programmed projects. In addition to lowering congestion, the project willprovide access to job opportunities, educational resources and health care in the San Francisco BayArea and provide transportation alternatives for senior citizens and those with physical disabilities.REGIONAL OVERVIEWThe San Francisco Bay Area and the counties surrounding it comprise a region that is rapidly growingand becoming more economically interdependent. The central metropolitan counties closest to theSan Francisco Bay are home to more jobs than workers, while outlying counties such as MontereyCounty are subjected to rapid increases in population and mid-priced housing. As a result, thenumber of commuters between these regions is increasing significantly.In 2004, the Metropolitan <strong>Transportation</strong> Commission (MTC) published a report titled <strong>Commuter</strong>Forecasts for the San Francisco Bay Area: 1990-2030. This report estimates that the San FranciscoBay Area will need approximately 178,000 in-commuters from neighboring counties to fill theavailable jobs by 2010. This number is forecasted to reach 220,000 by 2030—an increase of87 percent over year 2000 levels. These estimates indicate that the existing gap between the numberof San Francisco Bay Area jobs and employees needed to fill them will continue to widen. Thisdisparity will dramatically affect the region’s transportation network as the projected number of incommutersto the San Francisco Bay Area grows. As a result, interregional vehicle miles traveled willincrease, congestion will increase, and average roadway speeds will decline.MONTEREY BAY AREA OVERVIEWThe California Department of Finance’s population forecasts and MTC’s staff estimates of employmentand employed residents confirm the fact that neighboring counties to the San Francisco BayArea have a surplus of workers. MTC expects the Monterey Bay counties—San Benito, Monterey,and Santa Cruz—to fill approximately 35 percent of the San Francisco Bay Area worker shortfall by2030 (approximately 77,000 workers: San Benito–18,661, Monterey–15,407, Santa Cruz–43,204).Housing availability and affordability also have a direct impact on the long-distance commute market.In a 2004 document titled Projections Silicon Valley: 2005, the Silicon Valley Manufacturing Groupnotes that although the number of available jobs in Silicon Valley has declined since the year 2000,there are still more available jobs than housing in the area. This report projects that for every 100households, this area will provide 141 jobs by 2005. This ratio is predicted to increase to 1.51 by theyear 2010.Home prices in the San Francisco Bay Area are rapidly climbing. Table 2-1 details the median priceof houses in selected cities from 1998 to 2004, and Table 2-2 indicates the percentage of SanFrancisco Bay Area residents that could afford to purchase a median-priced home in their area inJune 2004.parsons CHAPTER 2: EXISTING AND FORECAST CONDITIONS 17
CALTRAIN EXTENSION TO MONTEREY COUNTYALTERNATIVES ANALYSISTable 2-1Fourth Quarter Median House PricesCounty/City 2004 2002 2001 2000 1999 19981998–2004% IncreaseMonterey CountySalinas $465,000 $325,000 $295,000 $285,000 $222,750 $187,750 147.67%Marina NA* $364,000 $317,500 $299,000 $246,000 $200,250 81.8%*Seaside $568,500 $347,500 $313,000 $258,750 $198,000 $175,000 224.86%San Benito CountyHollister NA* $360,000 $332,500 $329,000 $254,000 $222,000 62.2%*Santa Cruz CountyWatsonville $504,500 $347,727 $315,000 $298,000 $229,000 $187,250 169.43%Santa Cruz $627,500 $490,000 $471,000 $450,000 $330,500 $273,000 129.85%Santa Clara CountyGilroy $559,000 $440,000 $388,500 $450,000 $327,500 $290,000 92.76%Morgan Hill $614,000 $517,500 $440,000 $543,750 $423,750 $334,000 83.83%San Jose $508,000 $444,500 $415,000 $435,000 $339,000 $282,000 80.14%Santa Clara $535,000 $462,500 $417,500 $460,000 $355,000 $299,750 78.48%Mountain View $575,500 $468,750 $496,500 $565,000 $435,000 $350,000 64.43%Milpitas $505,000 $429,500 $400,000 $404,500 $338,000 $269,250 87.56%Cupertino $753,250 $677,000 $635,000 $745,000 $559,000 $497,500 51.41%Los Gatos $899,000 $695,000 $695,000 $699,000 $533,000 $515,750 74.31%San Mateo CountyMenlo Park $750,000 $625,000 $710,000 $735,750 $620,000 $477,500 57.07%Redwood City $645,000 $555,000 $520,000 $598,000 $440,000 $370,000 74.32%Alameda CountyFremont $525,000 $439,500 $389,000 $432,000 $325,000 $270,000 94.44%Union City $492,000 $442,000 $371,250 $460,000 $351,250 $320,000 53.75%Hayward $429,750 $355,000 $303,500 $303,000 $235,000 $186,000 131.05%Pleasanton $656,000 $527,500 $449,000 $501,000 $399,750 $353,500 85.57%Livermore $510,000 $395,000 $350,000 $375,000 $300,000 $250,000 104.00%San Joaquin CountyTracy $420,000 $305,000 $290,000 $260,000 $224,477 $193,250 117.34%Manteca $328,000 $245,000 $239,000 $180,000 $169,000 $145,000 126.21%Stockton $272,500 $180,000 $155,500 $123,000 $112,500 $105,250 158.91%Stanislaus CountyModesto $260,000 $185,000 $156,000 $135,228 $118,000 $105,000 147.62%Source: California Association of Realtors645188AA-003*2004 data unavailable for Marina and Hollister. Percentage change 1998–2002 shown.Table 2-2Percent of San Francisco Bay Area Residents Qualifying for Home Ownership (June 2004)RegionQualifying HouseholdsSanta Clara 21%San Francisco Bay Area 14%San Francisco 10%Monterey Region 11%Source: California Association of Realtors, June 2004645188AA-004parsons CHAPTER 2: EXISTING AND FORECAST CONDITIONS 18
CALTRAIN EXTENSION TO MONTEREY COUNTYALTERNATIVES ANALYSISThese numbers indicate that Silicon Valley workers can better afford houses in neighboring MontereyBay counties than in Santa Clara County and that these same Silicon Valley workers can better affordthese houses than local Monterey County residents.Monterey County’s Regional <strong>Transportation</strong> Plan (RTP) (2005) states that “Almost half of new homespurchased in Salinas are bought by people that work in Silicon Valley, placing further demands on thetransportation network. It is anticipated that in the near future, more and more workers will be willingto tolerate a one and a half to two hour commute to work in order to own a home.”Therefore, the number of commuters traveling from Monterey County and its neighbors to jobs inSanta Clara County and beyond is increasing significantly. Table 2-3 reflects the number of MontereyCounty residents commuting to Santa Clara County and elsewhere, indicating that Monterey Countyresidents bound for Santa Clara County increased more than 140 percent between 1990 and 2000.At the same time, the number of people who lived in Monterey County and also worked theredeclined.Table 2-3 also provides similar information for Santa Cruz County. The project would directly servethe City of Watsonville, which comprised 17 percent of Santa Cruz County’s population as of 2000.By 2030, Watsonville’s population is expected to increase by nearly 60 percent compared with year2000 levels, and the city will be home to 23 percent of the county’s population.Although the historical pattern of commuter growth from Monterey County to Silicon Valley slowedduring 2002 and 2003 due to the downturn in the region’s technology-based economy, it is expectedto resume in the near future. MTC estimates that by 2030, approximately 15,000 commuters willtravel daily from Monterey County to Santa Clara, San Mateo, Alameda and San Francisco counties,an increase of 113 percent over 2000. Insofar as Santa Cruz County, MTC estimates that 41,600commuters will travel from this county to the same four Bay Area counties, an increase of 62 percentover 2000.Table 2-3Monterey County and Santa Cruz County Commuting Trends (1990 and 2000)Commuting 1990 2000 Percent ChangeMonterey CountyTotal Population 355,660 401,762 +13.0Work in Monterey County 162,079 159,157 –1.8Live and work in Monterey County 151,520 146,444 –3.4Live elsewhere and work in Monterey County 10,559 12,713 +20.4Percent workforce commuting into Monterey County 7% 8% +14.3Live in Monterey County and work elsewhere 12,750 18,073 +41.7Santa Cruz County 6,821 7,601 +11.4Santa Clara County 2,411 5,799 +140.5San Benito County 601 1,187 +97.5San Luis Obispo County 329 540 +64.1Alameda County 246 533 +116.7San Mateo County 173 378 +118.5Fresno County 113 254 +124.8San Francisco County 120 220 +83.3Contra Costa County 83 155 +86.7Los Angeles County 295 134 –54.6Yuma County, Arizona 222 112 –49.5Outside U.S. 262 105 –59.9San Diego County 85 101 +18.8Other locations 989 954 –3.5parsons CHAPTER 2: EXISTING AND FORECAST CONDITIONS 19
CALTRAIN EXTENSION TO MONTEREY COUNTYALTERNATIVES ANALYSISCommuting 1990 2000 Percent ChangeSanta Cruz CountyTotal Population 229,734 255,602 +11.3Work in Santa Cruz County 102,674 107,407 +4.6Live and work in Santa Cruz County 89,628 93,084 +3.9Live elsewhere and work in Santa Cruz County 13,046 14,323 +9.8Percent workforce commuting into Santa Cruz County 13% 13% –Live in Santa Cruz County and work elsewhere 25,571 33,022 +29.1Santa Clara County 17,693 21,540 +21.7Monterey County 3,650 5,164 +41.5San Mateo County 1,373 2,010 +46.4Alameda County 712 1,419 +99.3San Benito County 322 622 +93.2San Francisco County 470 621 +32.1Contra Costa County 263 244 –7.2Marin County 53 194 +266.0Sonoma County 7 142 +1,928.6Los Angeles County 197 109 –44.7Outside U.S. 65 88 +35.4San Joaquin County 32 62 +93.8Santa Barbara County 6 57 +850.0Other locations 728 750 +3.0Source: U.S. Census645188AA-005If traveling by automobile, these commuters will increase traffic volumes on U.S. 101, which is projectedto operate at unstable levels of service (LOS) barring capacity improvements or a significantmode shift. As reported in the following section of this document, the <strong>Transportation</strong> Concept Reportfor Route 101 (2001) projects 2020 peak-hour operating conditions will degrade to LOS E and F fromsouth Salinas to the San Benito/Santa Clara County line. The proposed Caltrain extension providesan alternative to roadway travel in this corridor and mitigates the impact of increasing volumes ofcommuters on the highway network.Moreover, it is likely that a second group of potential Caltrain commuters—unskilled workers who donot own automobiles—could also access employment opportunities in Santa Clara County iftransportation was available to them. Additional rail service will also increase access to extensiveSanta Clara County health care services for Monterey County residents.The Monterey County RTP (2005) includes the extension of commuter rail to Salinas in its list ofplanned passenger rail service:“The proposed extension of Caltrain to Salinas would provide an alternative means of travelbetween the Monterey County and the San Francisco Bay Area counties, allowing travelers toavoid traffic congestion along Highways 156 and 101. In addition, the commuter rail extensionwill bring a significant increase in ridership to both the existing Caltrain and the connectingCapitol and Altamont services. Other benefits of this new service are an increase in job opportunities,more transportation alternatives for senior citizens and those with physical disabilities,access to health care in the Bay Area, and economic development around the stations.”The Santa Cruz County Regional <strong>Transportation</strong> Commission RTP (2005) includes a fundingcontribution for the design of the Pajaro <strong>Rail</strong> Station and right-of-way purchase from the Union Pacificparsons CHAPTER 2: EXISTING AND FORECAST CONDITIONS 20
CALTRAIN EXTENSION TO MONTEREY COUNTYALTERNATIVES ANALYSIS<strong>Rail</strong>road for the Santa Cruz Branch rail line. The Commission is currently considering an amendmentto the RTP to add additional funding for the design and construction of the Pajaro Valley rail station.As further evidence of Santa Cruz County support for the extension of commuter rail service, theSanta Cruz County <strong>Transportation</strong> Funding Task Force voted on March 13, 2007 to include $10million for construction of the Pajaro Valley station in the sales tax expenditure plan that will beplaced on the 2008 primary or general election voter ballot.U.S. 101U.S. 101 is the primary highway that serves commuters traveling by automobile between MontereyBay and Gilroy, Santa Clara County, and the San Francisco Bay Area. The <strong>Transportation</strong> ConceptReport for U.S. Route 101 in Caltrans District 5 (October 2001) characterizes U.S. 101:“US Route 101 (Route 101) is the major and historic thoroughfare through the Central Coastareas of California and the principal inter-city connection for numerous communities betweenLos Angeles and San Francisco. The route closely follows El Camino Real of the California’sSpanish Colonial period.”“…The multiple uses of Route 101, the mixture of interregional, regional and local traffic, andthe beauty and environmental sensitivity of the areas through which it courses, in combinationwith projected population growth and new development all present challenges to transportationplanners at every level of government…”“…The District 5 portion of the Route 101 corridor accommodates interregional, regional and urbantraffic and the widest array of trip purposes. Common personal mobility purposes relatedto business, government, recreation, tourism, and daily living, including the journey-to-work,account for a high percentage of trips. The corridor also accommodates goods movementrelated to commerce and manufacturing. Certain segments of the highway experience heavyuse by trucks moving unprocessed agricultural products and livestock. Other segments accommodatenational defense-related traffic, including the movement of troops, equipment, andhazardous materials. The route and corridor purposes entail accommodating this array of corridorusers with a facility that operates in a safe, efficient, and (as much as practicable)environmentally benign manner…”“…The high traffic volumes, strategic location, and environmental setting of Route 101 have resultedin numerous special designations by federal and state governments and their agencies.These designations and classifications provide information regarding the facility itself and itsintended use. They also indicate the availability of special purpose funding related to thedesignation.“The federal functional classification of Route 101 is Principal Arterial. This classification recognizestrip lengths and travel densities that are indicative of substantial statewide and interstatetravel as Route 101 passes through rural areas and delivers trips to and from urban areas.“Route 101 is also part of the National Highway System (NHS) identified in the federal<strong>Transportation</strong> Equity Act for the 21st Century (TEA-21). The NHS is comprised of the InterstateSystem and other urban and rural principal arterials that are essential for interstate andregional commerce and travel, national defense, intermodal transfer facilities, and trade…”“…The federal Department of Defense in cooperation with the Department of <strong>Transportation</strong>has also identified Route 101 as a Strategic Highway Corridor Network (STRAHNET) route.STRAHNET is a network of linked highways deemed essential to national defense for facilitatingthe movement of troops and equipment to airports, ports, rail lines and military bases.parsons CHAPTER 2: EXISTING AND FORECAST CONDITIONS 21
CALTRAIN EXTENSION TO MONTEREY COUNTYALTERNATIVES ANALYSIS“The State of California has granted important designations to Route 101. First, the route is onthe Freeway and Expressway System (F&E) whose completion has been declared essential tothe future development of the State, with provision for control of access to the extentnecessary to preserve the value and utility of the facilities.“In addition, Route 101 is on the Interregional Road System (IRRS) and is a designated FocusRoute in the Caltrans Interregional <strong>Transportation</strong> Strategic Plan (ITSP)…”“…The importance of Route 101 for the movement of goods through the State and nation isindicated by additional federal and state designations. The Route is a designated route on theNational Truck Network under the federal Surface <strong>Transportation</strong> Assistance Act (STAA). Thisnetwork is designated for use by larger trucks. Route 101 is also a State Highway Extra LegalLoad (SHELL) Route.“Finally, extensive portions of Route 101 in District 5 are eligible for designation as Scenic Highwaysunder the State Scenic Highway Program….[including] from the Prunedale junction withRoute 156 west in Monterey County to the junction with Route 156 east in San Benito County.”In the <strong>Transportation</strong> Concept Report, Caltrans divides U.S. 101 from Salinas to San Benito Countyinto segments 8 through 12. Within Monterey County, the agency identifies two specific locationswhere interregional traffic flow is impeded: segments 8 and 10 in Salinas and Prunedale,respectively. Segment 8 suffers from a low existing peak-hour level of service (LOS E) as a result ofcommuter-related traffic. In segment 10, at-grade crossings, lane-crossing left turns, and theintersection with State Route 156 (SR 156) hamper traffic operations. These locations are discussedin greater detail below, as described in Caltrans’ <strong>Transportation</strong> Concept Report for U.S. Route 101 inCaltrans District 5 (2001). Figure 2-1 summarizes the existing (1998) traffic conditions from the<strong>Transportation</strong> Concept Report. Estimated 2005 traffic volumes have been included on the graphicfor information.Existing U.S. 101 Conditions and Traffic VolumesU.S. 101’s Segment 8 runs between the north and south city limits of Salinas. It is a four-lane freewaythat serves local, interregional, and commuter traffic. Truck traffic comprises approximately 18 percentof this total due to Salinas’ position in the Salinas Valley as the agricultural and food processingcenter. The 1998 average annual daily traffic count (AADT) for segment 8 was 53,000 and theestimated peak hour volume was 3,150. In 1998, segment 8 operated at an average LOS D duringthe peak-hour and LOS C during the non-peak-hour.Segment 9 runs from the northern city limits of Salinas to the southern portion of Prunedale. It is afour-lane facility, with some portions designated as a freeway and other portions designated as an expressway.Truck traffic comprises approximately 18 percent of the traffic in this segment. The 1998average AADT on segment 9 was 54,300 and the estimated peak-hour volume was 3,312. In 1998,segment 9 operated at an average LOS E during the peak-hour and LOS C during the non-peakhour.Segment 10 runs from the south end of Prunedale to the north end and is designated as a four-laneurban expressway along the entire length. Truck traffic comprises approximately 15 percent of trafficalong this segment. The 1998 average AADT was 55,400 with an estimated peak-hour volume of3,987. In 1998, segment 10 operated at an average LOS F during the peak-hour and LOS C duringthe non-peak-hour.parsons CHAPTER 2: EXISTING AND FORECAST CONDITIONS 22
CALTRAIN EXTENSION TO MONTEREY COUNTYALTERNATIVES ANALYSISFigure 2-1Existing Traffic Volumes on U.S. 101645188AA-006parsons CHAPTER 2: EXISTING AND FORECAST CONDITIONS 23
CALTRAIN EXTENSION TO MONTEREY COUNTYALTERNATIVES ANALYSISSegment 11 extends from the north end of Prunedale to the San Benito County line and is designatedas a four-lane expressway along its entire length. Truck traffic comprises approximately 16 percent oftraffic along this segment. The average 1998 AADT was 50,700 and the estimated peak-hour volumewas 3,197. In 1998, segment 11 operated at an average LOS E during the peak-hour and LOS Cduring the non-peak-hour.Segment 12A in San Benito County extends from the Monterey/San Benito County line to theintersection of U.S. 101 and SR 156. This segment is classified as a four-lane expressway for the first1.8 miles; it then becomes a four-lane freeway. Truck traffic accounts for approximately 15 percent ofthe traffic volume in this segment. The 1998 AADT on segment 12A was 53,000 with an estimatedpeak-hour volume of 3,816. In 1998, segment 12A operated at an average LOS F during the peakhourand LOS D during the non-peak-hour.Segment 12B runs from the intersection of SR 156 to the intersection of State Route 129 (SR 129).Approximately 16 percent of traffic on this segment is truck traffic. This entire segment is classified asa four-lane freeway with a 1998 AADT of 43,500. The estimated peak-hour volume is 3,080. In 1998,segment 12B operated at an average LOS D during the peak-hour and LOS C during the non-peakhour.Segment 12C runs from the intersection of SR 129 to the Santa Clara County line. It is classified as afour-lane freeway along its entire length. Truck traffic accounts for approximately 16 percent of trafficalong this segment. The 1998 AADT was 46,700 and the estimated peak-hour volume was 3,279. In1998, segment 12A operated at an average LOS E during the peak-hour and LOS C during the nonpeak-hour.Traffic ProjectionsThe Association of Monterey Bay Area Governments (AMBAG) projects that Monterey County willexperience a population increase of 30 percent between 2000 and 2020 (2001 Revised PopulationForecast, AMBAG). This level of growth is significantly less than forecast by the California StateDepartment of Finance (Interim County Population Projections, June 2001). According to AMBAG'sforecasts, much of this growth will take place along the U.S. 101 Corridor, with traffic volumesincreasing concurrently. Figure 2-2 displays traffic projections along U.S. 101 for the year 2020,including projected AADT, peak-hour level of service, and off-peak level of service.Segment 8 (southern Salinas to northern Salinas) is projected to have an AADT of 68,500 in the year2020 and to operate at LOS E during the peak-hour and LOS C during the non-peak hour.These levels of service have been deemed by Caltrans to be inadequate for traffic operations alongthis segment. Caltrans projects that commuter traffic will become heavier as the population of Salinasgrows and the number of jobs in Silicon Valley increases:“As the population of Salinas and the surrounding area grows in the next 20 years, congestion onRoute 101 is expected to increase. A recently approved project will reconstruct the Airport Boulevardinterchange at the south urban boundary of the City of Salinas and facilitate the flow of truckand commuter traffic entering and exiting the freeway near the packing plants in the area. Toimprove traffic flow through the rest of the segment, however, Caltrans expects Route 101 in thisarea will need to be widened to six lanes.”Segment 9 (northern Salinas to southern Prunedale) is projected to have an AADT of 72,800 by2020, and to operate at LOS F during the peak-hour and LOS D during the non-peak hour. Caltransanticipates that these levels of service will fail to adequately accommodate projected traffic volumes.parsons CHAPTER 2: EXISTING AND FORECAST CONDITIONS 24
CALTRAIN EXTENSION TO MONTEREY COUNTYALTERNATIVES ANALYSISFigure 2-2Projected Traffic Volumes on U.S. 101 (2020)645188AA-007parsons CHAPTER 2: EXISTING AND FORECAST CONDITIONS 25
CALTRAIN EXTENSION TO MONTEREY COUNTYALTERNATIVES ANALYSISOn Segment 10 (southern Prunedale to northern Prunedale), the AADT is projected to be 75,400,and to operate at LOS F during the peak-hour and LOS D during the non-peak hour. Future level-ofserviceprojections for this segment take into account capacity-increasing improvements, which arecurrently under consideration, but are still considered inadequate to accommodate the heavy local,regional, and interregional traffic volumes projected for the area.“…other traffic operations issues in Prunedale include uncontrolled access to the roadway, lengthystacking for left turns, and frequent congestion at the Routes 101/156 West interchange. A numberof projects are underway to address these concerns. These projects include reconstruction of theRoute 101/156 West interchange and construction of a new interchange at San Miguel Road.Furthermore, a project has been programmed and an EIR/EIS [Environmental ImpactReport/Environmental Impact Statement] is being prepared that considers construction of a bypassand improvements to the existing alignment to improve traffic flow in the Prunedale area.”All of the abovementioned projects are in progress or have been completed:• Phase 1 reconstruction of the U.S. 101/SR 156 interchange is complete• San Miguel interchange was completed in early 2003• The Prunedale Improvement project environmental review is complete• U.S. 101 Bypass project is under environmental review.Segment 11 (northern Prunedale to the San Benito County line) is projected to have a 2020 AADT of71,500, operating at LOS F during the peak-hour and LOS D during the non-peak-hour. Improvementsplanned by Caltrans, but subject to available funding, include a new interchange at San JuanRoad to address congestion.Segment 12A (San Benito County line to SR 156) is projected to have a 2020 AADT of 77,700,operating at LOS F during the peak-hour and LOS E during the non-peak hour. Caltrans does notconsider these operational levels to be adequate for projected traffic.Segment 12B (SR 156 to SR 129) is projected to have a 2020 AADT of 63,700, operating at LOS Fduring the peak-hour and LOS D during the non-peak-hour. Caltrans does not consider theseoperational levels to be adequate for projected traffic.Segment 12C (SR 129 to the Santa Clara County line) is projected to have a 2020 AADT of 73,000,operating at LOS F during the peak-hour and LOS E during the non-peak-hour. Caltrans does notconsider these operational levels to be adequate for projected traffic.Improvements under consideration for U.S. 101 between Salinas and Santa Clara County include theexpansion of the four-lane segment immediately north of Prunedale to eight lanes of freeway/conventional highway capacity. No funding is currently programmed for improvements to U.S. 101between post mile Monterey 98 and post mile San Benito 3 (at the junction of SR 156 East). Givenexisting and forecasted traffic volumes along this corridor, it is likely that congestion at this point willincrease even if adjacent segments are expanded.Caltrans recommends that demand be reduced on U.S. 101 in Monterey and San Benito counties byencouraging and improving alternative modes of travel such as passenger rail and by enhancingintermodal facilities and services to improve interconnectivity. The proposed Caltrain extension andthree station facilities will address the projected deficiencies in the regional network by providing acontinuous transportation link between the communities of Monterey County and the job markets ofSanta Clara County and its neighbors. Such a link will also postpone the need to widen U.S. 101 byproviding an alternative mode to accommodate commuter demand.parsons CHAPTER 2: EXISTING AND FORECAST CONDITIONS 26
CALTRAIN EXTENSION TO MONTEREY COUNTYALTERNATIVES ANALYSISCOMMUTING TRENDSThe historical pattern of commuter growth from Monterey County and elsewhere to Silicon Valleyslowed following 2000 due to the downtown in the region’s technology-based economy. To gauge theimpact of this slowdown on regional traffic patterns, 24-hour and peak period traffic counts were compiledfor gateways leading to/from Santa Clara County and the San Francisco Bay Area. Figure 2-3illustrates the locations for which traffic count trend data was available and examined for this study.Figure 2-4 illustrates the year-by-year trend of AM peak period (3-hour, 6 AM to 9 AM) entering SantaClara County and/or the San Francisco Bay Area along gateway highways, i.e., U.S. 101 and I-580.By and large, the traffic volume trends are generally flat over time, indicating that the technologysector recession has not had a pronounced impact on the volume of commuters living in outlyingcounties who commute to the Bay Area. Additional evidence of these commuting trends is discussedin the Regional <strong>Rail</strong> section of Existing Conditions.SANTA CLARA COUNTY TRAFFIC CONDITIONSThe Caltrain <strong>Extension</strong> Alternative ridership forecasts documented in Chapter 4 indicate that 90 percentof the riders boarding trains in Monterey County will be destined to stations in Santa ClaraCounty. Of these, more than two-thirds will be destined to “north county” stations in Sunnyvale, MountainView and Palo Alto; and one-third will be destined to downtown San Jose and Santa Clara. Theremaining 10 percent are forecast to ride to stations located in San Mateo and San Franciscocounties.Monterey County and Santa Cruz County (Watsonville) commuters destined to job locations in SantaClara County (“Silicon Valley”) currently experience traffic congestion along U.S. 101 in Monterey andSan Benito counties (as described above), and along U.S. 101, I-280, SR 85, and a myriad of localstreets and expressways in Santa Clara County.Within Santa Clara County, the Santa Clara Valley <strong>Transportation</strong> Authority (VTA) monitors highwaysystem performance through its “Congestion Management Program.” The following data is taken fromVTA’s 2005 Monitoring and Conformance Report, dated April 2006.VTA monitors approximately 152 miles of freeway. Including two travel directions for each freeway,there are about 304 directional miles. About 155 directional miles of the freeway system containhigh-occupancy vehicle (HOV) lanes.VTA’s Traffic Level of Service <strong>Analysis</strong> Guidelines, dated June 2003, adopted density as theparameter for freeway LOS analysis in Santa Clara County. The density values for LOS A/B, B/Cand C/D thresholds are based on values from the Highway Capacity Manual (HCM) 2000. TheLOS D/E and E/F thresholds are based on Santa Clara County conditions.Table 2-4 compares the VTA and HCM 2000 LOS density value thresholds. By VTA’s standards, LOSD, E and F are worse than (more congested) HCM 2000 criteria.Based on VTA’s LOS thresholds, a total of 61 directional freeway miles operated at LOS F duringboth the AM and PM peak hours during 2005. The duration of congestion lasted from one to threehours.parsons CHAPTER 2: EXISTING AND FORECAST CONDITIONS 27
CALTRAIN EXTENSION TO MONTEREY COUNTYALTERNATIVES ANALYSISFigure 2-3Traffic Count Trend Data Locations645188AA-008parsons CHAPTER 2: EXISTING AND FORECAST CONDITIONS 28
CALTRAIN EXTENSION TO MONTEREY COUNTYALTERNATIVES ANALYSISFigure 2-4AM Peak Period Traffic Year-by-Year Trends645188AA-009Table 2-4Level of Service Criteria for Freeway Basic SegmentsDensity Range (pc/mi/ln)LOS Description HCM 2000 VTAA Describes free flow operations. Free flow speeds prevail 0–11 0–11B Represents reasonably free flow, and free flow speeds are maintained >11–18 >11–18C Provides for flow with speeds at or near the free flow speed of the freeway >18–26 >18–26D Describes the level at which speeds begin to decline slightly with increasing flows and >26–35 26–46density begins to increase somewhat more quicklyE At this level’s highest density value, it describes operation is at capacity of the freeway >35–45 >46–58F Describes breakdown in vehicular flow and queues forming behind the breakdown points >45 >58645188AA-093parsons CHAPTER 2: EXISTING AND FORECAST CONDITIONS 29
CALTRAIN EXTENSION TO MONTEREY COUNTYALTERNATIVES ANALYSISFigures 2-5 and 2-6 illustrate the overall operation of Santa Clara County’s freeway system in 2005.This assessment is based on VTA’s LOS density thresholds, which are worse than HCM 2000 forLOS D, E, and F. Figure 2-7 shows only those freeway segments which operate at LOS F in eitherthe AM or PM peak hour. All of these graphics indicate that most or all of the freeway routes used byMonterey County resident commuters are heavily congested as of 2005 1 .Insofar as future traffic conditions, VTA anticipates that congestion will worsen even with an investmentof some $766 million in highway improvements by Year 2030. VTA’s Valley <strong>Transportation</strong> Plan2030, adopted February 2005, indicates that Santa Clara County population is expected to grow by27 percent and jobs by 37 percent over Year 2000 levels. Over the same time period, vehicle trips willincrease by 39 percent during the morning peak hour and 36 percent during the afternoon peak hour.As freeway capacity will grow by only 5.6 percent, substantial increases in travel time for somecommute trips is expected.As part of its congestion monitoring effort, VTA collects travel time information for representativecommute origin–destination (O–D) pairs. One of these O–D pairs surveys travel times between aresidential area of Morgan Hill, 10 miles north of Gilroy, to a location in Santa Clara near U.S. 101and Montague Expressway (see Figure 2-8).Table 2-5 reports the observed travel times between these pairs for the period from 1997 to 2005,plus the estimated travel time in 2030 based on forecasted traffic growth and freeway performance.Compared with current (2005) conditions, VTA forecasts that travel time will increase by 48 percentduring the AM peak hour(s) and 154 percent during the PM peak hour(s) for single occupant vehicles.REGIONAL RAILPassenger rail service is currently being increased and expanded throughout northern California toaddress longer-distance commuting needs and support the region’s growing economy. Figure 2-9illustrates the existing and proposed regional (non-urban) passenger rail network, which includesAmtrak’s Capitol service to Sacramento, the Altamont <strong>Commuter</strong> Express service to Stockton, andthe Caltrain commuter rail service between San Francisco and Gilroy. The regional highway networkis also illustrated for reference.Caltrain ServiceCaltrain is a commuter rail system that has linked San Francisco Bay Area peninsula communitieswith one another for more than 130 years. Until July 1980, the Southern Pacific <strong>Transportation</strong>Company owned and operated the commuter rail service for profit. <strong>Commuter</strong> rail ridership peakedduring World War II at around 32,000 passengers per day and declined thereafter to a low of 14,000riders in 1977 as Southern Pacific petitioned the California Public Utilities Commission to discontinueservice.After substantial negotiation, the State of California (through Caltrans) entered into a purchase-ofserviceagreement with Southern Pacific in July 1980. The purpose of this agreement was to continueand improve commuter rail service between San Jose and San Francisco. This agreement continueduntil July 1992, at which time the administration and operation of Caltrain was transferred from theState of California to the Peninsula Corridor Joint Powers Board (JPB)—a three-member agencycomprising the City and County of San Francisco, the San Mateo County Transit District, and VTA.By that time, ridership had recovered and stabilized at approximately 21,000 passengers per day.1Complete level of service, density, speed and volume information for all freeway segments are provided in VTA’s 2005 Monitoring andConformance Report, dated April 2006.parsons CHAPTER 2: EXISTING AND FORECAST CONDITIONS 30
CALTRAIN EXTENSION TO MONTEREY COUNTYALTERNATIVES ANALYSISFigure 2-52005 Freeway Level of Service in the AM Peak Period645188AA-090parsons CHAPTER 2: EXISTING AND FORECAST CONDITIONS 31
CALTRAIN EXTENSION TO MONTEREY COUNTYALTERNATIVES ANALYSISFigure 2-62005 Freeway Level of Service in the PM Peak Period645188AA-091parsons CHAPTER 2: EXISTING AND FORECAST CONDITIONS 32
CALTRAIN EXTENSION TO MONTEREY COUNTYALTERNATIVES ANALYSISFigure 2-72005 Freeway Level of Service F in the AM and PM Peak Periods645188AA-092parsons CHAPTER 2: EXISTING AND FORECAST CONDITIONS 33
CALTRAIN EXTENSION TO MONTEREY COUNTYALTERNATIVES ANALYSISFigure 2-8Origin-Destination Pair (Morgan Hill to Santa Clara)645188AA-094O–D PairRoute2a Intersection of Dunne and U.S. 101 > U.S. 101 > SR 85 >SR 87 > U.S. 101 > Montague > intersection of Montagueand De La Cruz2b Intersection of Dunne and U.S. 101 > U.S. 101 > Montague >intersection of Montague and De La CruzTransitAMCaltrain from Morgan Hill Caltrain Station to Santa ClaraTransit Center > transfer to VTA Bus Route 44 to intersectionof Montague and FirstTable 2-5Origin-Destination Pair Travel Times (minutes of travel from Morgan Hill to Santa Clara),1997–2005 plus 20301997 1998 2000 2001 2002 2004 2005 2030AM—NorthboundSOV 51 67 70 48 51 50 50 74HOV ND 52 58 41 43 39 36 55Transit ND ND 76 64 77 68 80 79PM—SouthboundSOV 41 61 58 57 56 48 41 104HOV ND 51 56 47 49 42 35 53Transit ND ND 83 88 91 48 68 77Source: Valley <strong>Transportation</strong> Authority645188AA-095parsons CHAPTER 2: EXISTING AND FORECAST CONDITIONS 34
CALTRAIN EXTENSION TO MONTEREY COUNTYALTERNATIVES ANALYSISFigure 2-9Existing and Proposed Regional Passenger <strong>Rail</strong> Network645188AA-010parsons CHAPTER 2: EXISTING AND FORECAST CONDITIONS 35
CALTRAIN EXTENSION TO MONTEREY COUNTYALTERNATIVES ANALYSISThe JPB has operated the Caltrain service via a contract with the National <strong>Rail</strong>road PassengerCorporation, commonly known as Amtrak, since 1992. Service frequencies have been increased andservice was extended to Gilroy. Ridership has increased to near-World War II peak levels with acount of 35,609 passengers recorded in February 2001. The JPB is committed to further service improvementsand has developed a 20-year strategic plan to guide its initiatives. The proposed serviceextension to Salinas is intended to complement and support JPB’s vision for upgrading Caltrainduring the 21st century.Caltrain rail service currently spans 77 miles and includes 30 stations in San Francisco, San Mateo,and Santa Clara counties. The Gilroy station represents both the end of the line for current railservice and the stepping-off point for further travel south utilizing connecting bus services and privatevehicles. Passengers wishing to continue their travel to Monterey County and Santa Cruz County(Watsonville) currently must do so via private automobile.The proposed Caltrain extension to Salinas would utilize a 38-mile portion of Union Pacific <strong>Rail</strong>road’s(UPRR) Coast main line track running between San Jose and Los Angeles. This track is owned andmaintained by UPRR. In general, the track is in good condition and is reputed to have a good ridequality.Ridership PatternsTable 2-6 lists Caltrain weekday passenger boardings by station, with year-by-year detail provided for1992 through 2006. The table shows that boardings at the Gilroy station grew by 408 percentbetween 1992 and 2001, more than at any other station. Total Caltrain boardings grew 81 percentduring this 10-year period.During 2002 through 2005, boardings at almost every station declined as overall Caltrain ridershipfell. (Stations served by "Baby Bullet" trains, i.e., Diridon, Mountain View, Palo Alto, Hillsdale,Millbrae, experienced increased ridership.) This diminished ridership can be attributed to theconcurrent regional economic downturn and is therefore projected to be short-lived. Table 2-4indicates that 2006 ridership has recovered to 2000 levels, in part due to increased service. JPB nowoperates 96 weekday trains between San Jose Diridon Station and downtown San Francisco.While overall Caltrain ridership declined from 2001 to 2005 and has since recovered to Year 2000levels, ridership boarding at stations in southern Santa Clara County has continued to lose ridership.Figure 2-10 illustrates the sharp rise and fall of the number of passengers boarding at the fivesouthernmost stations, i.e., Capitol to Gilroy. The reasons for this ridership decline are well known, asfollows.1. Overall Caltrain ridership declined from 2000 to 2005 in direct proportion to total industryemployment in Santa Clara, San Mateo and San Francisco counties.2. Caltrain ridership boarding at south Santa Clara County stations declined from 2000 to 2003in slightly greater than direct proportion to total industry employment in Santa Clara County.3. U.S. 101 was widened from four lanes to eight lanes between Morgan Hill and South SanJose for a distance of 11 miles. The widening alleviated northbound AM and southbound PMcongestion and slow speeds on U.S. 101. The project was completed in June 2003 andresulted in the 33 percent loss of Caltrain ridership boarding at south county stations between2003 and 2004.parsons CHAPTER 2: EXISTING AND FORECAST CONDITIONS 36
CALTRAIN EXTENSION TO MONTEREY COUNTYALTERNATIVES ANALYSISTable 2-6Caltrain Weekday Passenger BoardingsStation Oct ‘92 Apr ‘93 Mar ‘94 Feb ‘95 Mar ‘96 Feb ‘97 Feb ‘98 Feb ‘99 Feb ‘00 Feb ‘01 Feb ‘02 Feb ‘03 Feb ‘04 Feb '05 Feb ‘06San Francisco 6,280 5,680 5,795 5,303 5,536 6,126 6,302 5,898 6,602 6,807 6,180 5,846 5,065 5,910 7,15522nd Street 208 206 242 235 297 397 517 510 574 673 524 456 382 545 797Paul Avenue 52 50 35 37 37 17 20 6 11 10 25 9 6 1 —Bayshore 169 215 194 170 241 316 402 403 458 513 463 403 344 247 166South San Francisco 418 421 397 392 398 521 509 517 549 621 597 510 472 487 521San Bruno 454 500 529 529 578 650 694 704 723 844 762 659 505 488 412Millbrae 501 550 558 549 543 618 698 655 782 870 776 657 1,148 1,507 1,816Broadway 336 377 378 392 377 430 464 423 495 567 492 433 333 205 —Burlingame 546 581 566 618 638 674 686 755 842 985 884 726 645 604 588San Mateo 589 623 648 633 719 845 905 957 1,105 1,389 1,302 1,084 1,004 1,062 1,009Hayward Park 211 210 203 198 216 299 275 320 381 607 565 447 417 347 244Bay Meadows 127 129 70 2 134 180 167 154 62 67 70 57 65 71 10Hillsdale 920 917 918 961 1,038 1,156 1,193 1,163 1,278 1,318 1,193 1,065 1,080 1,487 1,815Belmont 554 519 566 529 554 506 548 590 648 892 770 629 568 518 435San Carlos 620 638 703 749 716 835 878 865 1,028 1,216 987 848 816 836 867Redwood City 764 725 807 778 874 1,142 1,286 1,331 1,597 1,804 1,597 1,356 1,360 1,423 1,870Atherton 299 275 243 240 230 250 206 225 266 260 246 198 182 122 —Menlo Park 859 815 796 863 847 1,017 1,133 1,104 1,174 1,321 1,194 1,034 1,055 1,009 1,171Palo Alto 1,020 991 1,075 1,162 1,242 1,610 1,706 1,693 1,960 2,249 2,016 1,880 1,849 2,425 3,054Stanford 0 0 3 0 0 0 18 14 12 11 0 0 — — —California Avenue 881 929 922 974 950 1,125 1,163 1,211 1,280 1,376 1,225 1,026 976 839 822San Antonio 0 0 0 0 0 0 0 0 550 841 694 644 697 610 488Mountain View 962 887 980 1,023 1,162 1,369 1,477 1,478 1,640 2,200 1,854 1,644 1,519 2,423 2,764Sunnyvale 814 816 872 828 1,001 1,204 1,214 1,230 1,363 1,427 1,222 1,020 1,149 970 1,342Lawrence 601 522 575 558 687 822 965 981 1,124 1,309 956 773 593 534 514Santa Clara 558 587 570 579 554 770 809 863 1,031 1,124 991 853 798 706 657College Park 161 132 169 150 154 167 197 178 206 185 180 184 192 133 97San Jose Diridon 1,352 1,317 1,118 1,092 1,197 1,486 1,616 1,492 1,454 1,747 1,421 1,244 1,183 1,906 2,270Tamien 287 332 359 382 468 492 531 526 676 821 634 520 480 343 466Capitol — — 25 33 39 54 76 63 95 121 82 67 56 57 29Blossom Hill 52 54 85 84 91 128 148 119 161 177 136 130 101 99 77Morgan Hill 138 88 124 128 151 195 318 297 387 437 340 276 194 191 151San Martin — 46 51 63 51 95 170 175 200 252 164 158 91 78 72Gilroy 112 90 143 198 182 300 394 420 468 569 421 357 225 210 141TOTAL 20,845 20,222 20,719 20,432 21,902 25,796 27,685 27,320 31,182 37,810 30,963 27,193 27,069 28,393 31,820Source: Caltrans and Peninsula Corridor Joint Powers Board645188AA-011parsons CHAPTER 2: EXISTING AND FORECAST CONDITIONS 37
CALTRAIN EXTENSION TO MONTEREY COUNTYALTERNATIVES ANALYSISFigure 2-10Caltrain Weekday Passenger Boardings for South Santa Clara County130012001100Morgan HillSan MartinGilroyTotal1000900Passenger Boardings80070060050040030020010001992 1993 1994 1995 1996 1997 1998 1999 2000 2001 2002 2003 2004 2005 2006YearData Source: Caltrans and Peninsula Corridor Joint Powers Board645188AA-012parsons CHAPTER 2: EXISTING AND FORECAST CONDITIONS 38
CALTRAIN EXTENSION TO MONTEREY COUNTYALTERNATIVES ANALYSIS4. Caltrain service to south Santa Clara County stations was reduced in August 2005 from fourweekday round trips to three weekday round trips. In addition, the schedule of one of theremaining trains (each direction) was revised to eliminate (skip) one-half of the station stops innorthern Santa Clara County. For south Santa Clara County residents, Caltrain service waseffectively reduced by one-third. South Santa Clara County ridership fell by 26 percentfollowing the service reduction.The VTA is committed to restoring and expanding Caltrain service to south Santa Clara County residents.The need for this service expansion is discussed below and in Chapter 3 under the No BuildAlternative.Prior to this rise and fall of south Santa Clara County ridership, TAMC conducted a survey of Caltrainpatrons boarding at the Gilroy station in November 1999. The survey found that 17 percent of theriders live in Monterey County and 4 percent live in Santa Cruz County. This place-of-residence informationis remarkable given the relatively short access distances that typify park-and-ride lot use.Access distances of five miles or less, the immediate market shed of Gilroy, typically account for 60percent of park-and-ride lot uses. Corresponding capture rates for 10, 15, and 20 miles of access distancehave been measured as 80, 90, and 94 percent, respectively, according to a report titled TravelerResponse to <strong>Transportation</strong> System Changes (1981) published by Barton-Aschman Associates,Inc. The end-of-the-line nature of the Gilroy station undoubtedly contributes to its large market area.It is likely that current Caltrain use by San Benito County, Monterey County, and Watsonvilleresidents actually understates the market for service extensions by a wide margin, as the number ofcommuters who choose to drive 20 to 30 miles to a Caltrain park-and-ride lot and change modes for a30- to 40-mile train trip is limited.Future Demand for Caltrain ServiceIn July 2004, the Peninsula Corridor Joint Powers Board adopted a 20-year Strategic Plan for Caltraincovering the 2004 to 2023 implementation horizon. This Strategic Plan set forth a vision for Caltrainencompassing four service scenarios: (1) the status quo, (2) moderate growth, (3) enhanced, and (4)build-out scenarios. On November 30, 2006, JPB issued a companion report, entitled Project 2025.Project 2025 was undertaken to identify specific capital improvements and actions needed toimplement the strategic vision.Underlying Project 2025 is market research indicating strong potential demand for increased Caltrainservice. Within the three counties currently served by Caltrain (San Francisco, San Mateo, and SantaClara), JPB foresees the following based on the Association of Bay Area Governments (ABAG) demographicprojections and Metropolitan <strong>Transportation</strong> Commission (MTC) travel demand forecasts.• The three peninsula counties are expected to grow in population by 16 percent over the next20 years. Santa Clara County population will increase at a faster rate (18.5 percent) than itspartners. As illustrated in Figure 2-11, there will be more than 500,000 additional peopleresiding in the three counties between 2005 and 2025.• Employed residents are expected to increase by 37 percent, adding nearly 500,000 employedresidents. The rate of growth is more than twice the rate of total population growth between2005 and 2025. This increase in employed residents means that the three counties will have37 percent more commuters over the next 20 years, with Santa Clara County ahead of SanMateo and San Francisco counties.parsons CHAPTER 2: EXISTING AND FORECAST CONDITIONS 39
CALTRAIN EXTENSION TO MONTEREY COUNTYALTERNATIVES ANALYSISFigure 2-11Population Growth (1980–2025)Figure 2-12Employed Resident Growth (1980–2025)• Jobs located within the three counties are expected to increase by 37 percent, which isequivalent to 678,830 additional jobs by 2025. Santa Clara will have 345,250 additional jobscompared to 200,300 for San Francisco and 133,280 for San Mateo County.Figure 2-13 shows a comparison between job growth and employed residents growth over thenext 20 years. Each county is expecting to have more new jobs than employed residentsrequiring greater importation of its labor force. All three counties will need to rely on workersfrom other Bay Area and outlying counties, which will place greater demand on regional railservice. (These data do not include forecasts for Monterey, Santa Cruz, and San Benitocounties.)parsons CHAPTER 2: EXISTING AND FORECAST CONDITIONS 40
CALTRAIN EXTENSION TO MONTEREY COUNTYALTERNATIVES ANALYSISFigure 2-13Comparison of Growth in Employed Residents vs. Jobs, 2025• Santa Clara County’s intra-commute growth is expected to be equal to its job growth rate (38percent) over the next 20 years. San Francisco intra-commute growth (37 percent) will outpaceits job growth (35 percent) as a higher proportion of San Francisco jobs will be filled by SanFrancisco residents. In San Mateo County, the job growth (40 percent) will be higher than theintra-commute growth (35 percent); therefore, the county will need to rely on more workersfrom outside the county.Growth in commuters from Alameda County to San Mateo County (47 percent) and to SantaClara County (37 percent) will be significant. There are more commuters (2.04 million) destinedfor Santa Clara County from all Bay Area origins than the number of San Mateo County andSan Francisco commuters combined and this will continue in 2025.Based on this forecast growth in population, employed residents, employment and travel, JPBforesees a significant demand for increased service.Figure 2-14 illustrates projected peak hour ridership on the Caltrain system assuming 96 daily trainsand 172 daily trains, plus an estimate for latent demand equal to 25 percent above the curve for the172 train scenario. Without major modifications or improvements to the current 96 daily train service,Caltrain ridership would realize a ridership increase of nearly 100 percent based on JPB’s ridershipforecasts.JPB’s plans and options for addressing this anticipated ridership demand are discussed in Chapter 3.parsons CHAPTER 2: EXISTING AND FORECAST CONDITIONS 41
CALTRAIN EXTENSION TO MONTEREY COUNTYALTERNATIVES ANALYSISFigure 2-14Caltrain Ridership Demand through 2025Source: PCJPBAltamont <strong>Commuter</strong> ExpressThe Altamont <strong>Commuter</strong> Express (ACE) is a commuter rail line operating between Stockton and SanJose. Overall, the line, service area and operations are very similar to the Caltrain line operatingbetween San Jose and Gilroy plus the proposed extension of service to Monterey County. ACE isbriefly discussed in this chapter as it serves as a comparison benchmark for Caltrain extensionridership forecasts.Altamont <strong>Commuter</strong> Express trains operate on an 82-mile route between Stockton and San Josethrough the San Joaquin, Central, and Silicon Valleys. ACE trains use a combination of Caltrain andUPRR tracks (including the former Western Pacific line over Altamont Pass), serving 10 stations.ACE commuter service is governed by the Altamont <strong>Commuter</strong> Express Joint Powers Authority,formed in 1997 by Alameda, San Joaquin, and Santa Clara counties to coordinate management andfunding. The service is managed by the Joint Powers Authority member agency San JoaquinRegional <strong>Rail</strong> Commission, and trains are operated under contract by Herzog Transit Services. UPRRowns the tracks.Service began on October 19, 1998. Initial operations consisted of two round trips, with a morningturn-back train between San Jose and Fremont added in February 2000.On March 5, 2001, the turn-back train was dropped and a third round trip was added departingLathrop–Manteca later in the morning and returning in the evening. Concurrent with the Marchschedule change, ACE trains added a stop at Caltrain’s station in Santa Clara.In late evening, passengers can also board an ACE bus from San Jose to Stockton.At the San Jose Diridon station, passengers can connect to Amtrak and Caltrain commuter trains.Local bus operators provide free connections between ACE rail stations and employment sites.parsons CHAPTER 2: EXISTING AND FORECAST CONDITIONS 42
CALTRAIN EXTENSION TO MONTEREY COUNTYALTERNATIVES ANALYSISAs noted below, ACE now operates four round-trip trains per day. Station stops are indicated on thefollowing ACE train schedule. One-way travel time between Stockton and San Jose Diridon is 2 hours10 minutes. Within Santa Clara County, only three stops occur.Ridership PatternsAs of March 2006, ACE carried approximately 2,500 riders per day, or approximately 1,250 in eachdirection. Like Caltrain, ACE has seen its ridership increase rapidly during the dot-com boom years,to be followed by declining and then stabilized ridership patterns. Figure 2-15 illustrates the averageweekday daily ridership experienced by ACE from its inception in 1998 through March 2006. Since2003, ridership has been relatively stable at ±2,500 riders per day.AM - WESTBOUNDStockton To San Jose(Read Down)#01 #03 #05 #07Stockton 4:20 AM 5:35 AM 6:40 AM 9:30 AMLathrop/Manteca 4:38 AM 5:53 AM 6:58 AM 9:48 AMTracy 4:52 AM 6:07 AM 7:12 AM 10:02 AMVasco 5:22 AM 6:37 AM 7:42 AM 10:32 AMLivermore 5:27 AM 6:42 AM 7:47 AM 10:37 AMPleasanton 5:35 AM 6:50 AM 7:55 AM 10:45 AMFremont 5:57 AM 7:12 AM 8:17 AM 11:07 AMGreat America L6:16 AM L7:31 AM L8:36 AM 11:26 AMSanta Clara suspended suspended suspended suspendedSan Jose 6:30 AM 7:50 AM 8:50 AM 11:40 AMPM - EASTBOUNDSan Jose To Stockton(Read From Bottom Up)#02 #04 #06 #08Stockton 2:15 PM 5:45 PM 6:45 PM 7:45 PMLathrop/Manteca 1:53 PM L5:23 PM L6:23 PM 7:23 PMTracy 1:39 PM L5:09 PM L6:09 PM L7:09 PMVasco 1:09 PM 4:39 PM 5:39 PM 6:39 PMLivermore 1:04 PM 4:34 PM 5:34 PM 6:34 PMPleasanton 12:56 PM 4:26 PM 5:26 PM 6:26 PMFremont 12:34 PM 4:04 PM 5:04 PM 6:04 PMGreat America 12:16 PM 3:46 PM 4:46 PM 5:46 PMSanta Clara suspended suspended suspended suspendedSan Jose 12:05 PM 3:35 PM 4:35 PM 5:35 PML = Train may leave ahead of schedule after discharging passengersparsons CHAPTER 2: EXISTING AND FORECAST CONDITIONS 43
CALTRAIN EXTENSION TO MONTEREY COUNTYALTERNATIVES ANALYSISFigure 2-15Altamont <strong>Commuter</strong> Express Average Daily Ridership Trendsparsons CHAPTER 2: EXISTING AND FORECAST CONDITIONS 44
CALTRAIN EXTENSION TO MONTEREY COUNTYALTERNATIVES ANALYSISTable 2-7Altamont <strong>Commuter</strong> Express Rider Boarding PatternsStationAMWestbound4/4/2000 7/25/2001 4/24/2006PMEastboundAMWestboundPMEastboundAMWestboundPMEastboundStockton 7% — 9% — 14% —Lathrop 18 — 28 — 31 —Tracy 19 — 23 — 25 —Vasco 9 — 7 2 6 2Livermore 10 1 8 1 7 1Pleasanton 29 3 16 6 13 17Fremont 8 8 9 8 5 18Great America — 72 — 52 — 52Santa Clara — — — 17 — —San Jose Diridon — 14 — 14 — 10Not returning by ACE — 2 — — — —645188AA-014ACE Expansion PlansACE recently expanded its commuter rail service between the San Joaquin Valley and the SantaClara Valley. Beginning on Monday, August 28, 2006, a fourth train was added which departsStockton Monday through Friday at 9:30 a.m. making all stops en route to San Jose and arrivingthere at 11:40 a.m. Returning, this new train departs San Jose at 12:05 p.m. and arrives back inStockton at 2:15 p.m.Funding for this new service comes in part from Caltrans to help absorb congestion from motor trafficon I-205 during a 3-year construction project to widen that facility. Funding also comes from Amtrakwhose passengers connecting to and from the San Joaquin trains #711 and #716 will be carried onthis new train.ACE believes that the added convenience of this additional service will enable their customers to getto work later when necessary, or return home sooner for important appointments. It will allow newcustomers the opportunity to make shopping trips to Pleasanton or San Jose, or spend the day at amuseum or Paramount’s Great America.The San Joaquin Regional <strong>Rail</strong> Commission originally established a requirement that ACE ridershipreach 85 percent capacity prior to initiating the fourth train. Ridership is currently at 65 percent ofavailable capacity and an additional daily 500 passengers eacy way are needed to reach the 85percent of capacity threshold. However, a unique opportunity presented itself for a partnershipbetween ACE, Caltrans District 10, and the San Joaquin Intercity <strong>Rail</strong> Service for the initiation fo thefourth train much earlier than anticipated.In this collaborative effort, it became apparent that a midday (fourth) ACE train might satisfy severalpurposes:parsons CHAPTER 2: EXISTING AND FORECAST CONDITIONS 45
CALTRAIN EXTENSION TO MONTEREY COUNTYALTERNATIVES ANALYSIS• Providing a midday train for ACE riders who need a half-day work trip, or need to get home forvarious appointments (medical/dental, parent-teacher conferences, children’s sports events,family activities, etc.) and for special group destinations that are more conducive to a half-daytrip.• Providing a morning/midday/evening alternative to Interstate 205 during the constructionwidening project scheduled to begin in late Spring 2006. Motorists would be advised of theACE train alternative via advertising efforts and the changeable message signs throughout theconstruction zone.• Providing a “train-to-train” connection to the San Joaquin Intercity <strong>Rail</strong> Service, as asubstitution for the current bus between Stockton and San Jose, allowing broader connectivityand marketing activities. (ACE and Caltrans currently share the costs of a midday bus alongthe ACE route between Stockton and San Jose.)In the event that the new time slot does not provide the benefits to the highway constructionmitigation program or is not well-utilized by the Amtrak San Joaquin Intercity <strong>Rail</strong> Service passengersor the ACE one-half day commuters, the <strong>Rail</strong> Commission will consider moving the train to a peakcommuter slot.Beyond this recent expansion, the Regional <strong>Rail</strong> Commission is keenly aware of the need to expandthe existing ACE service and to improve the quality of service to ACE’s passengers. To this end, theCommission is undertaking a study to identify:1. A short term (i.e., 1–5 years) action plan to improve and increase ACE service betweenStockton and San Jose.2. A longer term (i.e., 6–10 years) action plan to improve and increase ACE service betweenStockton and San Jose.3. An action plan detailing the steps that will need to be taken to improve the ACE–BARTconnection at Pleasanton.Results of this study are currently being discussed at the public meetings being held in four corridorcities. Short term and long term proposals include the following:• Completing train signal improvements• Adding train dispatching staff• Creating a dedicated UPRR maintenance gang for the ACE corridor• Repairing slides in the Altamont pass• Making drainage improvements in Niles Canyon• Making improvements at the BNSF crossing• Increasing speed in curves (unbalanced superelevation)• Developing a dedicated corridor for ACE service• Constructing tunnels in the Altamont Pass and Niles Canyon• Constructing a flyover at the BNSF tracking crossingThese proposed improvements demonstrate the commitment of the San Joaquin Regional <strong>Rail</strong>Commission to upgrading ACE service and the importance of commuter rail service within the overallBay Area and surrounding county regional network of mobility options.parsons CHAPTER 2: EXISTING AND FORECAST CONDITIONS 46
CALTRAIN EXTENSION TO MONTEREY COUNTYALTERNATIVES ANALYSISCHAPTER 3: DETAILED DEFINITION OF ALTERNATIVESChapter 1 of this document summarized the alternative definition and shortlisting process followed bythe Monterey County Fixed Guideway [<strong>Alternatives</strong> <strong>Analysis</strong>] Study.As a result of public involvement, city input, and The <strong>Transportation</strong> Agency for Monterey County(TAMC) policy review, four alternatives emerged for further refinement and testing. These fouralternatives, labeled A through D, are listed below and are summarized in Table 3-1.A. Local Monterey Peninsula bus rapid transit service and Caltrain commuter rail service fromSan Francisco to Salinas.B. Local Monterey Peninsula bus rapid transit service with future transition to light rail service;direct intercity rail service from the City of Monterey to San Francisco; and Caltrain commuterrail service from San Francisco to Salinas.C. Local Monterey Peninsula light rail service and Caltrain commuter rail service from SanFrancisco to Salinas.D. <strong>Transportation</strong> Systems Management (TSM) enhanced local bus service and express busservice between Monterey County and Santa Clara, San Mateo and San Francisco counties.Common to all Build <strong>Alternatives</strong> (A, B and C) is the extension of Caltrain service to MontereyCounty. This commonality reflects the conscious decision on the part of the TAMC <strong>Rail</strong> PolicyCommittee to exclude from further consideration any Build Alternative which did not include theextension of Caltrain service from Gilroy to Salinas.This commitment to the Caltrain extension is further reflected by the TAMC Board policy.The Final 2005 Monterey County Regional <strong>Transportation</strong> Plan (RTP) identifies the Caltraincommuterrail extension to Salinas as part of its planned new passenger rail services. The RTPstates, "TAMC plans to extend the existing Caltrain commuter rail service (between San Franciscoand Gilroy) south to Salinas. The extension will include three new station stops: Pajaro, Castroville,and Salinas. At its inception, the service would consist of two round trips per day running from Salinasto San Francisco and will be increased to four or more round trips as demand warrants, probablywithin 10 years from start of service."The purpose of this chapter is to define the Caltrain <strong>Extension</strong> (Build) Alternative and Express Bus(TSM) Alternative, along with the No Build Alternative.DEFINITION OF THE NO BUILD ALTERNATIVEThe purpose of the Caltrain extension to Monterey County is to provide an alternative means ofcommuter travel between Monterey County and southern Santa Cruz County to the San FranciscoBay Area. The Caltrain extension is expected to lower congestion/increase capacity in the U.S. 101Corridor and provide increased access to job opportunities and educational resources within SiliconValley and along the San Francisco Peninsula. It will additionally provide transportation alternativesfor senior citizens and those with physical disabilities.Addressing transportation needs in the U.S. 101 Corridor is TAMC’s top regional priority.parsons CHAPTER 3: DETAILED DEFINITION OF ALTERNATIVES 47
CALTRAIN EXTENSION TO MONTEREY COUNTYALTERNATIVES ANALYSISTable 3-1Description of Monterey County Fixed Guideway Study <strong>Alternatives</strong> Shortlisted for DetailedDefinition and Evaluation<strong>Alternatives</strong> Service Features Equipment OptionsCostEstimatesA. Local MontereyPeninsula busrapid transitserviceMonterey Branch Line:Local bus rapid transit service (phases)• Monterey to Marina• Marina to Castroville• Marina to Salinas on surface roadsMain Line:Caltrain rail service to Salinas• Intercity service transfer at Castroville orSalinasMonterey Branch Line:Bus rapid transit options• Articulated buses• Diesel or natural gas powered buses• Hybrid diesel electric vehicles• Trolley carsMain Line: FRA-compliant• Caltrain vehicles• Amtrak Superliner• Diesel multiple unit (DMU): Colorado<strong>Rail</strong>car$193 millionB. Local MontereyPeninsula busrapid transitservice with futuretransition to lightrail transit serviceand direct intercityrail service fromMonterey to SanFranciscoMonterey Branch Line:Phase 1: Bus Rapid Transit Option A• Monterey to Marina plus intercity railservice—Monterey to San FranciscoPhase 2: Light <strong>Rail</strong> Transit Option C• Monterey to Castroville plus intercity railservice—Monterey to San FranciscoMain Line:Caltrain rail service to SalinasMonterey Branch Line:Vehicle options would be identical tobus rapid transit and light rail optionsand also include Colorado rail car ornew technology for direct intercityserviceMain Line: FRA-compliant• Caltrain vehicles• Amtrak Superliner• DMU: Colorado <strong>Rail</strong>car$305 millionC. Local MontereyPeninsula light railtransit serviceMonterey Branch Line:Local light rail (phases)• Monterey to Marina• Marina to Castroville• Castroville to SalinasMain Line:Caltrain rail service to Salinas• Intercity transfer at CastrovilleDirect intercity rail service from Monterey toSan Francisco (future phase)Monterey Branch Line:Light rail options• Hybrid diesel electric vehicles• Conventional diesel units• Lighter, smaller, streetcar-like, dieselmultiple unitsMain Line: FRA-compliant• Caltrain vehicles• Amtrak Superliner• DMU: Colorado <strong>Rail</strong>car$230 millionD. <strong>Transportation</strong>SystemsManagement(TSM)Enhanced local bus service provided by MSTExpress bus service between Monterey CountyTransit Centers to existing Caltrain stations in:• Santa Clara County• San Mateo County• San Francisco CountyBus Service:• Diesel or natural gas poweredvehicles• 40-foot coaches• Articulated buses$1,234 million(includesplanned highwayimprovements)645188AA-023U.S. 101 through north Monterey County is a rural four-lane highway with left turn channelization atmost intersections. U.S. 101 through the Prunedale area is congested as a result of considerabletruck, inter-city and inter-county traffic. At-grade intersections and driveways, and the lack of frontageroads for local traffic also impact the roadway’s safety and efficiency.Caltrans and TAMC have identified level of service (LOS) deficiencies on U.S. 101 through thePrunedale Corridor. TAMC determined that Year 2000 LOS on this facility was F, and projected thatthis facility would continue to operate at LOS F in 2025. High volumes and numerous at-gradeintersections with limited sight distance have made left turns to or from the expressway dangerousparsons CHAPTER 3: DETAILED DEFINITION OF ALTERNATIVES 48
CALTRAIN EXTENSION TO MONTEREY COUNTYALTERNATIVES ANALYSISand difficult. With the exception of the Boronda Road/State Route 156/U.S. 101 interchange, andrecently completed San Miguel Canyon Road interchanges, all intersections on these segments ofU.S. 101 are at-grade.The Caltrans final draft 2002 <strong>Transportation</strong> Concept Report recommends either widening theexisting U.S. 101 to six lanes or providing equivalent capacity in a bypass of Prunedale.Improvements to U.S. 101 anticipated for the Caltrain <strong>Extension</strong> to Monterey County “No BuildAlternative” can be divided into two components—a safety and operational component and a capacitycomponent.U.S. 101 Safety and Operational Improvements—the Prunedale Improvement ProjectIn 2002, TAMC agreed to fund safety and operational improvements on the existing U.S. 101 Corridorthrough Prunedale prior to implementation of a separate capacity improvement project (widening orbypass) in the corridor. Safety and operational improvements on the existing U.S. 101 betweenRussell and Espinosa Roads and Crazy Horse Canyon Road/Echo Valley Road on U.S. 101 havebeen labeled the U.S. 101 Prunedale Improvement Project.The Prunedale Improvement Project will construct three new interchanges/overpasses alongU.S. 101 through North Monterey County at Russell Road/Espinosa Road, Blackie Road/ReeseCircle, and Crazy Horse Canyon Road/Echo Valley Road. Additional improvements will also be madeto the San Miguel flyover and to local roads throughout the corridor to improve access and localcirculation.The major suite of improvements is illustrated in Figure 3-1. The project is estimated to cost $259million and is largely funded in the State <strong>Transportation</strong> Improvement Program. Construction is slatedto start in 2009 and be complete by 2012. By itself, the Prunedale Improvement Program will notaddress traffic capacity shortfalls in the U.S. 101 corridor. The Traffic Operational <strong>Analysis</strong> SupplementalReport 1 for the Prunedale Improvement Project indicates that under the No Build Caltrain<strong>Extension</strong> Alternative, U.S. 101 will operate at LOS E and F under 2030 traffic conditions in the AMnorthbound and PM southbound directions, respectively, for most of the length covered by theproject. Northbound AM and southbound PM peak hour demand will exceed capacity by over 30percent.U.S. 101 Capacity Improvements—the U.S. 101 Prunedale FreewayBased on the above defined shortfall, TAMC projects a need for additional capacity on U.S. 101through the Prunedale corridor in addition to the short-term safety and operational improvements tobe constructed on the existing alignment. In 2002, TAMC committed to pursuing the Prunedale Bypassproject, Alternative 4E, to address the existing and projected capacity shortfall on this corridor.The project will replace the existing U.S. 101 facility with a new bypass freeway to the east ofPrunedale, with interchanges at Espinosa Road/Russell Road and Crazy Horse Canyon Road/EchoValley Road. This project is estimated to cost approximately $420 million to design and construct.1Caltrans District 6, June 2004.parsons CHAPTER 3: DETAILED DEFINITION OF ALTERNATIVES 49
CALTRAIN EXTENSION TO MONTEREY COUNTYALTERNATIVES ANALYSISFigure 3-1U.S. 101 Prunedale Improvement Project645188AA-017TAMC only expects completion of the Prunedale Bypass to be possible with the addition of new localfunding sources. New monies in the first 14 years of the plan would be devoted to completing environmentalreview and design of the project. Even with additional funding, TAMC anticipates constructionof this substantial project to be possible only within the outer years (2021–2030) of the 2005Regional <strong>Transportation</strong> Plan.State Route 156 WideningIntersecting U.S. 101 at the midpoint of the Prunedale Improvement Project is State Route (SR) 156.SR 156 is a two-lane highway serving as an east–west connector from U.S. 101 to SR 1 and theMonterey Peninsula. SR 156 becomes a four-lane highway for less than 2 miles along the southernparsons CHAPTER 3: DETAILED DEFINITION OF ALTERNATIVES 50
CALTRAIN EXTENSION TO MONTEREY COUNTYALTERNATIVES ANALYSISedge of Castroville where it connects toSR 1. As a connector, it experienceshigh weekday peak period and weekendtraffic volumes, carrying a significantnumber of visitors.This facility carries local and interregionaltruck traffic, agricultural traffic, andcommuter traffic. As such, improvementsto SR 156 are considered to be vital tothe county economy and have beenclassified as a regional priority by TAMC.The segment of SR 156 between Castrovilleand U.S. 101 has also been identifiedas a “focus route” by Caltrans. Thelevel of service along this section of roadis currently an E and is expected to dropto F by the year 2010 if no improvementsare undertaken.645188AA-059The first part of the improvement project would widen the existing conventional two-lane highway to afour-lane expressway between Castroville and the existing U.S. 101 interchange in Prunedale. Thesecond part of the project would construct interchange improvements at U.S. 101 and SR 156 toimprove traffic flow in the area. The estimated cost of these highway improvements is $248 million.Currently, the project is undergoing environmental review. Due to funding constraints, the project isnot assumed to be constructed until 2020 or later, but is assumed for the 2030 No Build Alternative.MST Public <strong>Transportation</strong> PlansMonterey–Salinas Transit (MST) serves a 275-square-mile area of Monterey County and southernSanta Cruz County. MST’s 33 routes serve an estimated 352,000 population based on the areawithin ¾-mile of established routes within the county.MST’s routes provide service primarily in the Monterey Peninsula jurisdictions and in the SalinasValley. Intercity service is provided via Highway 68 and SR 1 between these two urban areas ofMonterey County. In addition, intercity routes connect MST with the Santa Cruz Metropolitan TransitDistrict at their Transit Center in Watsonville.In fiscal year (FY) 2005, MST operated 3,116,583 vehicle miles of service and carried 4,738,112 onits fleet of 78 buses and 6 trolleys. Its farebox recovery ratio was 27.7 percent and its FY 2006operating budget is $19.6 million.Due to uncertain funding, MST prepares a Business Plan and Short Range Transit Plan every otheryear. Its current plan, covering FY 2006 through FY 2008 was adopted as modified in October 2005.These plans set forth a conservative expansion strategy given anticipated capital and operatingfunding shortfalls of $100 million over the five-year transit plan horizon. Funding is needed to expandand improve service, expand and improve its bus fleet, and to construct new transit centers and anoperations and maintenance facility.If the TAMC-sponsored sales tax initiative had passed on June 6, 2006, MST intended to increaseservice on high demand routes and initiate service on a number of new routes. While the sales taxparsons CHAPTER 3: DETAILED DEFINITION OF ALTERNATIVES 51
CALTRAIN EXTENSION TO MONTEREY COUNTYALTERNATIVES ANALYSISinitiative did not pass 2 , MST initiated a new intercity route between Monterey and San Jose on August28, 2006. Line 55 consists of three round trips each day, 365 days a year. One round trip occurs themorning commute period, departing downtown Monterey at 5:15 AM with a scheduled arrival at theSan Jose Diridon Caltrain station at 7:28 AM. A midday trip departs Monterey at 9:50 AM, arrives atSan Jose by 12:03 PM and returns, leaving San Jose at 1:35 PM. The afternoon commute period tripdeparts San Jose Diridon at 5:53 PM and is scheduled to arrive in downtown Monterey at 7:53 PM.This service makes intermediate stops in Seaside/Sand City, Prunedale, Gilroy and Morgan Hill.Fares are $8 for the full Monterey to San Jose trip. This new route is the only public transportationbetween Monterey County and San Jose over and above the existing Amtrak Coast Starlight trainand Thruway bus service, and Greyhound intercity bus service; both operating between Salinas andSan Jose. Amtrak operates six round trips between Salinas and San Jose daily with a round trip fareof $32.00. None of the trips operate within the commute window, save one southbound trip leavingSan Jose (Diridon Station) at 3:25 PM. Greyhound operates five round trips per day between Salinasand San Jose. These make intermediate stops and offer a $23.00 round trip fare. Two northboundtrips, leaving Salinas at 5:15 AM and 7:50 AM, operate within the commute journey to work window.Beyond these options, Monterey County commuters will need to drive to the Caltrain station at Gilroyand park-and-ride from that point northward.Caltrain <strong>Commuter</strong> <strong>Rail</strong> ServiceCaltrain currently operates three round trip trains between Gilroy and San Francisco on weekdays.Prior to August 2005, four Caltrain round trips to Gilroy were offered. The Santa Clara Valley <strong>Transportation</strong>Authority (VTA) is the lead agency for Caltrain operations and program development betweenSan Jose and Gilroy. As part of its Long-term Transit Capital Investment Program, VTA hasnegotiated an agreement with Union Pacific <strong>Rail</strong>road (UPRR) which grants VTA/JPB (Peninsula CorridorJoint Powers Board) rights to operate up to 20 trains (10 round trips) between Gilroy and SanJose upon completion of $35 million of capacity improvements. These improvements include constructionof 8.5 miles of double track (addition of a second track) between San Jose and Gilroy onUPRR property. VTA also plans to construct a Gilroy yard facility to accommodate storage of 10commuter rail train sets.Exhibit 1, shown on the following page, presents the prototypical schedule developed for the 10roundtrip train negotiations between VTA and UPRR. The exhibit indicates a start year that isdependent on ridership levels and VTA funding availability. For the No Build Alternative, at least fourround trips trains are assumed to be in operation by 2010. For the 2030 planning horizon, ten roundtrip trains per weekday are assumed.DEFINITION OF THE CALTRAIN EXTENSION ALTERNATIVEInstitutional FrameworkPeninsula Corridor Joint Powers BoardCaltrain is governed by a Joint Powers Agreement between San Francisco, San Mateo and SantaClara counties, which established the Peninsula Corridor Joint Powers Board. San Mateo CountyTransit (SamTrans) is the managing partner and is responsible for operations and planning for thesystem. The trackage, stations and most parking areas, from Tamien Station in San Jose to San2Ballot Measure A required a two-thirds majority. The Yes vote received 57.13 percent of the votes cast.parsons CHAPTER 3: DETAILED DEFINITION OF ALTERNATIVES 52
CALTRAIN EXTENSION TO MONTEREY COUNTYALTERNATIVES ANALYSISExhibit 1<strong>Commuter</strong> Service between San Jose and Gilroy—Depart TimesSouthboundSchedule ServiceStart Train Diridon Train # Tamien Train # Gilroy Priority Description(Year) Schedule (pm)2008 8 4:01 258 4:08 258 5:15 L Provide added service, limit impact to UP by running close to existing window2007 7 4:23 new 4:30 new 5:15 L Provide added service, limit impact to UP by running close to existing window1 4:45 160 4:51 160 5:362006 6 5:06 262 5:12 262 5:57 M Provide added service within existing commute window limiting impact to UPRR2004 5 5:28 new 5:35 new 6:20 H Provide added service within existing commute window as agreed with UPRR2 5:51 164 5:57 164 6:423 6:16 270 6:22 270 7:074 6:49 172 6:56 172 7:412009 9 7:16 278 7:23 278 8:08 L Provide added service, limit impact to UP by running close to existing window2010 10 8:01 284 8:08 284 8:53 L Provide added service, limit impact to UP by running close to existing windowNorthboundTrain Gilroy Train # Tamien Train # DiridonSchedule (am)2010 10 4:49 215 5:32 215 5:39 L Provide added service, limit impact to UP by running close to existing window1 5:16 121 5:58 121 6:062006 6 5:39 new 6:22 new 6:29 M Provide added service within existing commute window limiting impact to UPRR2 6:02 227 6:44 227 6:522004 5 6:25 new 7:08 new 7:15 H Provide added service within existing commute window as agreed with UPRR3 6:45 231 7:27 231 7:374 7:02 235 7:44 235 7:522007 7 7:25 new 8:08 new 8:15 M Provide added service, limit impact to UP by running close to existing window2008 8 7:49 239 8:31 239 8:39 L Provide added service, limit impact to UP by running close to existing window2009 9 8:16 new 8:59 141 9:06 M Provide added service, limit impact to UP by running close to existing windowNote: No weekend commute serviceLEGENDblack type existing servicered type proposed serviceH = High Priority (keep schedule close to proposed times)M= Medium Priority (keep in general area of proposed schedule)L= Low Priority (adjust schedule as needed for efficient operation)Oct-04645188AA-058parsons CHAPTER 3: DETAILED DEFINITION OF ALTERNATIVES 53
CALTRAIN EXTENSION TO MONTEREY COUNTYALTERNATIVES ANALYSISFrancisco is owned by the JPB with UPRR and other commuter operations (Altamont <strong>Commuter</strong>Express, Capitol Corridor, Amtrak Coast Route) operating under trackage rights agreements. Southof Tamien to Gilroy, the track is owned by UPRR with Caltrain operating under trackage rightspurchased from UPRR.Caltrain operating funds come from the three county transit agencies with the percentage determinedby the proportion of morning peak hour boardings in each county. Capital funds for system-wide improvements(track improvements, signals, station platforms, American with Disabilities Act improvements)are funded equally by the three partners with federal and state participation. Certain stationimprovements and expansion projects are negotiated between the partners based on the specifics ofeach project. All capital improvements south of Tamien are funded exclusively by the VTA. Theseinclude capital improvements necessary for riders and improvements mandated by UPRR as well aspurchase of track slots.The <strong>Transportation</strong> Agency for Monterey CountyTAMC is a 23-member agency which consists of local officials from each of its 12 incorporated citiesand five county supervisorial districts, and ex-officio members from six public agencies. TAMC isMonterey County’s designated Regional <strong>Transportation</strong> Planning Agency, Congestion ManagementAgency, Local <strong>Transportation</strong> Commission, and Service Authority for Freeways and Expressways.TAMC was created by Government Code Section 67930-67931 to provide regional transportationplanning and development for Monterey County. TAMC’s powers include eminent domain and thepower to preserve, acquire, construct or improve: rights-of-way for rail purposes; rail terminals andstations; rolling stock, including locomotives, passenger cars, and rail related equipment and facilities;grade separation and other improvements along rail rights-of-way for rail purposes; rail maintenancefacilities; and other capital facilities deemed necessary for rail service, including soundwalls. CodeSection 67931(c) additionally specifies that TAMC may contract for the operation of rail service inMonterey County and for connections with rail service in adjacent and neighboring counties andcities.Caltrain Strategic Plan 2004–2023 Implementation FrameworkThe Caltrain Strategic Plan was adopted by the JPB in July 2004. The Strategic Plan is a blueprint forthe future of Caltrain and covers four future service delivery scenarios: the status quo, moderategrowth, enhanced, and build-out scenarios.The extension of service to Monterey County (Monterey/Salinas <strong>Extension</strong>) is included in two futureservice delivery scenarios—enhanced and build-out. It is categorized as a “Regional <strong>Extension</strong> (ThirdParty Project).” Three additional regional extensions are included in the Strategic Plan. These aredowntown San Francisco, Dumbarton, and California High-Speed <strong>Rail</strong>. Of these, the San Franciscoand Dumbarton extensions are included in the enhanced and build-out scenarios. The CaliforniaHigh-Speed <strong>Rail</strong> project is included in the build-out scenario only.Actions taken by JPB and third parties indicate that Caltrain service enhancements are moving alongthe enhanced service delivery scenario. Evidence of this includes project development for theextensions of service to downtown San Francisco and through the Dumbarton Corridor, which areprogressing along parallel tracks to that of the Monterey/Salinas <strong>Extension</strong>. The number of totalweekday trains is already 96 as of 2006, approaching the upper limit specified for the moderategrowth scenario (100 trains by Year 2023). In addition, 22 “Baby Bullet” express trains are inoperation, surpassing the upper limit of moderate growth by the 2023 service scenario. The Caltrain<strong>Extension</strong> Alternative is constructed around the enhanced service scenario.parsons CHAPTER 3: DETAILED DEFINITION OF ALTERNATIVES 54
CALTRAIN EXTENSION TO MONTEREY COUNTYALTERNATIVES ANALYSISTAMC Regional <strong>Transportation</strong> Plan Implementation FrameworkThe RTP includes the Caltrain <strong>Extension</strong> elements in its constrained funding plan. This service isbased on the <strong>Extension</strong> of Caltrain <strong>Commuter</strong> Service to Monterey County Business Plan prepared inAugust 2000, and the Caltrain <strong>Extension</strong> to Monterey County Project Study Report dated February21, 2006. A Caltrain <strong>Extension</strong> to Monterey County Passenger <strong>Rail</strong> Stations Draft EnvironmentalImpact Report dated April 26, 2006 is currently being circulated for public review. A NationalEnvironmental Policy Act Environmental Assessment is also being finalized. TAMC intends toconstruct a commuter rail station in Pajaro and a commuter rail station in Castroville; renovate andexpand an existing passenger rail station in Salinas; and construct a layover facility for Caltraintrainsets in Salinas. TAMC also anticipates funding track, switch and signal improvements betweenSalinas and Gilroy in conjunction with UPRR. Initiation of service is targeted for late 2009/early 2010.Caltrain Project 2025The JPB has prepared a strategy for implementing the vision outlined in the Caltrain Strategic Plan.Dated November 30, 2006, the Project 2025 report identifies capital investments needed to supportfuture service expansions. Elements of this program are listed in Exhibit 2 along with capital costestimates. Three scenarios are listed in the table reflecting vehicle technology options. Total capitalcosts range from $2.076 billion to $3.041 billion, expressed in Year 2006 dollars. The Project 2025document does not include a funding plan.Proposed <strong>Extension</strong> of Caltrain Service to SalinasThe JPB currently operates 96 trains per weekday between San Jose (Diridon Station) and San Francisco.Six of these trains (three round trips) additionally operate between San Jose (Diridon Station)and Gilroy on weekdays. Prior to August 1, 2005, JPB operated four round trip trains to/from GilroyJPB has authorization to operate up to five round trip trains to/from Gilroy.As of December 15, 2004, VTA and UPRR concluded negotiations to allow for an increase from theallowed five round trips per day (to/from Gilroy) to 10 round trips. Service will be expanded whentrack improvements between San Jose and Gilroy are completed and when ridership warrants. Thetrack improvements involve 8.5 miles of double tracking, switches, signals, a bridge and gradecrossings.Trains serving Gilroy lay over at a small yard adjacent to the Gilroy Station. Trains layover duringevening hours, during which time they are cleaned and serviced. Up to five trainsets can beaccommodated currently—three in the yard, one on a tail track extension of the station track, and oneon the station track at the platform.Trainsets begin their weekday utilization in Gilroy, traveling to San Francisco. After this initial one-waytrip, trainsets operate between San Francisco and San Jose. Their final trip of the day ends at Gilroywhere the trains layover during the evening.Under the Caltrain <strong>Extension</strong> Alternative, existing Caltrain service to Gilroy would be extended toSalinas. Initially, two round trip trains would be operated on weekdays. As ridership warrants, servicewould be expanded to three round trips. As Caltrain service is restored to Gilroy (four round trips) andeventually expanded, service would be extended to Salinas as demand warrants.parsons CHAPTER 3: DETAILED DEFINITION OF ALTERNATIVES 55
CALTRAIN EXTENSION TO MONTEREY COUNTYALTERNATIVES ANALYSISExhibit 2CaltrainCapitalProgram2006–2025parsons CHAPTER 3: DETAILED DEFINITION OF ALTERNATIVES 56
CALTRAIN EXTENSION TO MONTEREY COUNTYALTERNATIVES ANALYSISTrainsets would layover in Salinas in lieu of Gilroy. A Salinas layover yard would be constructedinitially with capacity for four trainsets. The yard would be designed to be expandable to accommodatesix trainsets.Train Layover and Crew BasingThe Caltrain <strong>Extension</strong> Alternative would construct a layover yard in Salinas with capacity forovernight storage of four trainsets, expandable to six trainsets. This facility, together with existingfacilities at Gilroy, would accommodate up to ten trainsets.Without the Caltrain extension to Monterey County, VTA will need to expand the Gilroy layover facilityto accommodate additional train service to/from Gilroy (beyond four or five round trips per day). ThisVTA investment may be largely or totally avoided via construction of the Salinas layover facility.Facilities at the Salinas yard will be the same as those existing or proposed for upgrade at Gilroy. TheSalinas yard would include a crew basing facility. Locomotive and rolling stock maintenance would beperformed at Caltrain’s centralized equipment maintenance and operations facility located in SanJose.Train ScheduleThe existing Caltrain schedule, effective January 1, 2006, is assumed for the Caltrain <strong>Extension</strong>Alternative’s initial service (two round trip trains each weekday). The 10-train each direction schedule,used for VTA/UPRR negotiations (as of October 4, 2004) of trackage rights and “slot fees” (foradditional train service to Gilroy), is assumed for service expansion planning purposes. (See theexhibit on page 53 and Table 3-2, Caltrain Public Timetable, below.) Specific trains operated to/fromSalinas would be clustered within the existing commute window as agreed with UPRR. Theseschedules are presented in Chapter 6 under Estimation of Capital, Operating and MaintenanceCosts, and Revenue.The JPB Project 2025 report outlines a number of additional, potential service scenarios. These areaddressed below under “Electrification,” “Vehicle Requirements,” and “Core System Improvements/TAMC Participation.”Caltrain <strong>Extension</strong> Service ReliabilityThe operating plan assumptions for the Caltrain <strong>Extension</strong> (Build) Alternative are addressed onpages 153–155 of the Draft <strong>Alternatives</strong> <strong>Analysis</strong> report. A portion of this text is repeated below.Table 3-2 displays an illustrative timetable for 8 round trip trains operating between San Jose andGilroy 3 . For planning purposes, the schedules have been extended south to Salinas to indicatepotential departure/arrival times. This table highlights the extension of three existing “Gilroy” roundtrip trains to/from Salinas. A fourth round trip train is also extended from San Jose to Gilroy andSalinas for planning purposes. These schedules are preliminary and are based on trainsimulation/capacity modeling undertaken for UPRR. Factors which might affect scheduling includeelectrification of the Caltrain line north of San Jose; upgrades to the UPRR coast line track betweenSalinas and Gilroy; Caltrain/Amtrak schedule coordination south of Gilroy; and schedule recovery“padding” to ensure reliability of Caltrain service north of Gilroy.3Schedule based on Caltrain public timetable, effective January 1, 2006.parsons CHAPTER 3: DETAILED DEFINITION OF ALTERNATIVES 57
CALTRAIN EXTENSION TO MONTEREY COUNTYALTERNATIVES ANALYSISTable 3-2Caltrain Public TimetableGilroy/San Jose to San Francisco—NorthboundTrain # 101 103 305 207 309 211 313 215 217 319 221 323 225 227 329 231 233 135Salinas 5:12 5:35 6:10 6:37Castroville 5:22 5:45 6:20 6:47Pajaro 5:36 5:59 6:34 7:01Gilroy 6:07 6:30 7:05 7:32San Martin 6:16 6:39 7:14 7:41Morgan Hill 6:22 6:45 7:20 7:47Blossom Hill 6:35 6:58 7:33 8:00Capitol 6:41 7:04 7:39 8:06Tamien — 4:58 — 5:50 5:56 — — — 6:49 6:56 7:12 — — 7:47 7:56 8:14 8:33 —San Jose Diridon 4:30 5:05 5:45 5:57 6:03 6:22 6:45 6:50 6:57 7:03 7:20 7:45 7:50 7:55 8:03 8:22 8:40 9:10College Park — — — — — — — — — — — — — 7:58 — — — —Santa Clara 4:35 5:10 — 6:02 — 6:27 — — 7:02 — 7:25 — — 8:02 — 8:27 8:45 9:15Lawrence 4:40 5:15 — 6:12 — — — — 7:12 — 7:30 — — 8:12 — — 8:50 9:20Sunnyvale 4:44 5:19 — 6:18 6:13 — — 7:00 7:18 7:13 — — 8:00 8:18 8:13 — 8:54 9:24Mountain View 4:49 5:24 5:57 6:23 — 6:37 6:57 7:05 7:23 — 7:37 7:57 8:05 8:23 — 8:37 8:59 9:29San Antonio 4:53 5:28 — 6:27 — — — — 7:27 — — — — 8:27 — — 9:03 9:33California Avenue 4:57 5:32 — 6:31 — — — 7:11 7:31 — — — 8:11 8:31 — — 9:07 9:37Palo Alto 5:01 5:36 6:05 6:36 6:23 — 7:05 7:16 7:36 7:23 — 8:05 8:16 8:36 8:23 — 9:11 9:41Menlo Park 5:04 5:39 — 6:39 — 6:45 — — 7:39 — 7:45 — — 8:39 — 8:45 9:14 9:44Redwood City 5:09 5:44 — 6:45 6:30 6:51 — — 7:45 7:30 7:51 — — 8:45 8:30 8:51 9:19 9:49San Carlos 5:13 5:48 — — — 6:55 — 7:24 — — 7:55 — 8:24 — — 8:55 9:23 9:53Belmont 5:16 5:51 — — — 6:58 — — — — 7:58 — — — — 8:58 9:26 9:56Hillsdale 5:19 5:54 6:16 6:51 — 7:02 7:16 7:28 7:51 — 8:02 8:16 8:28 8:51 — 9:02 9:29 9:59Hayward Park 5:22 5:57 — — — 7:05 — — — — 8:05 — — — — 9:05 — 10:02San Mateo 5:25 6:00 — — 6:39 7:08 — 7:32 — 7:39 8:08 — 8:32 — 8:39 9:08 9:33 10:05Burlingame 5:28 6:03 — — — 7:11 — 7:35 — — 8:11 — 8:35 — — 9:11 9:36 10:08Millbrae 5:33 6:08 6:24 6:59 6:45 7:17 7:24 — 7:59 7:45 8:17 8:24 — 8:59 8:45 9:17 9:41 10:13San Bruno 5:37 6:12 — — — 7:21 — 7:42 — — 8:21 — 8:42 — — 9:21 9:45 10:17So. San Francisco 5:41 6:16 — 7:05 — 7:25 — — 8:05 — 8:25 — — 9:05 — 9:25 — 10:21Bayshore 5:47 6:22 — — — 7:33 — — — — 8:33 — — — — 9:31 — 10:2722nd Street 5:52 6:27 — — — 7:40 — — — — 8:40 — — — — 9:37 — 10:32San Francisco 6:01 6:36 6:42 7:19 7:02 7:48 7:42 7:57 8:19 8:02 8:48 8:42 8:57 9:19 9:02 9:45 10:02 10:41San Francisco to San Jose/Gilroy—SouthboundTrain # 154 256 158 260 362 264 266 368 270 372 274 276 378 280 382 284 386 288San Francisco 2:07 2:37 3:07 3:37 4:09 4:19 4:27 4:33 4:56 5:14 5:20 5:27 5:33 5:56 6:14 6:27 6:33 6:5622nd Street 2:12 — 3:12 — — — 4:32 — — — — 5:32 — — — 6:32 — —Bayshore 2:17 — 3:17 — — — 4:40 — — — — 5:40 — — — 6:40 — —So. San Francisco 2:23 — 3:23 — — — 4:48 — 5:08 — — 5:48 — 6:08 — 6:48 — 7:08San Bruno 2:27 2:51 3:27 3:51 — 4:33 4:52 — — — 5:34 5:52 — — — 6:52 — —Millbrae 2:31 2:55 3:31 3:55 4:25 — 4:56 4:49 5:14 5:30 — 5:56 5:49 6:14 6:30 6:56 6:49 7:14Burlingame 2:35 2:59 3:35 3:59 — 4:38 5:00 — — — 5:39 6:00 — — — 7:00 — —San Mateo 2:38 3:02 3:38 4:02 — 4:42 5:04 4:57 — — 5:43 6:04 5:57 — — 7:04 6:57 —Hayward Park 2:41 — 3:41 — — — 5:07 — — — — 6:07 — — — 7:07 — —Hillsdale 2:44 3:06 3:44 4:06 4:33 4:47 5:11 — 5:22 5:38 5:48 6:11 — 6:22 6:38 7:11 — 7:22Belmont 2:47 3:09 3:47 4:09 — — 5:14 — — — — 6:14 — — — 7:14 — —San Carlos 2:50 3:12 3:50 4:12 — 4:51 5:18 — — — 5:52 6:18 — — — 7:18 — —Redwood City 2:55 3:17 3:55 4:17 — — 5:22 5:06 5:28 — — 6:22 6:06 6:28 — 7:22 7:06 7:28Menlo Park 3:00 3:22 4:00 4:22 — — 5:28 — 5:34 — — 6:28 — 6:34 — 7:28 — 7:34Palo Alto 3:03 3:25 4:03 4:25 4:44 5:01 — 5:12 5:38 5:49 6:02 — 6:12 6:38 6:49 — 7:12 7:38California Avenue 3:07 3:29 4:07 4:29 — 5:05 — — 5:42 — 6:06 — — 6:42 — — — 7:42San Antonio 3:11 3:33 4:11 4:33 — — — — 5:46 — — — — 6:46 — — — 7:46Mountain View 3:15 3:37 4:15 4:37 4:51 5:11 5:36 — 5:50 5:56 6:12 6:36 — 6:50 6:56 7:36 — 7:50Sunnyvale 3:20 3:42 4:20 4:42 — 5:16 — 5:21 5:55 — 6:17 6:21 6:55 — — 7:21 7:55Lawrence 3:24 3:46 4:24 4:46 — — — — 6:01 — — 6:43 — 7:01 — — — 7:59Santa Clara 3:29 3:51 4:29 4:51 — — 5:47 — 6:08 — — 6:48 — 7:08 — 7:47 — 8:04College Park — — 4:32 — — — — — — — — — — — — — — —San Jose Diridon 3:38 4:00 4:39 5:00 5:06 5:27 5:55 5:32 6:16 6:11 6:28 6:56 6:32 7:16 7:11 7:55 7:32 8:12Tamien — 4:07 4:45 5:07 — 5:33 — 5:39 6:22 — — 7:02 6:39 7:23 — — 7:39 8:19Capitol 4:52 5:40 6:29 7:09Blossom Hill 4:58 5:46 6:35 7:15Morgan Hill 5:11 5:59 6:48 7:28San Martin 5:17 6:05 6:54 7:34Gilroy 5:30 6:18 7:07 7:47Pajaro 6:01 6:49 7:38 8:18Castroville 6:15 7:03 7:52 8:32Salinas 6:25 7:13 8:02 8:42Gilroy/Salinas service645188AA-082parsons CHAPTER 3: DETAILED DEFINITION OF ALTERNATIVES 58
CALTRAIN EXTENSION TO MONTEREY COUNTYALTERNATIVES ANALYSISConcern has been expressed by Joint Powers Board staff that service interruptions or delaysoccurring south of Gilroy would impact Caltrain operations north of Gilroy. These interruptions ordelays could affect train schedule adherence throughout the day as a minimal amount of recoverytime is included with current schedules.Service interruptions or delays south of the San Jose Tamien station will be outside the control of theJoint Powers Board as this portion of the track is owned by Union Pacific <strong>Rail</strong>road. Potential delaysinclude, but are not limited to, schedule conflicts with Union Pacific freight trains, track maintenance“slow orders” on the Coast Subdivision, grade crossing accidents, pedestrian crossing accidents,mechanical failure, train scheduling/train signaling software malfunctions, ongoing trackresurfacing/tie replacement maintenance activities, train signal malfunctions, train derailments, andtrain or motor vehicle hazardous material spills. These potential service interruptions or delays couldalso occur north of San Jose Diridon, on Joint Powers Board owned track and right-of-way.As part of the service analysis, a preliminary exposure incident/hazards analysis investigation wasundertaken. This assessment indicates that the risk exposure associated with non-train relatedevents south of Gilroy is minimal compared to land use densities, motor vehicle traffic volumes, andpedestrian activities occurring north of Gilroy to San Francisco.South of Gilroy, the Coast line track passes through agricultural or undeveloped lands except in thevicinity of the three proposed stations and Gilroy. Within Gilroy, Pajaro, Castroville and Salinas, theline passes existing and former rail yards and industrial uses. The Coast line traverses 13 at-gradepublic road crossings between the Gilroy (MP 77.04) and Salinas stations (MP 114.90).All of these at-grade crossings serve light traffic volumes except Tenth Street, immediately south ofthe Gilroy station and yard, and Bloomfield Road (State Route 25). Projected traffic volumes for eachof the at-grade crossings are listed in Table 3-3. Only two of these roads have projected trafficvolumes greater than 10,000 vehicles per day.Regarding railroad activities, freight trains operating between San Jose and Watsonville Junction orpoints south comprise the majority of daily movements—which currently average approximately eighttrains per weekday, but may increase to twelve in the future (see Table 3-4. The Amtrak CoastStarlight train also makes one round trip per day over the Coast line track.Washington International Group is currently undertaking a capacity study for Union Pacific and the<strong>Transportation</strong> Agency for Monterey County. This capacity study is investigating the extension of fourround trip Caltrain movements between Salinas and Gilroy. A two round trip Caltrain extensionscenario has previously been undertaken. While this simulation/capacity study remains underway,Washington International Group has opined the following:“The set of improvements being built in connection with additional Gilroy trains areadequate to handle both Caltrain and UP trains without excessive delay. In all oursimulations, and in the Real World, commuter trains will have priority over freights.Many of the improvements under construction are designed to facilitate the propermovement of commuters, and preserve the level of utility of UP freight service. Butnone of the improvements were designed with a particular UP through freightservice schedule in mind, as they change too often, and the train scheduleperformance is erratic.”The objective of the four train capacity study will be to identify track and signaling enhancementssouth of Gilroy which are required to support the extension of Caltrain service to Salinas.parsons CHAPTER 3: DETAILED DEFINITION OF ALTERNATIVES 59
CALTRAIN EXTENSION TO MONTEREY COUNTYALTERNATIVES ANALYSISTable 3-3At-Grade Public Crossing LocationsCountyCity (in/near)Santa ClaraUS DOTIDStreet/RoadCountDateCount AverageDaily Traffic2013 EstimatedDaily Traffic2030 ADT>10,000Gilroy 755186C Tenth 2005 19,500 22,800 YesGilroy 755187J Luchessa 2005 8,000 9,400 NoGilroy 755194U Bolsa 1988 400 700 NoGilroy 755195B Bloomfield (SR 25) 2000 20,200 26,100 YesMontereyAromas 755206L Carpenteria 1991 2,750 4,300 NoAromas 755207T Kortwright 1991 50 100 NoWatsonville 755209G San Juan 1996 6,900 9,700 NoWatsonville 755212P San Miguel Cyn 1991 1,300 2,000 NoPajaro 752354V Lewis 1991 1,200 1,900 NoMoss Landing 752351A Kirby 1987 50 100 NoCastroville 752253J Blackie 1991 4,300 6,600 NoCastroville 752252C Espinosa 1991 5,500 8,500 NoSalinas 752246Y San Jon 1988 750 1,200 NoSource: US DOT Crossing Inventory; City of Gilroy Traffic Monitoring Program; Caltrans District 5Note: Traffic count volumes increased by a growth factor of two percent per year to represent future conditions when the Caltrainservice was projected to be operating.Fares and RevenuesExpansion of the existing JPB fare structure is assumed for the Caltrain <strong>Extension</strong> Alternative,increasing the number of fare zones from six to eight. The three station stops in Monterey Countywould all be in fare zone 8. No stations are proposed for fare zone seven, which could eventuallyinclude a future service extension to Hollister. This fare structure is detailed in Chapter 6 under Estimationof Capital, Operating and Maintenance Costs and Revenue.Fare revenues generated by passengers boarding (AM) and deboarding (PM) in Monterey Countyare assumed to be credited to the Monterey <strong>Extension</strong> Service account.Train Operations/Purchase of ServiceCaltrain passenger rail service to/from Monterey County would be procured by TAMC through a“purchase of service” from JPB. JPB in turn would contract with its operator for service. The Caltrain<strong>Extension</strong> Alternative operations and maintenance costing assumes that the purchase of servicecontract would be based on a mutually agreeable fully allocated cost formula, based on budgeted andactual JPB costs. Additionally, the Caltrain <strong>Extension</strong> Alternative anticipates the inclusion of a “crewbasing surcharge” which may be imposed by JPB’s contract operator, for train crew deploymentto/from Salinas.parsons CHAPTER 3: DETAILED DEFINITION OF ALTERNATIVES 60
CALTRAIN EXTENSION TO MONTEREY COUNTYALTERNATIVES ANALYSISTable 3-4Coast Line Existing and Expanded Freight Service (San Jose to Salinas)TrainWeekly TripsSanJoseMorganHillGilroyWatsonvilleJunction Castroville SalinasExistingIBRLBR 1 ―――――――――――――――――――――――ILCOA 5 ――――――――――――IOALBR 7 ―――――――――――――――――――――――LRQ31 5 ―――――5 ―――――LRQ40 5 ―――――――5 ―――――――LRQ42R 5 ――――5 ――――LRQ53 6 ――――――――――――6 ――――――――――――LRQ81B 3 ――――――――3 ――――――――LRQ83 6 ――――――6 ――――――MMLRV 7 ―――――――――――――――――――――――MWCPT 7 ―――――――――――――――――――――――QRVML 7 ―――――――――――――――――――――――ExpansionAOAWF 7 ―――――――――――――――――――――――MWCoaEU 7 ―――――――――――――――――――――――MWCoaRV 7 ―――――――――――――――――――――――ZBRoaLC 7 ―――――――――――――――――――――――Weekly Trains 86 86–96 86–96 83 73Insofar as UPRR trackage rights or slot fees for Caltrain service between Gilroy and Salinas, theCaltrain <strong>Extension</strong> Alternative assumes that these fees would be in addition to and separate from theJPB purchase of service. TAMC or TAMC/JPB would negotiate these fees with UPRR. Trackagerights could take the form of an annualized “capital access fee,” similar to the San Joaquin Regional<strong>Rail</strong> Commission’s arrangement with UPRR; or a 10- to 15-year “slot fee” as negotiated by VTA forthe increase in service between Gilroy and San Jose.Capital InvestmentsA draft UPRR term sheet dated June 26, 2003 documents capital investments in track, switch, andsignaling which may be required to implement Caltrain service to Salinas. This term sheet reflects aparsons CHAPTER 3: DETAILED DEFINITION OF ALTERNATIVES 61
CALTRAIN EXTENSION TO MONTEREY COUNTYALTERNATIVES ANALYSIStwo-round trip scenario and will be finalized to reflect a four round trip train scenario.The Caltrain <strong>Extension</strong> Alternative assumes that the financial responsibility for undertaking these andother to be identified capital investments, south of Gilroy to Salinas, will be the responsibility ofTAMC. VTA may be requested to participate in funding the improvements identified at Gilroy inexchange for removing or significantly reducing VTA’s need for an expanded train layover facility inGilroy. Insofar as funding and delivering station improvements in Monterey County, the Caltrain<strong>Extension</strong> Alternative assumes these are the responsibilities of TAMC.ElectrificationAs part of its Caltrain Strategic Plan 2004–2023, JPB has been seeking funding to electrify theCaltrain line between San Francisco and San Jose, and possibly to Gilroy. Electrification will allowtrains to accelerate faster, thereby shortening run times, and allow for the extension of service todowntown San Francisco via an underground tunnel. As the price of diesel fuel has increased,interest in accelerating the implementation of electrifying the line has increased. An environmentaldocument is complete; however, a record of decision has not been provided by the Federal TransitAdministration (FTA) as local funding has not been secured. Design is at a conceptual level and isawaiting the National Environmental Policy Act (NEPA) Record of Decision and FTA’s approval toenter preliminary engineering.JPB has recently completed a cost benefit study of electrification options. The outcome of this studyis reflected within the Project 2025 report.Project 2025 assumes that funding will be secured to electrify the Caltrain line between downtownSan Francisco and downtown San Jose, and this electrification will be accomplished by 2014. Untilthe electrification project is complete, Caltrain will continue to operate trains with diesel-poweredlocomotives and will not be able to serve the downtown San Francisco extension.There are two electrification alternatives which are advanced by the Project 2025 report. Alternative Awould replace the diesel locomotives with electric locomotives and replace the gallery cares with bilevellow-floor cars as they reach the end of their service lives. Diesel equipment (Gilroy/Salinas andDumbarton passenger trains and freight trains) could still use the right-of-way by running “under thewire” once the electrification project is complete.Alternative B would require JPB to replace its entire fleet with rapid transit vehicles, specificallyelectric multiple units (EMU), and require an FRA waiver to operate non-compliant vehicles alongsideFRA-compliant vehicles. According to the Project 2025 report, the transition from current operationsto a rapid transit system would be complicated without provisions for mixed fleet (FRA-compliant andnon-compliant) operations in the corridor.No matter what option is ultimately selected for electrification and no matter what scheduleelectrification ultimately proceeds along, the JPB intends to operate diesel commuter rail equipmentinto the foreseeable future over at least a portion of its line. The Caltrain <strong>Extension</strong> Alternativetherefore assumes diesel fuel propulsion of trains operated between Salinas and San Jose (DiridonStation), or preferably to the Redwood City station or the Fourth and Townsend station in SanFrancisco.Monterey County RidershipThe Caltrain <strong>Extension</strong> Alternative physical facilities and service definition are based on the ridershipforecasts documented in Chapter 4. Weekday boardings at Monterey County stations (AM north-parsons CHAPTER 3: DETAILED DEFINITION OF ALTERNATIVES 62
CALTRAIN EXTENSION TO MONTEREY COUNTYALTERNATIVES ANALYSISbound trains) are forecast at 1,000 riders per day, based on Year 2000 commuting patterns. Thesecommuting patterns appear to hold true as of 2005/2006, and are assumed for 2010 opening yearconditions. Year 2030 boardings at Monterey County stations are forecast as 2,000 riders per day. Inthe afternoon, an equal number of riders would board at San Francisco Bay Area stations (PMsouthbound trains) and ride south to Monterey County.Of this ridership, 90 percent are forecast to ride to stations within Santa Clara County. Seven percentof the riders are forecast to travel to San Mateo County destinations and three percent to SanFrancisco.Vehicle RequirementsThe Caltrain <strong>Extension</strong> Alternative assumesthat existing JPB trainsets operatingto/from Gilroy would be utilized.No additional trainsets would berequired. Additional wear and tear ontrainset locomotives and rolling stockwill be addressed through the fullyallocated cost formula. Vehicle replacementswill be addressed by acapital recovery (mileage based) fee tobe determined through negotiationswith JPB.Trainsets operating to/from Gilroy haveresidual, unused capacity. As of theFebruary 2006 boarding count, nomore than 470 seats were occupied onthe three trains serving Gilroy south ofthe Tamien station; and approximately1,480 seats were vacant (for theportion of the train trip between SanJose Tamien and Gilroy). System-wide,the maximum load point for Caltrainhas historically been at or near theMillbrae station in San Mateo County,well north of most Monterey Countyresident forecast ridership.Actual Monterey County Caltrainridership patterns would be determinedthrough rider surveys and analysis ofCaltrain ticket (zone 8) sales. Thisdata, in conjunction with passengerload checks on trains serving MontereyCounty, would be used to accessMonterey County-generated rollingstock requirements.Caltrain Vehicle Technology OptionsThe issue of rolling stock availability and technology is complex, andremains under negotiation between JPB and TAMC. Project 2025 setsforth three rolling stock options.Under its Current Program—Diesel Locomotives scenario, JPB wouldcontinue to operate its 96 train weekday schedule, with slightly longertrain consists (up to six cars per train) where required to meet capacityrequirements. JPB currently operates 20 sets of rolling stock with oneset aside as a preventive maintenance spare. The current fleet totals110 cab/trailer cars and 29 diesel powered locomotives. These wouldbe replaced as lifecycle and maintenance requirements dictate.Project 2025 notes there is an immediate need to acquire eightadditional cars in the near-term to bolster spare ratios and provideadditional capacity in the form of longer train sets on those trainswhich are operating nearest to capacity. Without additional capacity,JPB has stated that they will be unable to extend service to Salinas,due to their spare vehicle shortfall, and preventive maintenancecycles.Under Alternative A: Electric Locomotives, JPB would replace themajority of its diesel locomotives with electric powered locomotives.JPB would also replace its gallery-style trailers and cab cars (73purchased in 1985 and 20 purchased in 2000) with bi-level, low-floorcars. The fleet would be expanded to provide additional service asdemand warrants. Diesel rolling stock would continue to operate onthe Gilroy extension, and could run “under the wire” as far north as theFourth and Townsend station in San Francisco (the line’s currentnorthern terminus).Under Alternative B: Rapid Transit Non-compliant EMUs, JPB wouldreplace its entire fleet of locomotives and passenger coaches withrapid transit vehicles, specifically electric multiple units (EMUs). AnFRA-compliant EMU to Caltrain specification does not yet exist;therefore, JPB assumes operation of non-compliant EMUs forALternative B operations. To allow for operation of mixed compliantand non-compliant fleets, a FRA waiver would be required. Givensuch a waiver, JPB could transition from diesel locomotive hauledequipment to EMUs over time, and could operate Dumbarton andGilroy/Salinas extension services, as well as freight service, “underthe wire.”parsons CHAPTER 3: DETAILED DEFINITION OF ALTERNATIVES 63
CALTRAIN EXTENSION TO MONTEREY COUNTYALTERNATIVES ANALYSISAdditional trainset capacity (additions of coaches to consists) required to accommodate ridersboarding/deboarding in Monterey County are assumed to be addressed through Federal TransitAdministration grant requests, with TAMC providing the local funding match contribution. Acquisitionof rolling stock to accommodate the initial (two round trip) service plan for extending Caltrain toSalinas has not been identified as a near-term requirement by this <strong>Alternatives</strong> <strong>Analysis</strong>. At sometime in the future, TAMC anticipates the need to participate in JPB’s rolling stock acquisition program.For the purpose of the <strong>Alternatives</strong> <strong>Analysis</strong> Study, the Caltrain <strong>Extension</strong> Alternative assumes theacquisition of four bi-level passenger coaches, one for each of the trainsets operating to/from Salinas.This rolling stock may not be required to accommodate peak passenger loads. The capital cost of thisequipment is included as a risk element for comparison with the Express Bus Alternative.JPB/TAMC SubsidiesThe Caltrain <strong>Extension</strong> Alternative assumes no JPB subsidies of Caltrain extension service. It alsoassumes that there will be no TAMC subsidies of Caltrain service north of Gilroy. The purchase ofservice agreement between JPB and TAMC is assumed to be cost based, without profit.Core System Improvements/TAMC ParticipationThe Caltrain <strong>Extension</strong> to Monterey County enjoys widespread support by Bay Area and State policymakers. The Caltrain <strong>Extension</strong> Alternative assumes no “buy in” requirements (funding for capitalimprovements to the existing system), as none have been identified by JPB/VTA Board members orstaff in negotiations to date.Insofar as improvements needed to accommodate the extension of Caltrain service to MontereyCounty, the Caltrain <strong>Extension</strong> Alternative assumes that TAMC will (or could be required to)participate in funding these improvements. These include:• Additional trainset capacity (four bi-level passenger coaches assumed as a risk element)• Additional trainset layover capacity (in Salinas)—see pages 72 and 73• Gilroy station track extension to East Luchessa Avenue and mainline turnout—see pages 72and 74• South Terminal Improvements to address bottlenecks and multi-operator capacity demands(see Appendix A). These improvements are currently underway and are therefore notassumed—potential risk element.Physical Station, Yard and Track Components of the Caltrain <strong>Extension</strong> AlternativeThe physical components of the Caltrain <strong>Extension</strong> Alternative are described and detailed in theCaltrain <strong>Extension</strong> to Monterey County Project Study Report (PSR), dated February 21, 2006. ThisPSR documents program requirements, locational alternatives, design considerations, designexceptions, property acquisition and relocation plans, real estate cost studies, conceptual designplans, and detailed cost estimates, based on the 10 percent design plans. 4The PSR is a “Project Initiation Document” which provides sufficient project detail and cost estimatesto allow a project to be included in the State <strong>Transportation</strong> Improvement Program at the discretion ofthe California <strong>Transportation</strong> Commission. The Caltrain <strong>Extension</strong> to Monterey County PSR is4Station Program Requirements are identified in Appendix B-2 of the Caltrain <strong>Extension</strong> to Monterey County Project Study Report. Thisdocument is included as Appendix B of this report as it identifies station access, parking, and amenity requirements.parsons CHAPTER 3: DETAILED DEFINITION OF ALTERNATIVES 64
CALTRAIN EXTENSION TO MONTEREY COUNTYALTERNATIVES ANALYSISincluded with this <strong>Alternatives</strong> <strong>Analysis</strong> by reference as the physical definition of the Caltrain<strong>Extension</strong> Alternative.The Caltrain <strong>Extension</strong> Alternative has been defined over the course of a four-year period (March2002 to February 2006) based on extensive public, city, and Union Pacific <strong>Rail</strong>road input. Theevolution of design concepts and project components are detailed in the Caltrain <strong>Extension</strong> toMonterey County PSR.The Caltrain <strong>Extension</strong> Alternative’s physical components include construction of passenger railstations in Pajaro/ Watsonville and Castroville, rehabilitation and expansion of the Salinas Intermodal<strong>Transportation</strong> Center, construction of a Caltrain layover facility in Salinas, and minor track and signalimprovements on the UPRR Coast Line between Gilroy and Salinas. These project components aresummarized below.Pajaro Valley StationThe Pajaro Valley station will serve the unincorporated community of Pajaro, located at the northernend of Monterey County, and Watsonville, which is located at the south end of Santa Cruz County.Under the Caltrain <strong>Extension</strong> Alternative, this station will include the following elements:• A rail passenger loading platform 700 feet long by 20 feet wide• Intertrack fencing separating the main line from the Pajaro Valley station track• Platform shelters, lighting, furniture and fixtures, ticket vending machines, informationdisplays, and landscaping• Station building (provided by others), furniture and fixtures, information displays• Bus, shuttle, and van loading/unloading berths, shelters, information displays• Parking, bicycle facilities, sidewalks, and circulation roadways• Roadway, signing and striping, and roadway median construction• Relocation of track, turnouts, track removals, and railroad signaling• Modification of railroad grade crossing warning devices at Lewis Road• Site drainage, lighting, and landscaping• Access to the station platform via the Santa Cruz branch rail line.Surface parking for approximately 410 vehicles will be provided on the west side of the tracks,roughly parallel with Salinas Road. The northwest corner of the site will remain vacant and provide anopportunity for expansion of parking or other future development. A bus loading and turn-around areawill be located on the northeast corner of the parking lot.Vehicular traffic will access the station via two driveways on Salinas Road between its intersectionswith Lewis Road and <strong>Rail</strong>road Avenue.A significant amount of track work is required to accommodate a Caltrain station at this location(which is preferred by UPRR and the Pajaro community).parsons CHAPTER 3: DETAILED DEFINITION OF ALTERNATIVES 65
CALTRAIN EXTENSION TO MONTEREY COUNTYALTERNATIVES ANALYSISThe overall site and track plan for the station is illustrated as Figure 3-2. An enlarged view of the platformand parking area is illustrated as Figure 3-3. The estimated cost of this station is $17 millionexpressed in FY 2007 dollars, and $18.2 million expressed in year of expenditure dollars.Castroville StationThe Castroville station will serve the unincorporated community of Castroville, surrounding unincorporatedpockets of residential development, and residents living in coastal Monterey Peninsula cities. Ingeneral, the Castroville station will include the following elements:• A rail passenger loading platform 700 feet long by 20 feet wide• Intertrack fencing separating the main line from the Castroville station track• Platform shelters, lighting, furniture and fixtures, ticket vending machines, information displays,and landscaping• Bus, shuttle, and van loading/unloading berths, shelters, information displays• Parking, bicycle facilities, sidewalks, and circulation roadways• Access roadway construction, signing, and striping• Relocation of track, new track construction, turnouts, and railroad signaling, as may berequired• Site drainage, lighting, and landscaping• Pedestrian grade separation crossing of the main line and Castroville station tracks• Access to the station location via the Monterey branch rail line.Surface parking for approximately 250 vehicles will be provided to the east and west of the stationplatform. The parking supplies will be accessible to Monterey Peninsula commuters via Collins Road,which will be resurfaced or reconstructed and extended. Local Castroville residents will access thestation via Benson Road which will be connected to Salinas Road. The east side parking lots will beconnected to the station platform via a pathway that leads from the western edge of the parking lotthrough a bicycle and pedestrian undercrossing to the station platform located on the west side of thetrack.Auto passenger drop-off and taxi loading will take place on the west side of the station, adjacent tothe platform.The conceptual plan for the station is illustrated as Figure 3-4. The estimated cost of this station is$16.4 million expressed in FY 2007 dollars, and $17.6 million expressed in year of expendituredollars.parsons CHAPTER 3: DETAILED DEFINITION OF ALTERNATIVES 66
CALTRAIN EXTENSION TO MONTEREY COUNTYALTERNATIVES ANALYSISFigure 3-2Pajaro Valley Station Overall Site and Track Plan645188AA-018parsons CHAPTER 3: DETAILED DEFINITION OF ALTERNATIVES 67
CALTRAIN EXTENSION TO MONTEREY COUNTYALTERNATIVES ANALYSISFigure 3-3Pajaro Valley Station Site Parking Lot Plan645188AA-019parsons CHAPTER 3: DETAILED DEFINITION OF ALTERNATIVES 68
CALTRAIN EXTENSION TO MONTEREY COUNTYALTERNATIVES ANALYSISFigure 3-4Caltrain <strong>Extension</strong> Alternative Castroville Station Site Plan645188AA-020parsons CHAPTER 3: DETAILED DEFINITION OF ALTERNATIVES 69
CALTRAIN EXTENSION TO MONTEREY COUNTYALTERNATIVES ANALYSISSalinas Intermodal <strong>Transportation</strong> Center ExpansionThe City of Salinas has been working to upgrade the existing Salinas Amtrak Station since 1996. TheCaltrain <strong>Extension</strong> Alternative will expand the Intermodal <strong>Transportation</strong> Center (ITC) toaccommodate the Caltrain extension, relocation of the Monterey-Salinas Transit downtown Salinastransit center to the ITC, relocation of Greyhound and other intercity bus operations to the ITC, andupgrade the Amtrak boarding platform to conform with current design standards. The Salinas stationand parking renovations include:• Increased parking supply adjacent to the station with approximately 500 net new parkingspaces• Bicycle lockers and bicycle racks• Reconstruction of the passenger loading platform for joint Amtrak and Caltrain use• Resurfacing track, new track construction, turnouts, and railroad signaling• Installation of a public address system, benches, trash receptacles, ticket vending machines,and shelters• Installation of an electronic message sign consistent with Caltrain and Amtrak improvementplans• Addition of new site access and circulation roadways• Traffic signalization, signing, and striping• Relocation of the Monterey-Salinas Transit Center in downtown Salinas and the Greyhoundbus depot to the site of the ITC• Site lighting and landscaping• Modifications to adjacent structures.Structured or surface parking for approximately 650–700 vehicles will be provided adjacent to theexisting Amtrak station building. The parking supply and the expanded ITC will be accessed by a newroadway extension of Lincoln Avenue. Palmetto Street, Happ Place, and Vale Street will also beavailable for site access/egress depending on the ultimate alternative selection, either surface andstructured parking (alternative 17) or only surface parking (alternative 18).The reconstructed station platform will allow for Amtrak patron loading along its northern edge andCaltrain patron loading along its southern edge. A new station track will be constructed for Caltrainuse, stub ending at the Salinas station. A canopy will cover the Caltrain/Amtrak station platform andconnect these passenger loading areas with the parking supplies.Figure 3-5 illustrates the conceptual plan for expansion option 18, which is assumed for the Caltrain<strong>Extension</strong> Alternative. The capital cost of these ITC improvements is $29.7 million expressed in FY2007 dollars, and $31.6 million expressed in year of expenditure dollars.parsons CHAPTER 3: DETAILED DEFINITION OF ALTERNATIVES 70
CALTRAIN EXTENSION TO MONTEREY COUNTYALTERNATIVES ANALYSISFigure 3-5Caltrain <strong>Extension</strong> Alternative Salinas Intermodal <strong>Transportation</strong> Center Expansion Option 18B645188AA-021parsons CHAPTER 3: DETAILED DEFINITION OF ALTERNATIVES 71
CALTRAIN EXTENSION TO MONTEREY COUNTYALTERNATIVES ANALYSISSalinas Layover FacilityAn overnight storage and light maintenance facility will be required to accommodate the Caltrainextension to Salinas. UPRR has determined that their existing, adjacent yard will not be available tomeet this requirement. In general, the Salinas layover facility will include the following elements:• Construction of yard track and turnouts to initially accommodate up to four Caltrain consists• Construction of maintenance roads• Perimeter fencing and security lighting• Drip pans for the fueling positions and spill containment• Standby power and potable water pedestals• A small building for housing brake shoes, tools, and supplies• A crew base building.Storage for up to four train sets is envisioned for the Caltrain <strong>Extension</strong> Alternative, similar to theexisting Caltrain layover facility at Gilroy. The conceptual plan illustrated as Figure 3-6 will allow forthe expansion of this facility to accommodate up to six Caltrain consists. The estimated capital cost ofthis yard is $11.7 million expressed in FY 2007 dollars, and $12.3 million expressed in year ofexpenditure dollars.Gilroy Yard Improvements<strong>Extension</strong> of Caltrain service south of Gilroy will require a new track connection at the south end ofthe station track to permit passenger train flow-through while maintaining passenger boarding fromthe existing station platform. The track extension will include demolition, track, ties, ballast, one newturnout, modifying railroad signal interlocking, and modifying motorist warning devices at 10th Street,immediately adjacent to the Gilroy station and at Luchessa Street. Figure 3-7 provides a conceptualplan that shows the improvements needed at Gilroy. These improvements are estimated to cost $4.1million expressed in FY 2007 dollars and $4.4 million expressed in year of expenditure dollars.UPRR Coast Main Line ImprovementsThe Caltrain <strong>Extension</strong> Alternative will include railway improvements to the existing UPRR Coastmain line, passing tracks, yard tracks, and branch line connections to allow Caltrain to extend servicefrom Gilroy in Santa Clara County, through San Benito County to Salinas in Monterey County. Allrailway improvements noted below will occur within the UPRR right-of-way. Milepost (MP) locationsare approximate.Gilroy• Install new second main track from 10th Street to East Luchessa Avenue (MP 77.65 toMP 78.52)• Tenth Street (MP 77.70). Relocate existing or install new warning devices at crossingNo. 755180C to accommodate three tracks. Install concrete grade crossing panels, rebuildtrack, replace ballast, and repave crossing for new track• East Luchessa Avenue (MP 78.40). Relocate existing or install new warning devices atcrossing No. 755181J to accommodate two tracks. Install concrete grade crossing panels,rebuild track, replace ballast and repave crossing for new track• South (east) of East Luchessa Avenue (MP 78.52). Install #20 power turnout.parsons CHAPTER 3: DETAILED DEFINITION OF ALTERNATIVES 72
CALTRAIN EXTENSION TO MONTEREY COUNTYALTERNATIVES ANALYSISFigure 3-6Caltrain <strong>Extension</strong> Alternative Salinas Layover Facility and Surface Parking645188AA-022parsons CHAPTER 3: DETAILED DEFINITION OF ALTERNATIVES 73
CALTRAIN EXTENSION TO MONTEREY COUNTYALTERNATIVES ANALYSISFigure 3-7Caltrain <strong>Extension</strong> Alternative Gilroy Yard Necessary Improvements645188AA-024parsons CHAPTER 3: DETAILED DEFINITION OF ALTERNATIVES 74
CALTRAIN EXTENSION TO MONTEREY COUNTYALTERNATIVES ANALYSISPajaro• Logan (west end of double track at MP 89.63). Replace existing spring switch with #20 powerturnout• Watsonville Yard (MP 96.67). Replace existing track crossover with left hand #15 powercrossover• Watsonville Yard (MP 96.69). Install right hand #11 power crossover• Watsonville Yard (MP 96.82 to MP 97.33). Shift main track No. 2• Watsonville Yard (MP 96.82 to MP 97.00). Shift yard lead track• Watsonville Yard (Lewis Road MP 97.19 to vicinity MP 96). Remove yard track• Watsonville Yard (MP 97.00 and MP 97.02). Install left hand #11 turnouts• Watsonville Yard (MP 97.19). Remove existing turnout• Lewis Road (MP 97.20). Relocate existing or install new warning devices at crossing#752354V. Install concrete grade crossing panels, rebuild track, replace ballast and repavecrossing for shifted main track No. 2• South (east) of Lewis Road (MP 97.40). Replace existing spring switch with #20 powerturnout.Castroville• North of SR 156 (MP 106.27). Install #15 power turnout• Construct station track from MP 106.27 to MP 106.76• South of SR 156 (MP 106.70). Install #11 turnout• South of SR 156 (MP 106.70 to MP 106.85). Restore existing siding track• South of SR 156 (MP 106.76). Install #15 power turnout• North of SR 156 to south of SR 156 (MP 106.27 to MP 106.87). Shift main line track easterly3 feet 8 inches or less.Salinas• At Vale Street (MP 114.70). Install #15 power crossover• New Street to Main Street (MP 114.58 to MP 115.07). Resurface or rebuild main line track,replace ballast.Coast Main Line—Gilroy to Salinas• Resurface and/or rebuild track, replace ballast, replace ties, repair or upgrade drainagestructures, upgrade or install train signals and controllers at locations to be determined.The capital cost of the Gilroy, Pajaro, Castroville and Salinas main line improvements is reflected inthe station cost estimates. The Caltrain <strong>Extension</strong> Alternative includes a $5 million allowance forunspecified Coast Main Line-Gilroy to Salinas track, tie, and signal improvements. This capital costallocation has not been negotiated with UPRR and is considered to be a risk factor.parsons CHAPTER 3: DETAILED DEFINITION OF ALTERNATIVES 75
CALTRAIN EXTENSION TO MONTEREY COUNTYALTERNATIVES ANALYSISDEFINITION OF THE EXPRESS BUS ALTERNATIVE—EXPRESS BUSSERVICE TO SAN FRANCISCO PENINSULAThe shortlisted Monterey County Fixed Guideway Study “Build” <strong>Alternatives</strong> (<strong>Alternatives</strong> A, B, and C)address a variety of travel markets. These include Monterey County to San Francisco Bay Areacommuters; local Monterey Peninsula trips; intra-Monterey County trips between Salinas and theMonterey Peninsula; and inter-city trip making by residents and visitors between the MontereyPeninsula and San Francisco. For an <strong>Alternatives</strong> <strong>Analysis</strong>, the Express Bus Alternative must bedefined to mimic whichever service or services are selected as the locally preferred build alternative(LPA).Fixed Guideway InvestmentThe Build <strong>Alternatives</strong> (A, B, and C) shortlisted for detailed definition and testing include componentsto address each of the travel markets noted above. Insofar as the Monterey County to San FranciscoBay Area commuters, all three alternatives specify a Caltrain extension from Gilroy to Salinas toaddress this travel market. The definition of the Caltrain <strong>Extension</strong> service and capital investment isidentical for all three shortlisted Build <strong>Alternatives</strong>. TAMC Board policy and the results of this FixedGuideway Study therefore identify the Caltrain <strong>Extension</strong> as the LPA for this travel market.An Express Bus Alternative does not typically include fixed-guideway investments; however, roadwayand intersection improvements can be constructed to speed local or express bus transportation.These may include high-occupancy vehicle bypass lanes at ramp metered highway interchanges,traffic queue bypass lanes at signalized intersections, and traffic signal priority measures. Thesefeatures are also elements of many non-guideway bus rapid transit (BRT) deployments. Majorconstruction of highway lanes or exclusive roadways for transit is typically beyond the investmentcontemplated for TSM alternatives.In the case of Monterey County, however, failure to address capacity shortfalls in an express bus or“Baseline” alternative merely ignores the county’s transportation problems. Demonstrated capacityproblems exist currently in the U.S. 101, SR 1, Route 68, SR 156, Route 183 and the Marina–Salinascorridors (Blanco Road and Davis Road). Environmental, topographic, and funding constraints, plusthe cost of major road construction, all limit options for non-transit solutions. Therefore, to considerexpress bus or baseline proposals as a viable alternative to “build” transit guideway options, definitionof this alternative must include the delivery of equivalent travel time savings, comfort and conveniencefor transit users.Service/Stations/StopsTo provide Caltrain comparable service, MST express bus service will be established as part of theExpress Bus Alternative and will operate from four Monterey County Transit Centers to the SanFrancisco Peninsula. An MST Transit Center/Park-n-Ride facility will be constructed at Eighth Streetin Marina as part of the University Villages redevelopment of Fort Ord. Additional transit centers withpark-and-ride facilities will be located in Salinas, Castroville, and Pajaro with express bus serviceoperating via existing surface roadways to Santa Clara and San Mateo counties. The location ofthese park-and-ride facilities is illustrated in Figure 3-8.parsons CHAPTER 3: DETAILED DEFINITION OF ALTERNATIVES 76
CALTRAIN EXTENSION TO MONTEREY COUNTYALTERNATIVES ANALYSISThe Express Bus Alternative will includethe construction of park-and-ride facilitiesto support express bus operationsat comparable Caltrain <strong>Extension</strong> Alternativerail station locations. These willinclude Salinas, Castroville and Pajaro/Watsonville, as well as Marina (FortOrd). Service will be provided to attractcomparable ridership. Hence, facilitieswill be similarly sized to the locally preferredCaltrain <strong>Extension</strong> Alternative.Figure 3-8Location of Express Bus Alternative Park-and-RideFacilitiesOperationsThe Express Bus Alternative will be similarlydefined to the Caltrain <strong>Extension</strong>Alternative as a commuter-oriented service.Express bus service betweenMonterey County origin stations will bedefined to run non-stop to select stationsin Santa Clara, San Mateo, andSan Francisco counties. Table 3-5identifies the matrix of station originsand destinations proposed for thisservice. The table also indicates thefrequency of service required toaccommodate Year 2030 passengerdemands. The objective will be to providecomparable service from both aride quality and travel time perspective.Ultimately, providing a similar level ofcorridor capacity and the removal ofvehicle trips from the U.S. 101 Corridorwill be the objective of the Express BusAlternative. Over the road, commutervehicles with more comfortable seatingwill be substituted for standard MSTcoaches.parsons CHAPTER 3: DETAILED DEFINITION OF ALTERNATIVES 77
CALTRAIN EXTENSION TO MONTEREY COUNTYALTERNATIVES ANALYSISTable 3-5Express Bus Alternative Service Matrix and Frequency of Service (Headway Minutes)San Mateo andSanta Clara–MidSanta Clara–NorthSan FranciscoMonterey County A-1 A-2 B-1 B-2 CPajaro 30 30 30 60Castroville/Fort Ord 60 30 60Salinas 30 30 15 15 30Station Matrix Key: A-1 = San Jose Diridon B-1 = Mountain View, San Antonio C = Redwood City, Hillsdale,A-2 = Santa Clara (SJIA), B-2 = California, Palo Alto Millbrae (SFO),Lawrence, SunnyvaleSan FranciscoVehicle RequirementsLuxury, high-speed transmission, over theroad motor coaches will be acquired forthis service. These coaches will featureall-forward-facing high back seats, individualair controls and reading lights forpassenger comfort and convenience. Forcosting purposes, 40-foot coaches areassumed with a capacity of 45 to 49 passengersper vehicle. Assuming an averageload factor of 85 percent, equivalent to 40passengers per vehicle, 30 vehicles will berequired to operate the service (includingspares) in the near term—carrying 1,028commuters to the San Francisco Peninsulaeach weekday. This is equivalent to two Caltrain trips extended from Gilroy to Salinas. Longerterm, a fleet of 60 motor coaches (50 vehicles in revenue service plus 10 spares) will be required toaccommodate the four Caltrain each way ridership scenario.Fares and RevenuesThe same fare structure as proposed for the Caltrain <strong>Extension</strong> Alternative is assumed for the ExpressBus Alternative. All fare revenues will be used to offset operating and maintenance expenses.Physical Facilities of the Express Bus AlternativeAs noted above, the Express Bus Alternative assumes that MST will provide express bus servicefrom four park-and-ride facilities located in Pajaro Valley, Castroville, Salinas, and Marina. In addition,the planned Frank J. Lichtanski Monterey Bay Operations Center facility will need to be enlarged inscope to accommodate the express bus fleet.parsons CHAPTER 3: DETAILED DEFINITION OF ALTERNATIVES 78
CALTRAIN EXTENSION TO MONTEREY COUNTYALTERNATIVES ANALYSISPajaro Valley Park-and-Ride FacilityThe Express Bus Alternative assumes that a park-and-ride facility will be constructed in Pajaro at thesite of the proposed Caltrain station. Given this location along the UPRR Coast line track, the ExpressBus Alternative investment could be used for Caltrain <strong>Extension</strong> Alternative passenger rail service,when capacity/operations and maintenance cost tradeoffs warrant.In general, the Pajaro park-and-ride facility will include the same elements as the Caltrain <strong>Extension</strong>Alternative minus the Caltrain passenger loading platform and the track, switch and signalingimprovements needed to accommodate Caltrain service. The resulting park-and-ride facility willinclude the following elements:• Station building (provided by others), furniture and fixtures, information displays• Bus, shuttle, and van loading/unloading berths, shelters, information displays• Parking, bicycle facilities, sidewalks, and circulation roadways• Roadway, signing and striping, and roadway median construction• Site drainage, lighting, and landscaping.Surface parking for approximately 410 vehicles will be provided on the west side of the tracks,roughly parallel with Salinas Road. The northwest corner of the site will remain vacant and provide anopportunity for expansion of parking or other future development. The express bus loading and turnaroundarea will be located on the northeast corner of the parking lot.Vehicular traffic will access the station via two driveways on Salinas Road between its intersectionswith Lewis Road and <strong>Rail</strong>road Avenue.Features included with the Express Bus Alternative are highlighted on Figure 3-9. The estimated costof this facility is $7.8 million expressed in FY 2007 dollars and $8.3 million expressed in year ofexpenditure dollars.Castroville Park-and-RideSimilar to Pajaro, the Castroville park-and-ride facility will be sited adjacent to the UPRR Coast Linetrack, to facilitate conversion to a rail passenger facility at a later date. A smaller parking supply willbe provided at this location compared to the Caltrain <strong>Extension</strong> Alternative. A companion facility willbe constructed at Marina to provide an equivalent supply of parking. The Castroville park-and-ride willinclude:• Bus, shuttle, and van loading/unloading berths, shelters, information displays• Parking, bicycle facilities, sidewalks, and circulation roadways• Access roadway construction, signing, and striping• Site drainage, lighting, and landscaping• Pedestrian grade separation crossing of the main line and Castroville station tracks• Shoofly track to permit construction of a pedestrian grade separation• Safety fencing to control pedestrian at-grade crossing of the UPRR main line track• Access to the station location via the Monterey branch rail line.• Surface parking for approximately 53 vehicles will be provided to the west of the UPRR track.Local Castroville residents will access the station via Benson Road, which will be connected toSalinas Road, and via a pedestrian undercrossing of the UPRR track.parsons CHAPTER 3: DETAILED DEFINITION OF ALTERNATIVES 79
CALTRAIN EXTENSION TO MONTEREY COUNTYALTERNATIVES ANALYSISFigure 3-9Express Bus Alternative Pajaro Valley Park-and-Ride645188AA-026parsons CHAPTER 3: DETAILED DEFINITION OF ALTERNATIVES 80
CALTRAIN EXTENSION TO MONTEREY COUNTYALTERNATIVES ANALYSISAuto passenger drop-off, express bus and taxi loading will take place adjacent to the park-and-ridelot.The conceptual plan for the park-and-ride facility is illustrated on Figure 3-10. Elements pertaining tothe Express Bus Alternative are highlighted.The Castroville park-and-ride facility is estimated to cost $7.3 million expressed in FY 2007 dollarsand $7.8 million expressed in year of expenditure dollars.Salinas ITC ExpansionThe Salinas ITC will be expanded to accommodate MST local bus operations, intercity busoperations, Express Bus Alternative operations, and upgrades of the Amtrak platform to meet currentdesign standards. Elements of the project will include:• Increased parking supply adjacent to the station with approximately 550 net parking spaces• Bicycle lockers and bicycle racks• Reconstruction of the passenger loading platform for Amtrak use• Resurfacing and reballasting track to provide a consistent boarding elevation adjacent to theplatform• Installation of a public address system, benches, trash receptacles, and shelters• Installation of an electronic message sign consistent with Amtrak improvement plans• Addition of new site access and circulation roadways• Traffic signalization, signing, and striping• Relocation of the Monterey-Salinas Transit Center in downtown Salinas and the Greyhoundbus depot to the site of the ITC• Site lighting and landscaping• Modifications to adjacent structures.Structured parking for approximately 700 vehicles will be provided adjacent to the existing Amtrakstation building. The parking supply and the expanded ITC will be accessed by a new roadwayextension of Lincoln Avenue. Palmetto Street will also be available for site access/egress.The reconstructed station platform will allow for Amtrak patron loading from an elevation 8 inchesabove the top of rail. Currently, the platform is level with the top of rail. A canopy will cover the Amtrakstation platform and connect this passenger loading area with the parking supply.Figure 3-11 illustrates the conceptual plan for expansion option 17. A parking structure is assumed(see Figure 3-12) as there will be no need to acquire lands to the west for a track connection to aCaltrain layover facility.The estimated cost of these capital improvements is $32.1 million expressed in FY 2007 dollars and$34.3 million expressed in year of expenditure dollars.parsons CHAPTER 3: DETAILED DEFINITION OF ALTERNATIVES 81
CALTRAIN EXTENSION TO MONTEREY COUNTYALTERNATIVES ANALYSISFigure 3-10Express Bus Alternative Castroville Park-and-Ride645188AA-027parsons CHAPTER 3: DETAILED DEFINITION OF ALTERNATIVES 82
CALTRAIN EXTENSION TO MONTEREY COUNTYALTERNATIVES ANALYSISFigure 3-11Express Bus Alternative Salinas Intermodal <strong>Transportation</strong> Center Expansion Option 17645188AA-028parsons CHAPTER 3: DETAILED DEFINITION OF ALTERNATIVES 83
CALTRAIN EXTENSION TO MONTEREY COUNTYALTERNATIVES ANALYSISFigure 3-12Express Bus Alternative Salinas Intermodal <strong>Transportation</strong> Center Expansion Parking Structure Floor Plans645188AA-029parsons CHAPTER 3: DETAILED DEFINITION OF ALTERNATIVES 84
CALTRAIN EXTENSION TO MONTEREY COUNTYALTERNATIVES ANALYSISMarina/California State University–Monterey Bay (CSUMB) Transit Center and Park-and-RideIn addition to the park-and-ride facilities at Pajaro Valley, Castroville, and the Salinas ITC, theExpress Bus Alternative will include construction of an MST Transit Center and park-and-ride facilityin Marina at CSUMB (former Fort Ord). The site will be on lands owned by TAMC, proposed for useas a transportation center, adjacent to a proposed transit-oriented development.As illustrated on Figure 3-13, Express Bus Alternative elements will include:• Bus, shuttle and van loading/unloading berths• Bus passenger waiting and a driver/operations and ticket sales enclosed spaces• Parking, bicycle facilities, sidewalks and circulation roadways• Access roadway construction, signing and striping• Site drainage, lighting and landscaping• Access to the transit center via the Monterey branch rail line.Surface parking for approximately 128 vehicles will be provided to complement the reduced parkingsupplied at the Castroville facility. Combined, the Castroville and Marina park-and-rides will provideequivalent capacity for the Express Bus Alternative when compared with the Caltrain <strong>Extension</strong>Alternative.Access to the park-and-ride will be via Eighth Street and First Avenue.The estimated capital cost of this facility is $8.7 million expressed in FY 2007 dollars and $9.2 millionexpressed in year of expenditure dollars.Frank J. Lichtanski Monterey Bay Operations Center ExpansionMonterey-Salinas Transit anticipates that the demands on the region’s transportation infrastructureand services will greatly increase. MST has out-grown its operating divisions in Monterey andSalinas. Fleet expansion to meet growing community needs requires upgraded maintenance,operations and administrative facilities to provide adequate support. On January 13, 2003, MSTreceived quitclaim deeds from the United States Department of the Army for three parcels of theformer Fort Ord military Reservation. A portion of this acreage will serve as the site of the Frank J.Lichtanski Monterey Bay Operations Center. The estimated cost to design and construct the facility isapproximately $28.0 million and the facility will accommodate 170 buses.MST officials state that the new operations center has not been planned to accommodate the expressbus fleet anticipated by the Express Bus Alternative. The Frank J. Lichtanski Monterey BayOperations Center will therefore need to be expanded, or an existing facility (Monterey) reutilized toaccommodate the express bus fleet. In either event, an allowance of $100,000 per vehicle isassumed to expand, purchase, or upgrade a maintenance and operations base for the Express BusAlternative fleet.parsons CHAPTER 3: DETAILED DEFINITION OF ALTERNATIVES 85
CALTRAIN EXTENSION TO MONTEREY COUNTYALTERNATIVES ANALYSISFigure 3-13Express Bus Alternative Marina/CSUMB Monterey-Salinas Transit Cente645188AA-030parsons CHAPTER 3: DETAILED DEFINITION OF ALTERNATIVES 86
CALTRAIN EXTENSION TO MONTEREY COUNTYALTERNATIVES ANALYSISALTERNATIVES CONSIDERED, BUT REJECTEDTo accomplish the objectives of the Caltrain <strong>Extension</strong> Alternative, an alternative needs to be sufficientlyattractive to provide a quality of service comparable to the Caltrain <strong>Extension</strong> Alternative. Inaddition to the express bus scenario defined above, additional alternatives were considered, butrejected.Shuttle Bus Service to GilroyThis alternative would operate regularly scheduled, fixed route bus service between concentrations ofpopulation in northern Monterey County and the Gilroy Caltrain station. Schedules would be devisedto meet Caltrain trips, allowing for cross platform transfers at the existing Gilroy station. Route originsin Monterey County would include Salinas, the Monterey Peninsula, Castroville and Pajaro/Watsonville. Park-and-ride lots could also be constructed as part of this service definition.A service virtually identical to that outlined was operated by MST for three years between September9, 2002 and July 29, 2005. Known as the “Caltrain Fastrack,” the service failed to attract sufficientridership to warrant its continuance following a three-year demonstration period. Long travel times bybus to Gilroy, the need to transfer in Gilroy, and missed connections were cited as reasons fordiscontinuing the service.The exhibit shown on the following page depicts the public timetable and route map for the CaltrainFastrack service. The routes served all of the proposed Express Bus Alternative park-and-ride sitesor their equivalent bus stops, with the exception of Pajaro/Watsonville. Travel time to Gilroy wascomparable to the proposed Caltrain extension service; however, these shuttle bus passengersencountered additional time penalties for transfers. The timetables indicate 18 minutes of delay fornorthbound, AM riders assuming on time arrival of Route 25/26 vehicles.Table 3-6 indicates the ridership experienced on lines 25/26 during January and February 2005.Ridership averaged 28 patrons in each direction or 56 riders per day. Operating costs were approximately$300,000 per year.Limited Stop Bus Service to San JoseThis alternative would operate regularly scheduled, limited stop, fixed route bus service betweenconcentrations of population in northern Monterey County and selected stops in Santa Clara County,including the Diridon Caltrain Station adjacent to downtown San Jose.Beginning in the summer of 2006, MST initiated a limited stop service (Line 55) from Monterey to SanJose Diridon Station, with intermediate stops in Edgewater/Sand City, Prunedale, Gilroy, and MorganHill. The route is similar to Route 25 as discussed above, but this service extends to San Jose. Traveltime between Monterey and San Jose is 2 hours 13 minutes during the morning commute trip and 2hours during the evening commute trip. The public timetable and route map for this service is shownas an exhibit on the following page.This Limited Stop Bus Alternative is similar to the proposed Express Bus Alternative. The ExpressBus Alternative will, however, additionally serve sets of stations north of downtown San Jose whichattract the vast majority of trips originating within Monterey County, based on Caltrain boarding anddeboarding counts.parsons CHAPTER 3: DETAILED DEFINITION OF ALTERNATIVES 87
645188AA-078CALTRAIN EXTENSION TO MONTEREY COUNTYALTERNATIVES ANALYSISTable 3-6Monterey–Salinas Transit Lines 25 and 26: Caltrain Fastrack Boarding Statistics(January–February 2005)Month Line 25 Line 26 TotalJanuary 2005• 20 weekdays• 402.67 hours of operationFebruary 2005• 20 weekdays• 402.67 hours of operationAll of fiscal year 2004• 379 total boardings• 19/day• 9 passenger round trips• 374 total boardings• 19/day• 9 passenger round trips• 759 total boardings• 38/day• 19 passenger round trips• 754 total boardings• 38/day• 19 passenger round trips• 1,138 total boardings• 57/day• 28 passenger round trips• 1,128 total boardings• 57/day• 28 passenger round trips1,070 average monthly total boardings645188AA-031parsons CHAPTER 3: DETAILED DEFINITION OF ALTERNATIVES 88
CALTRAIN EXTENSION TO MONTEREY COUNTYALTERNATIVES ANALYSISShuttle Train Service to GilroyThis alternative would operate regularly scheduled shuttle train service between three stations locatedin Monterey County (Pajaro, Castroville and Salinas) and the Gilroy Caltrain station. Scheduleswould be devised to meet Caltrain trips, allowing for cross track transfers at the existing Gilroy station.Physical improvements to stations, platforms, park-and-ride facilities, main line track, and layoverfacilities, defined for the Caltrain <strong>Extension</strong> Alternative, would be assumed for this Shuttle TrainService Alternative. Additionally, this alternative would require purchase of locomotives andpassenger coaches for the shuttle trainsets running between Salinas and Gilroy.To minimize impacts to UPRR freight operations, and therefore minimize the need for offsettingmainline capacity improvements; this alternative would store the shuttle trains in Gilroy during themidday on VTA’s existing layover tracks.Compared with the Caltrain <strong>Extension</strong> Alternative, the Shuttle Train Alternative would be moreexpensive, both from a capital and operating perspective. Insofar as capital costs, the Shuttle TrainAlternative would require the purchase of FRA-compliant rolling stock that would stand idle for all buttwo hours, 255 weekdays per year. From an operating cost perspective, a shuttle train service wouldbe cost prohibitive as train crew productivity (vehicle hours of revenue service) would be less than 15percent of crew paid time.Independent Train Service to San FranciscoThis alternative would operate regularly scheduled, independent, commuter rail service betweenthree stations located in Monterey County (Pajaro, Castroville and Salinas) and the San FranciscoCaltrain station. Schedules would be devised to interlace with Caltrain trips, thereby supplementing orreplacing existing Caltrain service. Similar to Altamont <strong>Commuter</strong> Express (ACE) service, trainswould originate in Salinas and make one northbound trip in the morning to San Francisco. During themidday, trains would layover in San Francisco before returning to Salinas in the evening.Monterey County based trains would make selected stops at stations between Gilroy and SanFrancisco. To minimize disruptions to existing Caltrain operating schedules, Monterey County basedtrains could piggyback behind Caltrain Baby Bullet trains, or replace selected trips (such as trains215, 319, 323, 329, 362, 368, 372 and 378) altogether.Physical improvements to stations, platforms, park-and-ride facilities, main line track, and layoverfacilities, defined for the Caltrain <strong>Extension</strong> Alternative, would be assumed for this Independent TrainService Alternative. Additionally, this alternative would require purchase of locomotives andpassenger coaches for the trainsets running between Salinas and San Francisco.To minimize impacts to Union Pacific <strong>Rail</strong>road freight operations, and therefore minimize the need foradditional offsetting mainline capacity improvements, the <strong>Transportation</strong> Agency for Monterey Countywould assume the responsibility for its proportional share of track improvements and slot feesnegotiated by the Santa Clara Valley <strong>Transportation</strong> Authority with Union Pacific for increased servicebetween Gilroy and San Jose.parsons CHAPTER 3: DETAILED DEFINITION OF ALTERNATIVES 89
CALTRAIN EXTENSION TO MONTEREY COUNTYALTERNATIVES ANALYSISparsons CHAPTER 3: DETAILED DEFINITION OF ALTERNATIVES 90
CALTRAIN EXTENSION TO MONTEREY COUNTYALTERNATIVES ANALYSISCompared with the Caltrain <strong>Extension</strong> Alternative, the Independent Train Service Alternative wouldbe more expensive, both from a capital and operating perspective. Insofar as capital costs, theIndependent Train Service Alternative would require the purchase of FRA-compliant rolling stock thatwould stand idle for all but five or six hours, 255 weekdays per year. From an operating costperspective, an independent train service would be more costly than the Caltrain <strong>Extension</strong>Alternative, as train crew productivity (vehicle hours of revenue service) would be approximately 50percent of crew paid time. To improve this productivity, Monterey County based trains could replaceor supplement Baby Bullet service throughout the midday.Tables 3-7 and 3-8 list the comparative capital and operating costs for independent train service toSan Francisco versus the extension of existing Caltrain service to Salinas.Table 3-7Capital Costs of Independent Train Service to San Francisco Alternative versusCaltrain <strong>Extension</strong> ($1,000 FY 2007)Independent Train ServiceCaltrain <strong>Extension</strong> AlternativeUPRR main line $35,000 $ 5,000Gilroy yard 4,124 4,124Pajaro station 17,030 17,030Castroville station 16,443 16,443Salinas station 19,856 19,856Salinas bus 9,827 9,827Salinas yard 11,742 11,742Rolling stock 48,000 8,800$162,022 $92,822Source: ParsonsNote: Capital costs exclude unallocated contingenciesTable 3-8Operating and Maintenance Costs of Independent Train Service to San Francisco Alternativeversus Caltrain <strong>Extension</strong> ($ FY 2007)*Independent Train ServiceCaltrain <strong>Extension</strong> Alternative<strong>Rail</strong> operator $ 9,870,000 $3,270,000Fuel 1,796,000 583,000Timetables and tickets 35,000 35,000Insurance 655,000 219,000Facilities and equipment 200,000 160,000Utilities 97,000 97,000UPRR track use charge 1,915,000 1,058,000UPRR slot fees 1,915,000 2,196,000JPB administrative expense — 1,097,000$19,071,000 $8,715,000Source: Parsons* Altamont <strong>Commuter</strong> Express FY 2006–2007 budget is $14 million.parsons CHAPTER 3: DETAILED DEFINITION OF ALTERNATIVES 91
CALTRAIN EXTENSION TO MONTEREY COUNTYALTERNATIVES ANALYSISBus Rapid Transit ServiceBus rapid transit (BRT) has been defined as a rapid mode of transportation that can provide thequality of rail transit and the flexibility of buses. It is an integrated system of stations, equipment,services, running ways, and intelligent transportation system (ITS) elements having a strong imageand identity.The Bus Rapid Transit Practitioner’s Guide 5 identifies the following components and features of busrapid transit systems.“The main features of bus rapid transit systems include:• Dedicated (bus-only) running ways (preferably physically separated from othertraffic)• Accessible, safe, secure, and attractive stations• Easy-to-board, attractive, and environmentally friendly vehicles• Efficient (i.e., off-vehicle) fare collection• ITS applications to provide real-time passenger information, signal priority, andservice command/control• Frequent, all-day service• Distinctive system identity“All BRT systems must have running ways, stations, and vehicles. Other major componentsinclude service design, the fare collection system, the application of ITS technology,and branding. Service design is the key to system design. The individual componentsmust be compatible and must support the service design.“The type of each component varies among systems. Running ways include special physicalfacilities such as busways, and operational treatments such as bus lanes, queuejumps/bypass lanes, and transit signal priority (TSP). Stations can range from smallerpassenger waiting areas with simple shelters to large-scale terminals with many passengeramenities. BRT vehicles typically are large-capacity, stylized vehicles with lowfloorboarding and different degrees of ITS integration, such as automatic vehicle location(AVL), next-stop annunciators, and driver-assist systems. Fare collection systemscan be located either on- or off-board vehicles and can integrate new electronic mediasuch as smart cards. Service design can range from BRT serving as a new line-haulservice with limited stops to BRT serving as a feeder service that extends the reach ofrail transit. Finally, branding the system creates a unique logo, color scheme, and/ormarketing strategy that distinguishes the BRT service from other transit services.”Compared to the Express Bus Alternative, a Bus Rapid Transit Alternative would add dedicated (busonly)running ways, or at least high occupancy vehicle (HOV) lanes, along US 101 from Salinas toMorgan Hill; use advanced design, articulated, low-floor vehicles; and operate throughout the daywith frequencies of service of 15 minutes or less. Given these features, a Bus Rapid TransitAlternative would not be comparable to the Caltrain <strong>Extension</strong> Alternative, and would be far moreexpensive to construct and operate.Adding HOV lanes to US 101 from Main Street in Salinas to Cochrane Road in Morgan Hill, adistance of 38.6 miles would cost on the order of $500 million including necessary bridge and5Draft Report, TCRP Project A-23A, Kittleson & Associates, 2006.parsons CHAPTER 3: DETAILED DEFINITION OF ALTERNATIVES 92
CALTRAIN EXTENSION TO MONTEREY COUNTYALTERNATIVES ANALYSISinterchange reconstruction. Operating the service throughout the day, on 15 minute headways alongthree branch lines from Monterey County to downtown San Jose would require a fleet of 60 vehicles(50 buses operating in maximum revenue service plus 10 spares).Tables 3-9 and 3-10 list the comparable capital and operating costs for the bus rapid transit service todowntown San Jose versus the Express Bus Alternative. While two alternatives are not directlycomparable, the BRT capital costs are more than six times higher than those of the Express BusAlternative, and annual operating costs are nearly twice as high. Given these relative costs, a BusRapid Transit Alternative was removed from further consideration.Table 3-9Capital Costs of Bus Rapid Transit Service to San Jose versus Express Bus Alternative($1,000 FY 2007)Bus Rapid Transit Alternative Express Bus AlternativeUS 101 HOV lanes $500,000 —Pajaro station 7,804 7,804Castroville station 7,290 7,290Salinas station 32,117 32,116Marina station 8,651 8,651Rolling stock 60,000 30,000Maintenance facility 4,800 6,000$620,662 $91,861Source: ParsonsNote: Capital costs exclude unallocated contingenciesTable 3-10Operating and Maintenance Cost of Bus Rapid Transit Service to San Jose versus ExpressBus Alternative ($ FY 2007)Cost Function Basis ServiceChangefrom NoBuildUnitCostWeightedCostFactorBus RapidTransitAnnual CostExpressBusAnnual CostVehicle Operations Hours BRT 207,200 $56.23 1.0 $11,650,856Hours Express 119,294 $56.23 1.0 6,707,902Miles BRT 5,884,480 $0.75 1.0 4,413,360Miles Express 3,858,660 $0.75 1.0 2,893,995Vehicle Maintenance Miles BRT 5,884,480 $1.07 2.0 12,592,787Miles Express 3,858,660 $1.07 1.0 4,128,766Facilities Maintenance MOV BRT 50 $13,752 1.0 687,600MOV Express 50 $13,752 1.0 687,600Stations Stations BRT 4 × 0.40 $89,325 1.0 142,920Stations Express 4 × 0.40 $89,325 1.0 142,920TVM Units BRT 5 × 0.095 $89,325 1.0 42,429Units Express 5 × 0.095 $89,325 1.0 42,429Stores Fleet vehicles BRT 60 × 0.065 $89,325 1.0 348,368Fleet vehicles Express 60 × 0.065 $89,325 1.0 348,368General Administration MOV BRT 50 $54,303 1.0 2,715,150MOV Express 50 $54,303 1.0 2,715,150$32,593,470 $17,667,130Source: Parsonsparsons CHAPTER 3: DETAILED DEFINITION OF ALTERNATIVES 93
CALTRAIN EXTENSION TO MONTEREY COUNTYALTERNATIVES ANALYSISThis page intentionally left blank.parsons CHAPTER 3: DETAILED DEFINITION OF ALTERNATIVES 94
CALTRAIN EXTENSION TO MONTEREY COUNTYALTERNATIVES ANALYSISCHAPTER 4: TRAVEL DEMAND FORECASTSINTRODUCTIONPatronage forecasts are an essential element of analyzing the feasibility of transit service and sizingits program elements. These forecasts are used to define parking and access requirements, level ofservice requirements, vehicle capacity requirements, and to estimate passenger revenues.Typically, patronage forecasts are developed using regional travel forecast models. The Associationof Monterey Bay Area Governments (AMBAG) has recently developed a “3+1 County Model”covering Monterey, Santa Cruz, San Benito and Santa Clara counties. AMBAG has added a “modesplit” model component to this model that could be utilized for analyzing the extension of Caltrainservice to Monterey County; however, the model is not currently validated at the route level of detailand the land use employment data is incompatible between the three counties (San Benito,Monterey, and Santa Cruz) and the +1 county (Santa Clara). As a result, AMBAG’s 3+1 modelinherently attracts a greater proportion of work trips internal to the three counties, and exports fewerwork trips to the San Francisco Bay Area.In addition to this employment data compatibility issue, the mode choice model calibration wascompleted in 1996/1997, and its nested logit coefficients are now considered to be out of the FederalTransit Administration’s (FTA) currently accepted range for New Starts ridership forecasting. The toplevel nesting coefficient (0.65) violates discrete choice model theory since it is smaller than the nextlevel coefficient (0.75).None of the in-vehicle time model coefficients are within FTA guidelines (–0.02 to –0.03). The relationshipsof the other coefficients (e.g., out-of-vehicle travel time/in-vehicle travel time are generallywithin FTA guidelines, however. Use of the AMBAG model for the Caltrain <strong>Extension</strong> project wouldtherefore require significant model recalibration effort.Another recently developed model is maintained by the Santa Clara Valley <strong>Transportation</strong> Authority(VTA). This model, known as the Silicon Valley Rapid Transit Corridor (SVRTC) Model Recalibration,includes Santa Cruz, Monterey, and San Benito, and San Joaquin counties, in addition to SanFrancisco Bay Area counties. This model was recalibrated for the purposes of VTA’s 2005 New Startssubmittal; however, VTA’s New Starts request was withdrawn prior to FTA’s rating. The SVRTCModel Recalibration thus remained uncertified at the time of the Caltrain <strong>Extension</strong> to MontereyCounty Project Study Report (PSR) preparation, upon which this alternatives analysis is based.Notwithstanding this disclaimer, the latest version of the SVRTC Model Recalibration could be used infollow-on work efforts in support of Federal Transit Administration Section 5309 New Starts Criteriainformation submittals.For the purpose of the PSR and this <strong>Alternatives</strong> <strong>Analysis</strong> Report, “sketch planning” and spreadsheetpatronage forecasting methods were employed using the best available information.The remainder of this document presents relevant information which is available for estimatingridership potentials. This information includes Year 2000 census data, available forecasts ofpopulation, jobs, and traffic growth in the U.S. 101 corridor, observed ridership information from ahighly comparable service (e.g., the Altamont <strong>Commuter</strong> Express (ACE)), and some mode shareresearch undertaken by the VTA.parsons CHAPTER 4: TRAVEL DEMAND FORECASTS 95
CALTRAIN EXTENSION TO MONTEREY COUNTYALTERNATIVES ANALYSISDEMOGRAPHIC DATAU.S. Census data is available for Year 2000 regarding population and housing statistics and home-toworkcommuting habits. Additional demographic data is available for future forecast years from theAMBAG and the Association of Bay Area Governments.Figure 4-1 illustrates a series of accessibility “buffers” plotted around each of the proposed Caltrainstations in Monterey County. From the outermost circle, which has a 4.5 mile radius, an automobiledriving at an average speed of 30 miles per hour (mph) would reach the station in approximately10 minutes. From the middle circle, which has a 2.5 mile radius, a shuttle bus traveling at an averagespeed of 15 mph would reach the station in approximately 10 minutes. From the innermost circle,which has a 0.5 mile radius, a pedestrian walking at an average speed of 3 mph would reach thestation in approximately 10 minutes. Residents living beyond the outermost circle would, in manycases, include commuters who were willing to drive more than 10 minutes to get to the transit station.The number of residents living within each of these accessibility buffers was tabulated using socioeconomicdata aggregated by traffic analysis zone (TAZ) as maintained for the AMBAG 4-CountyModel, the predecessor of the 3+1 County Model. The socio-economic data included households,household population, and employment.Fitting the TAZ data into the circular buffers required making some judgments. There were instanceswhere the TAZ area fell within more than one circle (buffer). In such instances, the circle with themajority of the TAZ area was assigned the TAZ data. In other cases, where only a portion of the TAZarea was within any given circle, it was assigned to the buffer using an “all or nothing” approach.Table 4-1 presents the results of this assessment of potential transit markets based on householdpopulation for Year 2000, 2010, 2020, and 2025.Similar to the assessment of “home-based” ridership potential, a tabulation of jobs within easy accessof Caltrain stations was undertaken. Buffers of 0.5-mile, 1-mile, and 2-mile radii were drawn aroundeach of the Caltrain stations located within Santa Clara County. Data from surveys of Caltrain andACE riders indicate that existing riders of commuter rail travel to jobs well beyond the 0.5-mile radiustypically assumed by FTA for its “New Starts” mobility criteria. In Santa Clara County, the presence ofshuttle bus service provided by major employers and the VTA greatly increases the accessibility ofthese commuter rail stations to jobs.Figures 4-2 and 4-3 illustrate the commuter rail station locations and accessibility buffers within SantaClara County. Figure 4-2 includes an ACE station at the Great America theme park within the city ofSanta Clara for reference.Table 4-2 presents a tabulation of jobs accessible to Caltrain stations plus the ACE station at GreatAmerica. Excluding the Great America Station, Caltrain provides transit access to 572,737 jobs withinSanta Clara County as of Year 2000 estimates. Jobs in San Mateo and San Francisco countieswould be in addition. Please note that the tabulation of jobs served by the stations excludes doublecounting due to overlaps of the buffers.parsons CHAPTER 4: TRAVEL DEMAND FORECASTS 96
CALTRAIN EXTENSION TO MONTEREY COUNTYALTERNATIVES ANALYSISFigure 4-1Monterey County Station Locations and Access Buffers645188AA-032parsons CHAPTER 4: TRAVEL DEMAND FORECASTS 97
CALTRAIN EXTENSION TO MONTEREY COUNTYALTERNATIVES ANALYSISTable 4-1Socio-Economic Data with Buffer Information around StationsStations/BuffersCastrovillePajaroSalinasHouseholdPopulation2000 2010 2020 2025PercentShareHouseholdPopulationPercentShareHouseholdPopulationPercentShareHouseholdPopulation0.5-mile buffer 7,682 8,003 8,196 8,5102.5-mile buffer 4,920 5,424 5,850 6,1554.5-mile buffer 3,917 8,516 12,986 15,125PercentShareSubtotal 16,519 7% 21,943 8% 27,032 9% 29,790 9%0.5-mile buffer 5,296 5,485 5,587 5,6432.5-mile buffer 39,407 43,405 47,081 48,9884.5-mile buffer 33,065 36,529 39,733 41,430Subtotal 77,768 33% 85,419 31% 92,401 30% 96,061 29%0.5-mile buffer 13,256 14,742 16,001 16,1192.5-mile buffer 99,493 114,641 127,929 145,7954.5-mile buffer 25,970 35,050 43,566 42,969Subtotal 138,719 60% 164,433 60% 187,496 61% 204,883 62%Total 233,006 100% 271,795 100% 306,929 100% 330,734 100%Source: Parsons 645188-033COMMUTER DATATable 4-3 indicates where Monterey County residents work and how many residents from othercounties work in Monterey County. According to the U.S. Census, the number of persons workingwithin Monterey County declined from 162,079 to 159,157 between 1990 and 2000. The number ofMonterey County residents living and working within Monterey County declined by a larger margin,from 151,520 in 1990 to 146,444 in 2000, a drop of 5,076 intra-county commuters. The number ofMonterey County residents commuting to jobs outside the county grew from 12,750 in 1990 to 18,073in 2000, an increase of 41.7 percent. Most of this growth was directed along the U.S. 101 corridor toSanta Clara, San Benito, and other San Francisco Bay Area counties.Table 4-4 reports forecasts of county-to-county commuting, prepared by Parsons in 2003, AMBAG in2001 and 2005, and the Metropolitan <strong>Transportation</strong> Commission (MTC) in 1988, 2000, and 2004.Based on this compilation of forecasts, estimates of county commuting have been prepared byParsons for potential use by this assessment. Of significance, the AMBAG estimate of Year 2000Monterey to Santa Clara County commuters, used in its 4-County Model, is low by a factor of morethan two based on U.S. Census data. Insofar as the AMBAG 3+1 County Model, AMBAG’s estimateof home based work trips to Santa Clara County indicates no increase between Year 2000 and 2030.This lack of growth occurs due to the incompatibility of the population and employment data used byAMBAG for the three Monterey Bay counties versus the employment data used for Santa ClaraCounty.parsons CHAPTER 4: TRAVEL DEMAND FORECASTS 98
CALTRAIN EXTENSION TO MONTEREY COUNTYALTERNATIVES ANALYSISFigure 4-2Santa Clara County StationLocations and Access Buffers—North CountyTotal Jobs for 2000 and 2025 for Selected Distances from <strong>Rail</strong> StationsStation0.5 Mile Buffer 1.0 Mile Buffer 2.0 Mile BufferID No. Jobs 2000 Jobs 2025 Jobs 2000 Jobs 2025 Jobs 2000 Jobs 20251 4,457 4,597 10,453 11,811 19,868 26,4222 163 97 511 545 1,286 3,3713 1,029 1,713 4,251 7,438 9,132 23,6754 6,340 8,134 17,038 21,569 34,852 44,1015 1,422 1,725 4,155 5,108 12,018 14,5816 2,430 2,990 9,488 11,294 24,527 29,0907 7,736 10,401 38,030 52,196 75,682 104,0418 8,201 10,300 22,350 28,102 99,643 117,4269 2,710 3,069 19,207 23,276 63,905 78,27510 8,224 10,093 35,258 41,327 72,673 84,98111 6,550 7,683 22,393 27,670 51,926 66,48212 8,276 9,813 19,705 23,532 39,483 47,23213 5,007 5,714 18,118 21,588 45,441 53,88214 4,292 4,741 16,156 17,515 43,678 46,76915 12,967 13,693 32,341 34,194 42,528 44,926645188AA-100parsons CHAPTER 4: TRAVEL DEMAND FORECASTS 99645188AA-034
CALTRAIN EXTENSION TO MONTEREY COUNTYALTERNATIVES ANALYSISThis page intentionally left blank.parsons CHAPTER 4: TRAVEL DEMAND FORECASTS 100
CALTRAIN EXTENSION TO MONTEREY COUNTYALTERNATIVES ANALYSISFigure 4-3Santa Clara County StationLocations and Access Buffers—South CountyTotal Jobs for 2000 and 2025 for Selected Distances from <strong>Rail</strong> StationsStation0.5 Mile Buffer 1.0 Mile Buffer 2.0 Mile BufferID No. Jobs 2000 Jobs 2025 Jobs 2000 Jobs 2025 Jobs 2000 Jobs 20251 4,457 4,597 10,453 11,811 19,868 26,4222 163 97 511 545 1,286 3,3713 1,029 1,713 4,251 7,438 9,132 23,6754 6,340 8,134 17,038 21,569 34,852 44,1015 1,422 1,725 4,155 5,108 12,018 14,5816 2,430 2,990 9,488 11,294 24,527 29,0907 7,736 10,401 38,030 52,196 75,682 104,0418 8,201 10,300 22,350 28,102 99,643 117,4269 2,710 3,069 19,207 23,276 63,905 78,27510 8,224 10,093 35,258 41,327 72,673 84,98111 6,550 7,683 22,393 27,670 51,926 66,48212 8,276 9,813 19,705 23,532 39,483 47,23213 5,007 5,714 18,118 21,588 45,441 53,88214 4,292 4,741 16,156 17,515 43,678 46,76915 12,967 13,693 32,341 34,194 42,528 44,926645188AA-100645188AA-035parsons CHAPTER 4: TRAVEL DEMAND FORECASTS 101
CALTRAIN EXTENSION TO MONTEREY COUNTYALTERNATIVES ANALYSISThis page intentionally left blank.parsons CHAPTER 4: TRAVEL DEMAND FORECASTS 102
CALTRAIN EXTENSION TO MONTEREY COUNTYALTERNATIVES ANALYSISTable 4-2<strong>Commuter</strong> <strong>Rail</strong> Access to Employment in Santa Clara CountyRange 0.5 Mile 1.0 Mile 2.0 MilesID No. Station 2000 2025 2000 2025 2000 202515 Palo Alto 12,967 13,693 32,341 34,194 42,528 44,29614 California 4,292 4,741 16,156 17,515 43,678 46,76913 San Antonio 5,007 5,714 18,118 21,588 45,441 53,88212 Mountain View 8,276 9,813 19,705 23,532 39,483 47,23211 Sunnyvale 6,550 7,683 22,393 27,670 51,926 66,48210 Lawrence 8,224 10,093 35,258 41,327 72,673 84,9818 Santa Clara 8,201 10,300 22,350 28,102 99,643 117,4267 San Jose 7,736 10,401 38,030 52,196 75,682 104,0416 Tamien 2,430 2,990 9,488 11,294 24,527 29,0905 Capitol Expressway 1,422 1,725 4,155 5,108 12,018 14,5814 Blossom Hill 6,340 8,134 17,038 21,569 34,852 44,1013 Morgan Hill 1,029 1,713 4,251 7,438 9,132 23,6752 San Martin 163 97 511 545 1,286 3,3711 Gilroy 4,457 4,597 10,453 11,811 19,868 26,4229 Great America 2,710 3,069 19,207 23,276 63,905 78,275Station buffer totals 81,804 96,788 271,454 329,446 638,642 786,649Countywide 1,362,948 1,724,585 1,362,948 1,724,585 1,362,948 1,724,585Percent of county totals 6.0% 5.6% 19.9% 19.1% 46.9% 45.6%Station buffer totals without Great America 77,094 91,694 250,247 303,889 572,737 706,349Percent of county totals without Great America 5.7% 5.3% 18.4% 17.6% 42.0% 41.0%Source: Parsons645188AA-036Table 4-3Monterey County Commuting Trends (1990 and 2000)Commuting 1990 2000 Percent ChangeTotal population 355,660 401,762 +13.0Work in Monterey County 162,079 159,157 –1.8Live and work in Monterey County 151,520 146,444 –3.4Live elsewhere and work in Monterey County 10,559 12,713 +20.4Percent workforce commuting into Monterey County 7% 8% +14.3Live in Monterey County and work elsewhere 12,750 18,073 +41.7Santa Cruz County 6,821 7,601 +11.4Santa Clara County 2,411 5,799 +140.5San Benito County 601 1,187 +97.5San Luis Obispo County 329 540 +64.1Alameda County 246 533 +116.7San Mateo County 173 378 +118.5Fresno County 113 254 +124.8San Francisco County 120 220 +83.3Contra Costa County 83 155 +86.7Los Angeles County 295 134 –54.6Yuma County, Arizona 222 112 –49.5Outside U.S. 262 105 –59.9San Diego County 85 101 +18.8Other Locations 989 954 –3.5Source: U.S. Census645188AA-037parsons CHAPTER 4: TRAVEL DEMAND FORECASTS 103
CALTRAIN EXTENSION TO MONTEREY COUNTYALTERNATIVES ANALYSISTable 4-4Monterey County <strong>Commuter</strong> ForecastsParsonsSan Benito Monterey Santa Cruz Santa Clara Other Bay Area Total <strong>Commuter</strong>s2000 2010 2020 2030 2000 2010 2020 2030 2000 2010 2020 2030 2000 2010 2020 2030 2000 2010 2020 2030 2000 2010 2020 20302003 1,187 1,583 1,978 2,374 146,444 169,803 191,365 209,963 7,601 11,402 13,302 14,252 5,799 12,267 14,051 15,390 1,401 3,002 3,402 3,402 165,912 201,356 228,454 248,111AMBAG2001 524 NA 851 NA 176,750 NA 233,901 NA 8,055 NA 14,418 NA 2,575 NA 5,999 NA 741 NA 1,149 NA 188,645 NA 256,318 NA2005 1,360 NA NA 2,933 125,006 NA NA 197,118 11,398 NA NA 13,997 6,747 NA NA 6,555 1,876 NA NA 4,546 146,387 NA NA 225,149MTC1998 745 1,005 1,201 NA 154,370 187,747 225,960 NA 10,774 11,936 14,687 NA 5,591 6,221 8,093 NA 1,269 1,293 1,799 NA 172,908 208,400 252,000 NA2000 455 600 914 NA 169,941 193,322 217,174 NA 8,547 10,998 17,254 NA 2,676 4,364 8,041 NA 570 863 1,739 NA 182,241 210,226 245,314 NA2004 1,187 1,417 1,663 2,213 146,298 175,035 217,393 245,911 7,593 10,954 12,330 14,652 5,799 9,570 9,705 12,468 1,401 1,979 2,130 2,938 162,509 199,222 243,536 278,601Sources:1. Parsons, 20032. AMBAG Four-County Travel Demand Model; AMBAG 2001. AMBAG 3+1 Regional Travel Demand Model; AMBAG June 2005.3. Metropolitan <strong>Transportation</strong> Commission, <strong>Commuter</strong> Forecasts for the San Francisco Bay Area 1990–2030, Data Summary, September 1998, October 2000, and May 2004.645188AA-038parsons CHAPTER 4: TRAVEL DEMAND FORECASTS 104
CALTRAIN EXTENSION TO MONTEREY COUNTYALTERNATIVES ANALYSISThe census data indicates that the majority of commuters living in Monterey County travel to workduring a two-hour morning peak period (6:30–8:30 AM) as reported in Table 4-5. <strong>Commuter</strong>s leavinghome during the early portion of the peak period would be expected to be traveling greater distances,using the congested U.S. 101 Corridor. These commuters would be traveling during the time whenCaltrain service would operate between Monterey County and the Bay Area. Based on this data, itwas assumed that most of the commuters to Santa Clara, San Mateo, and San Francisco countiesfrom Monterey County and southern Santa Cruz County would travel during this AM peak period.Statewide, the commute pattern is similar.Table 4-5Home to Work Commute (Time Leaving Home)California StateMonterey CountyEstimate Percent Estimate PercentTotal 14,525,322 164,517Work from home 557,036 5,931Work away from home 13,968,286 96.17% 158,586 96.39%Departure Time12:00 AM to 4:59 AM 606,086 4.34% 6,807 4.29%5:00 AM to 5:29 AM 523,209 3.75% 7,971 5.03%5:30 AM to 5:59 AM 692,256 4.96% 7,578 4.78%6:00 AM to 6:29 AM 1,216,867 8.71% 14,024 8.84%6:30 AM to 6:59 AM 1,362,830 9.76% 14,658 9.24%7:00 AM to 7:29 AM 2,006,950 14.37% 22,815 14.39%7:30 AM to 7:59 AM 1,986,831 14.22% 26,013 16.40%8:00 AM to 8:29 AM 1,577,815 11.30% 16,121 10.17%8:30 AM to 8:59 AM 778,152 5.57% 8,159 5.14%9:00 AM to 9:59 AM 972,355 6.96% 10,078 6.35%10:00 AM to 10:59 AM 414,479 2.97% 4,786 3.02%11:00 AM to 11:59 AM 189,005 1.35% 2,302 1.45%12:00 PM to 3:59 PM 865,284 6.19% 9,703 6.12%4:00 PM to 11:59 PM 776,167 5.56% 7,571 4.77%Source: 2000 Census645188AA-039CALTRAIN EXTENSION RIDERSHIP FORECASTFour estimates of Caltrain extension to Monterey County ridership have been made within the recentpast. Valley <strong>Transportation</strong> Authority staff made a preliminary estimate of ridership potential inNovember 1999 based on a survey of major employers conducted in 1997/1998 and an estimate ofmode shares based on express bus data. This estimate is documented in a VTA staff memorandumto the <strong>Transportation</strong> Agency for Monterey County (TAMC) dated November 8, 1999, which is providedin Appendix C of this study for reference. VTA staff estimated a potential for about 304 passengersto board trains extending to Monterey County. Daily ridership (to and from) would be twicethis number. This estimate was based on a commuter base of 1,683 persons residing in MontereyCounty and Watsonville and working in major employment centers within Santa Clara County.parsons CHAPTER 4: TRAVEL DEMAND FORECASTS 105
CALTRAIN EXTENSION TO MONTEREY COUNTYALTERNATIVES ANALYSISDuring the preparation of the <strong>Extension</strong> of Caltrain <strong>Commuter</strong> Service to Monterey County BusinessPlan (August 2000), information was collected for the ACE commuter rail service and compared withCaltrain service and ridership for south Santa Clara County and the proposed extension of service toMonterey County. It appears that ACE is an excellent benchmark for estimating the ridership potentialof the Caltrain extension to Salinas, given the similarity of commute markets and travel impedances.As illustrated in Figure 4-4, ACE provides commuter rail service between three stations in SanJoaquin County (Stockton, Lathrop/Manteca and Tracy), four stations in Alameda County (Vasco,Livermore, Pleasanton and Fremont), and three stations in Santa Clara County (Great America,Santa Clara and San Jose). Excellent ridership data collected from passenger counts and surveys isavailable for comparison with Monterey County service attributes.ACE became operational on October 19, 1998, providing two westbound morning trains and twoeastbound evening trains. On February 21, 2000, an additional train was added to alleviate overcrowdingin the Alameda County-to-Santa Clara segment of the route. This additional service provideda third westbound morning train between the Pleasanton station and San Jose. This level ofservice compared favorably with the initial service proposed for Monterey County and the four roundtrips operated by Caltrain between Gilroy, San Jose, and San Francisco (as of 2000).Monthly fares, ride times, and distances for ACE trips into Santa Clara County are reported in Table4-6. This table also supplies Census 2000 population data for the cities served, station-by-station AMboarding counts, and a calculation of riders (one-way boardings) per capita. The same information isalso presented for the south Santa Clara County stations served by Caltrain and the proposedextension of service to Monterey County. An estimate of riders boarding at Monterey County stationsis reported (in italics) based on a cross-classification technique that compares station serviceattributes with observed rates of boardings per capita.While this estimation technique was simplistic, it was grounded by an array of corridor similarities:• ACE provides service from San Joaquin County and the Tri-Valley area of Alameda County tothree stations in Santa Clara County, serving the heart of Silicon Valley’s employment base.The proposed extension of Caltrain to Salinas would provide mobility to 14 stations in SantaClara County as well as San Mateo and San Francisco County destinations.• As reported by Census 2000, 7,046 residents of San Joaquin County work in Santa ClaraCounty. By comparison, 5,799 residents of Monterey County work in Santa Clara County and598 work in San Mateo or San Francisco County. Santa Cruz County, 17% of whose residentsreside in Watsonville, has 21,540 of its residents employed in Santa Clara County.• The travel time and congestion faced by San Joaquin County commuters to Silicon Valley jobsis similar to that faced by Monterey County commuters.• Housing prices in Tracy and commute times to Silicon Valley are very similar to Salinashousing and commute conditions.Based on this methodology, Parsons estimated that 898 passengers would board trains from stationslocated in Monterey County. This estimate has since been updated based on Census 2000 counts ofpopulation, with Table 4-6 reflecting 1010 northbound riders boarding at Salinas, Castroville andPajaro. Daily ridership would be twice this number.parsons CHAPTER 4: TRAVEL DEMAND FORECASTS 106
CALTRAIN EXTENSION TO MONTEREY COUNTYALTERNATIVES ANALYSISFigure 4-4Altamont <strong>Commuter</strong> Express <strong>Rail</strong> Network645188AA-040parsons CHAPTER 4: TRAVEL DEMAND FORECASTS 107
CALTRAIN EXTENSION TO MONTEREY COUNTYALTERNATIVES ANALYSISTable 4-6Year 2000 <strong>Commuter</strong> <strong>Rail</strong> Corridor AssessmentPrimary Destination—Great America Station Secondary Destination—San JoseACE CorridorPopulation<strong>Commuter</strong> <strong>Rail</strong> Highways <strong>Commuter</strong> <strong>Rail</strong> HighwaysMonthlyMonthlyFare Minutes Miles Minutes Miles Fare Minutes Miles Minutes Miles2000Ridership 1Ridersper CapitaStockton 243,800 $279 126 77 126 76.8 $279 140 80 128 79.8 100 0.0004Lathrop/Manteca 59,700 $235 104 69 114 65.1 $235 118 72 115 68.1 242 0.004Tracy 56,900 $191 90 58 106 54.8 $191 104 61 108 57.8 313 0.0055Livermore (Vasco) 73,345 $147 55 32 83 28.3 $147 70 35 85 31.3 298 0.004Pleasanton 63,654 $147 44 26 68 24.1 $147 58 29 69 27.1 341 0.005Fremont 203,413 $103 22 13 55 16.4 $103 36 16 57 19.4 128 0.0006Total 1,422Primary Destination—San Jose Secondary Destination—SunnyvaleCaltrain CorridorPopulation<strong>Commuter</strong> <strong>Rail</strong> Highways <strong>Commuter</strong> <strong>Rail</strong> HighwaysMonthlyMonthlyFare Minutes Miles Minutes Miles Fare Minutes Miles Minutes Miles2000Ridership 2Ridersper CapitaSalinas 143,776 $142 93 68 98 60.1 $160 103 79 107 68.3 600 0.004Castroville* ~25,000 $124 84 61 93 56.5 $142 94 72 101 60.8 125 0.005Pajaro (Watsonville) 47,649 $106 72 50 81 47.4 $124 82 61 87 51.0 285 0.006Gilroy 41,464 $ 71 47 30 55 32.4 $ 89 57 41 63 40.6 351 0.0085San Martin 4,600 $ 71 38 24 47 26.6 $ 89 48 35 56 34.7 83 0.018Morgan Hill 33,556 $ 71 32 20 45 23.5 $ 89 42 31 53 31.7 383 0.0115Total 1,8271Morning westbound boardings.2Morning northbound boardings. city of origin based on rider survey. Excludes Monterey and San Benito County riders boarding at Gilroy, San Martin and Morgan Hill stations.* Includes passengers traveling from the city of Marina 645188AA-041Italicized data: Estimated ridership boarding at Monterey County stationsSource: Parsonsparsons CHAPTER 4: TRAVEL DEMAND FORECASTS 108
CALTRAIN EXTENSION TO MONTEREY COUNTYALTERNATIVES ANALYSISTwo additional forecasting efforts,undertaken for the preparation ofthe PSR were also used for this<strong>Alternatives</strong> <strong>Analysis</strong>.The VTA methodology of utilizingmode shares based on travel distanceswas applied to the censusestimates of county-to-county commutersand the proportion of SantaClara County’s employment baseserved by the Caltrain stations.Table 4-7 reports VTA’s assumptionsregarding transit mode sharesbased on travel distances, whileTable 4-8 reports trip distances andtravel times between MontereyCounty and select Santa Claradestinations. VTA’s assumptionsare similar to those used in 1997 toestablish the feasibility of theWasatch Front (Salt Lake City)commuter rail service.Estimates of Year 2000 commuterstraveling from Monterey Countyand Watsonville to the Bay Areapeninsula counties served by Caltrainare reported in Table 4-9. Thistable indicates that the number ofcommuters assumed to be serviceableby Caltrans is 50 percent ofthe total, based on the tabulation ofcommuter rail access to employmentreported in Table 4-2.Table 4-7Transit Patronage Based onTrip DistanceTransit PercentDistance in Miles Share30 9.0%40 14.0%50 16.5%60 18.6%>70 20.0%Source:645188AA-042Santa Clara Valley <strong>Transportation</strong> AuthorityWasatch Front <strong>Commuter</strong> <strong>Rail</strong> Feasibility StudyRidership Estimation MethodologyThe approach used to develop the ridership estimates for the Wasatch Frontcommuter rail corridor was based on an origin-destination methodology developedby Schiermeyer Consulting Services (SCS), in Orange, California.The methodology focused on identifying commuter travel patterns to majoremployers (employers with more than 100 employees) within a given corridorand applying a “commuter rail mode split” based on rail miles traveled.To begin, major employers located within an approximate 2-mile radius of aproposed destination station were plotted on a regional map. The 2-mileradius was selected as it represents the distance, a surrogate for traveltime, that most commuters are willing to ride a shuttle to reach their finalemployment destination.Origin zip codes were next identified and assigned to specific boardingstations. The origin zip codes represent the “catchment” area of a specificboarding station and may extend much farther than the city or community inwhich the station is located.All major employers were then contacted by letter with telephone follow-up.They were asked to provide a zip code listing of their employees’ homedestinations. After this data was collected and tabulated, mode split factors(based on rail miles traveled) were applied to the total. This subtotal wasthen factored to account for the lack of small employer data.The mode split factors are based on distances (in rail miles) between theboarding and the destination stations. For trips of 15 to 19 miles, a fivepercent mode split was used, 10 percent for trips greater than 20 miles ormore, 15 percent for trips 30 miles or more, 20 percent for trips 40 miles ormore, 25 percent for trips greater than 50 miles, and 30 percent for tripsgreater than 80 miles.One of the critical assumptions in the SCS methodology is the expectationthat at least three round trips trains will be operated during the peak commutingperiods. Experience in Southern California indicates that for commuterrail to be attractive and to meet the varied number of work shiftswithin a given corridor, at least three operating schedules must be provided.If service is started with less than three operating schedules, ridership canbe expected to be reduced by a minimum of 33 percent.Another critical assumption in the ridership estimation process is that adequatesupporting bus service will be in place. In the best case, the commuterrail ticket, whether single ride, multiple ride, or monthly, should alsoinclude the supporting bus service at both the origin and destination end ofthe trip. For predominantly origin stations, such as those where commutersare boarding the train in the morning for travel to work, supporting busservice is relatively unimportant since experience has shown that most railcommuters are automobile owners and typically drove to work prior to theinauguration of rail passenger service. At destination stations, supportingbus service to ensure a quick trip from the station to the final destination,normally the place of work, is essential. Typical commuters will not sacrificemore than 10 minutes from arrival of the train at the destination station toarrival at their final destination.645188AA-080parsons CHAPTER 4: TRAVEL DEMAND FORECASTS 109
CALTRAIN EXTENSION TO MONTEREY COUNTYALTERNATIVES ANALYSISTable 4-8Trip Distance and Travel Times from Monterey CountyDistance in MilesEgress Stations <strong>Rail</strong> HighwayHighway Minutes(2000)San JoseFrom Pajaro 50.0 47.4 81From Castroville 61.0 56.5 93From Salinas 68.0 60.1 98Average 59.7 54.7 91Sunnyvale/Santa ClaraFrom Pajaro 61.0 51.0 87From Castroville 72.0 60.8 101From Salinas 79.0 68.3 107Average 70.7 60.0 98Source: Parsons645188AA-043Table 4-9Year 2000 <strong>Commuter</strong>s to Caltrain MarketsOriginDestination County Monterey County Watsonville 1 Total Served by Caltrain Transit MarketSanta Clara 5,799 3,662 9,461 50% 4,730San Mateo 378 342 720 50% 360San Francisco 220 106 326 50% 163Total 6,397 4,109 10,506 5,2531Assumes 17% of Santa Cruz County commuters based on population share 645188AA-044Source: 2000 Census, ParsonsTable 4-10 reports that this methodology yields an estimate of 1,028 riders boarding at MontereyCounty stations (AM northbound). In the afternoon, an equal number of riders would board at SanFrancisco Bay Area station and ride south to Monterey County. These riders would be expected toboard from the stations indicated in Table 4-11.Table 4-10Calculation of Potential <strong>Rail</strong> Ridership (VTA Method)Destination County Travel Distance (miles) Mode Share Transit Market Potential RidersSanta Clara—Central 54.7 0.19 1,570 291Santa Clara—North 60.0 0.20 3,161 632San Mateo 80.0 0.20 360 72San Francisco 100.0 0.20 163 33Peninsula Total 5,254 1,028Source: Parsons645188AA-045parsons CHAPTER 4: TRAVEL DEMAND FORECASTS 110
CALTRAIN EXTENSION TO MONTEREY COUNTYALTERNATIVES ANALYSISTable 4-11Caltrain <strong>Extension</strong> Ridership Estimates by Station (VTA Method)Egress/Access Transit <strong>Commuter</strong>s Pajaro Castroville Salinas2000: Percent Share 100% 33% 7% 60%Santa Clara—Central 291 96 20 175Santa Clara—North 632 209 44 379San Mateo 72 24 5 43San Francisco 33 11 2 20Total 1,028 340 72 617Source: Parsons645188AA-046The ACE 2000-onboard passenger survey indicated that there were 395 respondents to the surveywho rode ACE trains to Santa Clara County from San Joaquin County (a survey response rate of 84percent). The data was expanded to the actual number of passengers riding ACE (470) as shown inTable 4-12.The survey also contained information on the destination of riders traveling from San Joaquin toSanta Clara County. Destination data is shown in Table 4-13, reported by zip code. The ACE ridersurvey results were expanded to the actual number of riders traveling to Santa Clara County fromSan Joaquin County.Table 4-12Altamont <strong>Commuter</strong> Express Ridership from San Joaquin County to Santa Clara County—2000 SurveyOrigin StationDestination StationSan Joaquin County Great America San Jose Total Responses Expanded RidersStockton 43 17 60 71Lathrop/Manteca 124 32 156 186Tracy 135 44 179 213Total 302 93 395 470Source: ACE 2000 On Board Passenger Survey645188AA-047Table 4-13Year 2000 <strong>Commuter</strong>s to Caltrain MarketsZipCodeLocationTotalJobs Tracy Stockton Lathrop Total ExpandedPercentShare94089 Lockheed 73,265 10 10 30 6%95050 Santa Clara East 101,205 12 8 20 59 13%95054 Great America 169,480 23 4 14 41 122 26%95134 McCarthy Ranch 147,427 21 9 18 48 143 30%94043 Shoreline 102,739 4 4 12 3%95051 Santa Clara West 110,487 5 5 15 3%94086 Oakmead 50,000 13 13 39 8%95052 Alameda95110 De la Cruz94538 Alviso 7,574 8 8 24 5%95113 Downtown San Jose 33,978 9 9 27 6%95014 Los AltosTotal 806,155 66 22 70 158 470 100%Source: ACE 2000 On Board Passenger Survey 645188-048parsons CHAPTER 4: TRAVEL DEMAND FORECASTS 111
CALTRAIN EXTENSION TO MONTEREY COUNTYALTERNATIVES ANALYSISThe total number of jobs within a 2-mile buffer of the ACE stations (Great America, Santa Clara, andSan Jose Diridon) was previously shown in Figure 4-2. Based on the distribution of rider destinationsreported by the Year 2000 survey of ACE riders, a second graphic was prepared illustrating the areaeffectively serviced by ACE. Figure 4-5 illustrates this expanded buffer of trip destinations for the ACEstations served in Santa Clara County. While the Santa Clara station is additionally served, no tripdestination data was reported for that station by the Year 2000 rider survey. A summary of the totalnumber of jobs surrounding the destination stations is shown in Table 4-14.From the rider destination data presented in Table 4-13, it was observed that 56 percent of the ridersare destined to job locations within approximately two miles of the ACE station. For calculating a triprate based on transit service market, the total number of jobs accessible within a 2-mile buffer wasassumed to be 100 percent. Beyond the 2-mile ring, but within the expanded buffer, 30 percent of thetotal jobs in the outer buffer were assumed to be accessible. The total number of jobs serviced by theACE corridor was therefore estimated to be 242,221 as shown in Table 4-14. The ACE transit servicetrip rate was simply the ratio of the total number of riders to the service market (470/242221) and isequal to 0.0019403.The total number of jobs for the Year 2000 along the Caltrain corridor was a 2-mile buffer of a stationis 572,737 within Santa Clara County. Applying the transit service trip rated developed from the ACEinformation to this Caltrain service market (572,737× 0.0019403) results in an estimate of 1,111transit trips to Santa Clara County from Monterey County. Trips to San Mateo and San Franciscocounties would be in addition.Summary of Ridership ForecastsBased on the three sketch planning methods of estimating ridership, it appears that approximately1,028 patrons could be expected to board Caltrain at stations located within Monterey County, givenYear 2000 commuter patterns. An equal number of riders would board at San Francisco Bay Areastations and ride south to Monterey County. (This estimate now appears to be appropriate for the2010 planning horizon. 5 ) This number of patrons would be expected to double by 2020 to 2030,based on commuter forecasts developed by Parsons and MTC. Table 4-15 provides estimates ofboarding locations within Monterey County and destination stations in the San Francisco Bay Area.Daily ridership would double the estimates of one-way, northbound, AM boardings.Table 4-14Year 2000 <strong>Commuter</strong>s from San Joaquin County Served by Altamont <strong>Commuter</strong> Express Stationsin Santa Clara CountyDestinationStationJobs in 2-MileBufferJobs in OuterBufferEffective Serviceto Outer BufferDiscounted Jobsin Outer BufferTotal JobsServiced by ACEGreat America 63,905 282,059 30% 84,618 148,523San Jose 75,682 60,054 30% 18,016 93,698Total 139,587 342,113 102,634 242,221Source: Parsons645188AA-0505 Chapter 2 of this <strong>Alternatives</strong> <strong>Analysis</strong> discusses commuting trends observed between 2000 and 2005 insofar as gateway traffic volumesand regional rail ridership. Based on this information, it appears that 2006 travel demand conditions are similar to Year 2000 traveldemand conditions with respect to long distance commutes from outlying counties to Silicon Valley employers. Thus, references to Year2000 demand and ridership projections are assumed to be now realized in 2010. Year 2020 ridership projections are assumed to be nowrealized in 2030.parsons CHAPTER 4: TRAVEL DEMAND FORECASTS 112
CALTRAIN EXTENSION TO MONTEREY COUNTYALTERNATIVES ANALYSISFigure 4-5Santa Clara County Altamont <strong>Commuter</strong> Express Station Locations and Access Buffers645188AA-049parsons CHAPTER 4: TRAVEL DEMAND FORECASTS 113
CALTRAIN EXTENSION TO MONTEREY COUNTYALTERNATIVES ANALYSISTable 4-15Future Ridership Forecasts from Monterey CountyAccess StationEgress Transit <strong>Commuter</strong>s Pajaro Castroville Salinas2000: Percent Share 1 100% 33% 7% 60%Santa Clara—Mid 291 96 20 175Santa Clara—North 632 209 44 379San Mateo 72 24 5 43San Francisco 33 11 2 20Total 1,028 340 71 6172006: Percent Share 100% 33% 7% 60%Santa Clara—Mid 395 130 28 237Santa Clara—North 854 282 60 512San Mateo 97 32 7 58San Francisco 44 15 3 26Total 1,390 459 98 8332010: Percent Share 100% 31% 8% 60%Santa Clara—Mid 492 154 40 298Santa Clara—North 1,064 333 86 645San Mateo 121 38 10 73San Francisco 54 17 4 33Total 1,731 542 140 1,0492020: Percent Share 2 100% 30% 9% 61%Santa Clara—Mid 557 167 50 340Santa Clara—North 1,206 362 109 735San Mateo 137 41 12 84San Francisco 63 19 6 38Total 1,963 589 177 1,1972025: Percent Share 100% 30% 9% 61%Santa Clara—Mid 579 174 52 353Santa Clara—North 1,253 376 113 764San Mateo 143 43 13 87San Francisco 64 19 6 39Total 2,039 612 184 1,2432030: Percent Share 100% 30% 9% 61%Santa Clara—Mid 600 180 54 366Santa Clara—North 1,300 390 117 793San Mateo 147 44 13 90San Francisco 67 20 6 41Total 2,114 634 190 1,290Source: Parsons645188AA-05112000 forecast applies to Year 2010 planning horizon.22020 forecast applies to Year 2030 planning horizon.parsons CHAPTER 4: TRAVEL DEMAND FORECASTS 114
CALTRAIN EXTENSION TO MONTEREY COUNTYALTERNATIVES ANALYSISCHAPTER 5: ENVIRONMENTAL ANALYSISIn May 2003, Parsons prepared the Initial Study for the Caltrain <strong>Extension</strong> to Monterey County projectto determine if significant adverse impacts (either short-term or long-term) would result from projectconstruction or operation. The Initial Study was prepared in accordance with the California EnvironmentalQuality Act (CEQA) to provide preliminary environmental investigation of the proposed project.The Initial Study determined that the proposed project may have a significant effect on the environmentand that an Environmental Impact Report (EIR) would be required. Circulation of the InitialStudy and Notice of Preparation identified the following issues of concern, raised by regional andlocal agencies and the public via written responses received regarding the Notice of Preparation.• Purpose and need, policies, funding, alternatives— Associated operating costs and capital costs, and project timeline— Determination of need for the project and discussion of all alternatives considered— Coastal development permit required• Public outreach— Public outreach/environmental justice outreach to minority, migrant and agriculturalcommunity• Visual— Aesthetics qualities or impacts at each station• Air quality— Control and mitigation of construction emissions— Direct and indirect source emissions from operational activities— Project operational and construction particulate matter (PM 10 ) emissions should bequantified— Exposure of air quality impacts to sensitive receptors• Hazards/hazardous materials— Discussion and analysis of any onsite potential hazardous materials• Hydrology/water quality— Potential drainage impacts to Route 183— Discussion of drainage issues and identification of measures that will avoid erosion andthe discharge of polluted runoff both during and after construction— Compliance with Section 404 permits• Land use— Station design in compliance with the Americans with Disabilities Act, safety, and legalrequirements— Discussion of transit-oriented development near stationsparsons CHAPTER 5: ENVIRONMENTAL ANALYSIS 115
CALTRAIN EXTENSION TO MONTEREY COUNTYALTERNATIVES ANALYSIS— Evaluations of the impact of the proposed project on existing Gilroy station andmaintenance yard• Noise— Control and mitigation of construction noise emissions• Traffic— Show project is identified by and consistent with the Monterey County Regional <strong>Transportation</strong>Plan— Consult with Caltrans District 5 staff on the scope of the traffic study area— Show level of services (LOS) methodologies and calculations— Discussion and analysis of existing and cumulative traffic volumes within study area, tripreduction measures, operational/queuing analysis to determine the impact of the proposedproject on traffic operations on Route 183, and recommendations for any new gradecrossings and the need for grade separations or crossings over or under rail lines.— Provide information on proposed service schedule and frequency— Exclusive use of park-and-ride lots at all three stations for train riders— The potential interface between the proposed project and the proposed intercity railservice between San Francisco and Monterey at the Salinas, Pajaro Valley, andCastroville stations.A joint National Environmental Policy Act/California Environmental Quality Act (NEPA/CEQA)document Draft Environmental Assessment/Environmental Impact Report (Draft EA/EIR) wassubsequently prepared. This Draft EA/EIR addressed the Caltrain <strong>Extension</strong> Alternative and No BuildAlternative. The Express Bus Alternative was not addressed by this environmental analysis, as itsphysical facilities are a subset of the Caltrain <strong>Extension</strong> Alternative with three exceptions. TheMarina/California State University–Monterey Bay (CSUMB) park-and-ride lot proposed for theExpress Bus Alternative rests on land owned by the <strong>Transportation</strong> Agency for Monterey County(TAMC) at the site of the former Fort Ord quartermaster industry siding and warehouse facilities. Thesite is currently clear with only final grading required prior to construction of the proposed surfaceparking lot. The proposed Marina/CSUMB Monterey–Salinas Transit (MST) transit center also lies onTAMC-owned land adjacent to the proposed park-and-ride lot. This transit center site lies on landcurrently occupied by a non-historic building, which would be removed. No aspect of the buildingdemolition, transit center construction, park-and-ride lot construction and/or operation is considered tocreate a significant environmental impact. Notwithstanding this assessment, a re-evaluation of theaffected environment for this facility would be required if the Express Bus Alternative is selected asthe locally preferred alternative (LPA).The second aspect of the Express Bus Alternative not addressed by the Draft EA/EIR document isthe proposed expansion of the Frank J. Lichtanski Monterey Bay Operations Center to accommodatethe express bus fleet. This planned facility rests on land owned by MST sufficient in size toaccommodate 60 express buses, in addition to the 170 vehicles for which the facility is beingdesigned. Adoption of the Express Bus Alternative as the LPA would likely necessitate a reevaluationof the affected environment prior to issuance of a record of decision.The third aspect of the Express Bus Alternative not addressed by the Draft EA/EIR document is theoperation of up to 50 express bus vehicles operating over highways and through local streetintersections while traveling between Monterey County and the San Francisco Bay Area. This aspectparsons CHAPTER 5: ENVIRONMENTAL ANALYSIS 116
CALTRAIN EXTENSION TO MONTEREY COUNTYALTERNATIVES ANALYSISof the Express Bus Alternative is likely to be categorically exempt from CEQA regulations and eligiblefor a Programmatic Categorical Exclusion under NEPA. Nevertheless, re-evaluation of Section 3.14of the affected environment (Traffic and Circulation) would likely be warranted if the Express BusAlternative is selected as the LPA.The Administrative Draft Environmental Assessment/Environmental Impact Report was published inNovember 2005 and circulated for public agency review. The document covered all aspects of theCaltrain <strong>Extension</strong> Alternative and nearly all aspects of the Express Bus Alternative as noted above.The joint NEPA/CEQA Draft EA/EIR was circulated for CEQA public review on April 26, 2006. CEQAreview of this document has been completed and the Final EIR was certified on August 23, 2006.Federal Transit Administration review of the Draft EA (NEPA document) will await completion andacceptance of this <strong>Alternatives</strong> <strong>Analysis</strong> and formal LPA selection by TAMC.To aid the reader in understanding the potential impacts posed by the Caltrain <strong>Extension</strong> Alternativeand Express Bus Alternative, the affected environment of the station/park-and-ride sites and thetransit vehicle operating environments are summarized below. Any inconsistency between thissummary and the environmental document is unintentional, and the complete Final EnvironmentalImpact Report, dated July 2006, should be consulted for clarification.TRANSIT VEHICLE OPERATING ENVIRONMENTSFigure 5-1 illustrates the fixed guideway/roadways used by the Caltrain <strong>Extension</strong> Alternative andExpress Bus Alternative and the locations of transit stations. The Caltrain <strong>Extension</strong> Alternative wouldoperate commuter rail passenger trains between Gilroy and Salinas, California over the existingUnion Pacific Coast Line track. North of Gilroy and south of Salinas, passenger freight train servicewould be unaffected. Other than the immediate vicinity of the station sites at Gilroy, Pajaro,Castroville and Salinas, no significant trackwork construction has been identified by Union Pacific<strong>Rail</strong>road (UPRR) to accommodate the Caltrain <strong>Extension</strong> Alternative. Switch and signaling upgradesand track/tie maintenance are anticipated along the existing main line and passing siding tracks.While these railway improvements are anticipated to be eligible for a Programmatic CategoricalExclusion under NEPA, they are nevertheless addressed by the Draft EA.Insofar as this operating environment, potential environmental impacts related to train operationsappear to be confined to air and noise impacts, as construction activities will be minimal. Theparagraphs below describe the operating environment for these potential impact areas. All milepost(MP) notations are based on the UPRR track inventory charts, which are the basis for the at-gradecrossing inventory and numbering system maintained by the California Public Utilities Commission.Maps illustrating this operating environment are provided in Appendix D of this document.Gilroy to PajaroImmediately south of the Gilroy station, the Coast Line track crosses Tenth Street (MP (milepost)81.00) at grade. Commercial and light industry surrounds Tenth Street; there are no sensitivereceptors within 400 feet of the crossing.The line then traverses 0.7 mile of an industrial corridor before crossing Luchessa Avenue (MP 81.70)located in south Gilroy. Commercial and light industry surrounds Luchessa Avenue and there are nosensitive receptors within 400 feet of the crossing. Immediately south of Luchessa Avenue is the U.S.Highway 101 overcrossing (MP 81.88).parsons CHAPTER 5: ENVIRONMENTAL ANALYSIS 117
CALTRAIN EXTENSION TO MONTEREY COUNTYALTERNATIVES ANALYSISFigure 5-1Fixed Guideway/Roadways with Locations of Transit Stations645188AA-060parsons CHAPTER 5: ENVIRONMENTAL ANALYSIS 118
CALTRAIN EXTENSION TO MONTEREY COUNTYALTERNATIVES ANALYSISSouth of the U.S. Highway 101 crossing, the Coast Line passes through commercial and lightindustrial land uses, and then predominately agricultural lands approaching Bolsa Road (MP 83.60).Prior to reaching Bolsa Road, the track curves south after passing Carnadero Road, a crossing that isused primarily by farm machinery. Two houses are adjacent to the track on the west side. At theBolsa Road at-grade crossing, there are three houses within 400 feet of the crossing. There are alsohorse corrals and a stable within 400 feet of the crossing. South of Bolsa Road, farm industry andagricultural lands surround the rail corridor leading to the Bloomfield Road (State Route 25) at-gradecrossing. At this crossing (MP 84.00) there are no sensitive receptors within 400 feet.South of Bloomfield Road (State Route 25), the Coast Line runs in a north/south orientation beforeturning west to traverse the Chittenden Pass. From Bloomfield Road to the U.S. Highway 101overpass (MP 86.36), the line passes through agricultural lands. An historic freight building lies on thewest side of the main line, just south of Bolsa Road. One farm house is adjacent to the railroad at theU.S. Highway 101 overcrossing. South of the U.S. Highway 101 overcrossing, the Coast Line runsparallel to the Pajaro River and passes by the Betabel Recreational Vehicle Resort located just southof the Betabel/Y Road interchange with U.S. 101. On average, there are about 50 RVs in the park,which is east of the Pajaro River, approximately one-half mile from the Coast Line track.Just south of the Betabel Recreational Vehicle Resort, the Coast Line makes a 90 degree turn at MP88.8 and the track runs for four miles as the main line passes through the Santa Cruz Mountainsfollowing the Pajaro River bed. Chittenden Pass, at the west end of the gorge, defines this stretch oftrack. Midway through this segment, Riverside Road (State Route 129) passes under the Coast Lineat MP 90.93. West of the grade separated crossing, about 25 houses lie on the south side of thetrack, accessed by Old Chittenden Road. These houses are located more than 400 feet from thetrack.The Coast Line next passes by the Granite Rock Company quarry, located on the south and eastside of the railroad. The quarry is accessed by Quarry Road which connects with Aromas Road. Twohouses are located more than 400 feet from the track at a private crossing on the west side of thetrack.Just to the west of the quarry, the Coast Line crosses Carpenteria Road at MP 94.50. CarpenteriaRoad provides primary vehicular access to the unincorporated village of Aromas. To the southwest ofthe at-grade crossing lies the Aromas School. Classrooms are beyond 400 feet from the track;however, ball fields are within 400 feet. Houses and a church are all further than 400 feet from thetrack. Traveling west of the school, Kortwright Lane crosses the Coast Line track at MP 95.00 andprovides access to agricultural lands located on the north side of the track.As the Coast Line continues west through agricultural lands and to the San Juan Road at-gradecrossing (MP 96.20), one house is located on the south side of the track within 400 feet of thecrossing. The Coast Line then runs parallel to San Juan Road where two houses lie between the roadand the track. These houses appear to be located about 300 feet from the track. About 0.6 mile westof the San Juan Road crossing, at San Miguel Canyon Road (MP 97.10), two houses on the northside of the track are located about 400 feet distant from the track.Before the Coast Line begins to turn southward at the Watsonville Junction (MP 100.4), thirteenhouses are located along Lewis Road to the south of the two main line tracks. A large, active railroadyard is adjacent to the main line tracks at this location.parsons CHAPTER 5: ENVIRONMENTAL ANALYSIS 119
CALTRAIN EXTENSION TO MONTEREY COUNTYALTERNATIVES ANALYSISPajaro to CastrovilleThe Lewis Road at-grade crossing (MP 100.5) is located at the south end of the Watsonville yard. It isimmediately south of the Pajaro <strong>Rail</strong> Station which is no longer used for passenger rail service. A newCaltrain/Amtrak station is proposed for this location. Adjacent to Lewis Road, on the west side ofSalinas Road, one restaurant/bar and several residences are located approximately 400 feet to thenorthwest of the at-grade crossing. Just north of the Lewis Road crossing, there is also one house onthe east side of the railroad located about 100 feet from the nearest track.South of Lewis Road, the rail line passes through agricultural lands running parallel to Salinas Road.At MP 101.67, Elkhorn Road passes overhead, and there are no sensitive receptors within 400 feet ofthe track.South of Elkhorn Road, the single track approaches the Elkhorn Slough, which extends roughly fromMP 103 to MP 107. As the track travels through the slough, a boat ramp at Kirby Road (MP 104.60)with no sensitive receptors is located within 400 feet.South of Elkhorn Slough, as the Coast Line runs south by southwest, there is an automobile salvageyard just north of Dolan Road that lies about 200 feet from the track. Dolan Road crosses over theCoast Line track at MP 107.95, but is not listed in the California Public Utilities Commission referencefile of main line crossings. One house is located more than 150 feet from the track on the south sideof Dolan Road.South of Dolan Road, the Coast Line runs through agricultural lands until it reaches the State Route(SR) 156 highway overcrossing in Castroville (MP 110.00). Just north of SR 156, a commuter railCaltrain station is proposed for construction. South of the SR 156 overcrossing, the Coast Line runsparallel to Del Monte Road through a mixed industrial/residential neighborhood. In this section oftrack, between SR 156 and Blackie Road, there are about 30 apartments and about 50 houses on thewest side of the track between approximately 200 feet to one-third mile away from the tracks. AtBlackie Road (MP 110.60), industrial land uses surround the at-grade crossing and there are nosensitive receptors within 400 feet of the crossing.Castroville to SalinasSouth of Castroville, the Coast Line runs through agricultural lands and is parallel to SR 183, which isaligned to the west of the Coast Line. At the Espinosa Road at-grade crossing (MP 111.60), threehouses north of Espinosa Road and one house south of Espinosa Road are on the east side of thetrack and within 400 feet of the crossing.South of Espinosa Road, San Jon Road (MP 115.00) crosses the Coast Line track at-grade from theeast, connecting to SR 183. There is one house located to the west of SR 183 within 400 feet of theSan Jon Road crossing.South of San Jon Road, McFadden Road intersects with SR 183 to the west of the rail line. GravesSchool is located adjacent to this intersection but is greater than 150 feet from the track. BetweenMcFadden Road and an old cemetery opposite Boronda Road, there are two houses on the west sideof SR 183, both of which are greater than 150 feet from the track.About one-half mile north of Davis Road (MP 117.23), Boronda Road dead ends about 100 feet fromthe track on the east side. There are no sensitive receptors within 150 feet.parsons CHAPTER 5: ENVIRONMENTAL ANALYSIS 120
CALTRAIN EXTENSION TO MONTEREY COUNTYALTERNATIVES ANALYSISJust north of the Davis Road overcrossing, there is a small housing complex with approximately tenor fewer residential units. These units are west of the track and beyond 150 feet.South of Davis Road, the Coast Line enters the urbanized portion of Salinas. Between Davis Roadand the Salinas Station (MP 118.2), land uses surrounding the rail corridor are primarily industrial,with some commercial. A small number of residential units are located on the south side of the track,adjacent to SR 183, which is known as West Market Street. These residences are located beyond150 feet of the track. A small freight yard is also located adjacent to the Salinas Amtrak Station.TRANSIT STATION ENVIRONMENTSThe Caltrain <strong>Extension</strong> Alternative would construct transit stations at Pajaro and Castroville, expandthe existing Salinas Intermodal <strong>Transportation</strong> Center, construct a Caltrain layover facility in Salinas,and extend the Gilroy station track from Tenth Street to East Luchessa Avenue (approximately 4,600feet). The Express Bus Alternative would construct park-and-ride facilities at Pajaro and Castroville,expand the existing Salinas Intermodal <strong>Transportation</strong> Center, construct a MST Transit Center andpark-and-ride facility at Marina/CSUMB, and increase the size of the planned Frank J. LichtanskiMonterey Bay Operations Center located on the lands of the former Fort Ord in Marina.The environmental setting of each of these sites is described below.Pajaro Station/Park-and-Ride Site (Watsonville Junction)Located at the site of Watsonville Junction, the Pajaro passenger station site is on the nearly levelfloodplain of the Pajaro River near the unincorporated community of Pajaro just southeast of thePajaro River and the Santa Cruz County line. The city of Watsonville is just northwest of the site andacross the river. The Monterey County General Plan maps this site as light industrial. Zoning is LightIndustrial–Coastal Zone. The Pajaro site is a developed parcel located along the UPRR corridor in aprimarily agricultural setting. There are no trees on the project site. The site has been graded andsupports only weedy growth in places. The site was previously used as a railroad storage yard andtrain depot and small piles of wood and other debris have been observed on site. The existing stationis currently in use as a railroad storage yard and for limited office use.The Pajaro station site is located along the east side of Salinas Road, in between Salinas Road andthe UPRR (see Figure 5-2). The site includes the former Pajaro passenger station (which is currentlyused by UPRR for yard operations) and a small toolshed and is bounded by industrial and agriculturalland. The topography of the site and larger area is generally flat. To the north of the site lieundeveloped UPRR lands and yard track, with the former Smuckers processing plant in the distance.To the west lay three residential buildings and an agricultural field with row crops. To the south of thesite is undeveloped railroad right-of-way and agricultural fields. To the east is undeveloped landwhich may have been in agricultural use at one time. An industrial building can be seen on the aerialphotograph next to the field.Within the immediate project area, Salinas Road is a four-lane arterial roadway that supportscommercial, residential, and industrial/manufacturing uses. North of the project site, industrial/manufacturing uses are located along the UPRR corridor and along Salinas Road. UPRR supportstructures and equipment storage areas are located within the boundary of the project site. A buildingthat formerly served as the Southern Pacific Station is located on the proposed station location. Thepresent stucco, one-story, Moderne-style passenger station was built in 1942 as a replacement forparsons CHAPTER 5: ENVIRONMENTAL ANALYSIS 121
CALTRAIN EXTENSION TO MONTEREY COUNTYALTERNATIVES ANALYSISFigure 5-2Pajaro Site Locationparsons CHAPTER 5: ENVIRONMENTAL ANALYSIS 122
CALTRAIN EXTENSION TO MONTEREY COUNTYALTERNATIVES ANALYSISthe former Pajaro passenger station. The building is used by UPRR yard personnel and is indisrepair, with the majority of the fenestration boarded. The passenger station is currently not inpublic service and would be removed by the county to construct a community center/station building.The building is not historic.Only freight operations have been continuous since the opening of the railroad line in July of 1871.Along with the passenger station, a small, adjunct metal <strong>Rail</strong>road Express Agency operations buildingand weathered wood-framed Southern Pacific smoke house (also known as the tool building), locatedto the south and to the north of the station building, respectively, are the only structures remaining onthe former Southern Pacific <strong>Rail</strong>road site. Commercial and a few residential properties are locatedalong Salinas Road in the project area; however, most of the surrounding land use to the east, south,and west is agricultural.Castroville Station/Park-and-Ride SiteThe community of Castroville is located in northern Monterey County, at the northern end of theSalinas Valley. Castroville is approximately 8 miles northeast of the city of Salinas, 5 miles west of thecommunity of Prunedale and is located at the junction of three major tourist and commuter-servinghighways (Highway 1, Highway 156 and Highway 183). Castroville is surrounded by agricultural landand is the center of the largest artichoke-growing region in the world. The community remainspredominately agricultural in its land use character and industries.The Castroville passenger station site is at the edge of an agricultural swale that lies just north of theSR 156 overcrossing of the UPRR main line on the east side of the unincorporated community ofCastroville (see Figure 5-3). Agricultural land makes up most of the site and all the lands to the north,and is bordered on the south by the Caltrans SR 156 transportation corridor and the stubs of CollinsRoad and Benson Road. The General Plan maps this site as Agricultural Preservation–Coastal. Thesite is designated farmland in the North County Area Plan. The site includes the following agriculturalzoning designations: Coastal Agricultural Preserve (Coastal Zone), Resource Conservation (CoastalZone), and Farmland, 40-acre minimum.The California Coastal Commission was established by voter initiative in 1972 (Proposition 20) andwas made permanent by the legislature through adoption of the California Coastal Act of 1976. TheCoastal Commission, in partnership with coastal cities and counties, plans and regulates the use ofland and water in the Coastal Zone. Development activities, which are broadly defined by the CoastalAct to include (among others) construction of buildings, divisions of land and activities that changethe intensity of use of land or public access to coastal waters, generally require a coastal permit fromeither the Coastal Commission or the local government. The policies of the Coastal Act constitute thestatutory standards applied to planning and regulatory decisions made by the Commission and bylocal Governments, pursuant to the Coastal Act. Implementation of Coastal Act policies isaccomplished primarily through the preparation of Local Coastal Programs that are required to becompleted by every county and city located within the Coastal Zone. Completed Local CoastalPrograms must be submitted to the Commission for review and approval. A Local Coastal Programincludes a land use plan that prescribes land use classifications, types and densities of allowabledevelopment, goals and policies concerning development and zoning ordinances necessary toimplement the plan. Amendments to certified land use plans and Local Coastal Programs onlybecome effective after approval by the Commission.The Castroville site is located within the Coastal Zone. Therefore, development within this area mustbe consistent with policies of the Coastal Act.parsons CHAPTER 5: ENVIRONMENTAL ANALYSIS 123
CALTRAIN EXTENSION TO MONTEREY COUNTYALTERNATIVES ANALYSISFigure 5-3Castroville Site Locationparsons CHAPTER 5: ENVIRONMENTAL ANALYSIS 124
CALTRAIN EXTENSION TO MONTEREY COUNTYALTERNATIVES ANALYSISAlthough the site is currently agricultural, it has been identified in the Castroville Community Plan asan opportunity area. The plan designates the site as a “<strong>Commuter</strong> Train Station Opportunity Area”and the EIR for the plan will evaluate the impacts of a train station at a programmatic level. The planstates that, “The proposed train station…would serve as a focal point for surrounding proposedresidential development.”Salinas Intermodal <strong>Transportation</strong> Center and Caltrain Layover FacilityThe proposed expansion of the Salinas Intermodal <strong>Transportation</strong> Center and Caltrain LayoverFacility would be located on a site west of the intersection of Main Street/Salinas Avenue and MarketStreet, on land occupied by the existing Salinas Amtrak station and adjacent industrial andcommercial properties. This area is totally urbanized within the limits of the city of Salinas (see Figure5-4). The Salinas General Plan maps this site as General Commercial/Light Industrial. Zoning isCommercial District/Industrial Business Park or Industrial General District. The Amtrak station is asingle-story structure that faces south, and is set back one short block north of Market Street. Thehistoric Southern Pacific passenger station, currently the Salinas Amtrak station, was built in 1942 asa replacement of the earlier Salinas (circa 1901) colonnade-style passenger station.The Amtrak station is shown on Figure 5-5. The historic freight depot building is the original SouthernPacific standard-design freight house (station), built in 1872 and is located adjacent to the Amtrakstation to the west. The freight depot is a board and batten structure, which exhibits superficialmodifications to the roof, west and north elevation and surface cladding. The freight station iscurrently not in service and the majority of the windows are boarded. The freight depot is shown inFigure 5-6. A paved, surface parking lot and industrial building are located further west, fronting theexisting train tracks.Located to the east of the Amtrak station are a historic Southern Pacific locomotive steam engine andwood caboose sited parallel to the tracks, and a single-story warehouse structure that was originallythe Southern Pacific <strong>Rail</strong>way Express Agency building, built in 1919, which has been appropriatelyrenovated. The historic caboose is shown in Figure 5-7. The historic Harvey-Baker House, aVictorian-style residence that was the home of the first Mayor of Salinas, and its ancillary building,were built in 1886 and are located further east, in the northeast corner of the site.The Harvey-Baker House was relocated from its original location to this site around 2000 in an effortby the city of Salinas to centralize tourist destinations near the Amtrak station. Another tourist destination,the National Steinbeck Center, is located southeast of the Intermodal <strong>Transportation</strong> Center site,on the southeast corner of Salinas Street and Market Street. The National Steinbeck Center drawstourists from around the globe, and at the same time is a focal point for activities in education, historyand the arts with the city.An on-site, paved surface parking lot stretches from in front of the Harvey-Baker House to thecaboose, Amtrak station, and freight depot. Commercial office properties and paved surface parkinglocated south–southwest and southeast of the Amtrak station comprise the remainder of the site. Ashort block of early-1900, one-story, storefront commercial buildings (El Aguila Bakery, Market andWarehouse) flank the north side of Market Street between Station Place and the proposed LincolnAvenue extension. These buildings were originally separate establishments, but have beenreconfigured over the years to allow expansion of the market and bakery. Presently, these buildingsrepresent one expanded building. To the east fronting Station Place is a one-story, wood-framed,commercial building that used to be a grocery store, but is now a fish market and café. The WaldorfHotel, built in 1898 as a rooming house, is a two-story, wood-framed, vernacular Victorian-styleparsons CHAPTER 5: ENVIRONMENTAL ANALYSIS 125
CALTRAIN EXTENSION TO MONTEREY COUNTY PASSENGER RAIL STATIONSALTERNATIVES ANALYSISFigure 5-4Salinas Site Locationparsons CHAPTER 5: ENVIRONMENTAL ANALYSIS 126
CALTRAIN EXTENSION TO MONTEREY COUNTY PASSENGER RAIL STATIONSALTERNATIVES ANALYSISFigure 5-5Salinas Amtrak Stationbuilding. The original simple rectangular-plan frontgable façade exhibits multiple additions and alterationsas evidenced by the hipped roof extensionfronting Station Place.Figure 5-6Salinas Historic Freight DepotFigure 5-7Salinas Historic Caboose645188AA-072645188AA-070645188AA-071The National Steinbeck Center and an adjacentrow of 1880 vintage Victorian two-story storefrontbuildings front the south side of Market Street,across from the site.On the west side of the El Aguila building is an onsite,paved surface parking lot that fronts MarketStreet and is in front of the renovated GranaryBuilding. A three-story, modern office building(remodeled Granary Building) is located betweenthe parking lot and the freight depot. Additionalindustrial properties, including the American SupplyCompany distribution facility, are located furtherwest of Palmetto Street.Marina/CSUMB MST Transit Center andPark-and-RideThe Express Bus Alternative includes constructinga transit center/park-and-ride facility in the city ofMarina, in addition to a facility located in Castroville,adjacent to SR 156. The parking supplywould be apportioned between the two locationsand sized to be equal to the Caltrain <strong>Extension</strong>Alternative transit station at Castroville.The proposed Marina/CSUMB Transit Center andPark-and-Ride would be located at the former FortOrd in the city of Marina. The facility would beadjacent to Highway 1 on land formerly occupiedby military quartermaster warehouses, industrysiding track, and a print shop.In 1994, the United States Army closed militaryoperations at Fort Ord as part of the Base Realignmentand Closure process of the Departmentof Defense after 80 years of operation as an infantrytraining installation.To address these economic and environmentalchallenges, the Base Realignment and Closureprocess led to the formation of the Fort Ord ReuseAuthority (FORA) as an agency of the State ofCalifornia, and the approval of a Ford Ord ReusePlan. FORA’s objective is to plan for and facilitateparsons CHAPTER 5: ENVIRONMENTAL ANALYSIS 127
CALTRAIN EXTENSION TO MONTEREY COUNTY PASSENGER RAIL STATIONSALTERNATIVES ANALYSISthe reuse for civilian purposes of a major part of the lands of the former Fort Ord and in particular tofinance deconstruction, provide environmental mitigation, new infrastructure and to foster economicdevelopment on the Peninsula.At the same time, approximately 1,500 acres of the fort were conveyed to the California State Universitysystem to provide a campus for California State University Monterey Bay, and various parcels ofland within Fort Ord have been conveyed by the Department of Defense via the Department of theInterior to the cities of Marina and Seaside, MST, and TAMC.These land transfers have been subjected to the U.S. Army’s process, defined as “Finding ofSuitability for Transfer,” to confirm its environmental status as safe for the civilian uses contemplatedby the FORA. This process includes the U.S. Environmental Protection Agency and the Departmentof Toxic Substance Control of the State. These lands have now been conveyed as either publicbenefit conveyances or economic development conveyances.Figure 5-8 illustrates the location of the proposed Marina/CSUMB MST Transit Center and Park-and-Ride. Lands designated as transit-oriented development will be jointly or cooperatively developed byMarina, TAMC and MST. The park-and-ride and MST Transit Center lie on lands conveyed to TAMC.East of First Avenue, a mixed use development (University Villages) is currently under construction.Lands identified for the park-and-ride facility are currently clear of all buildings. The land identified forthe MST Transit Center is currently occupied by a non-historic structure (see Figure 5-9).Environmental cleanup of the groundwater under the site continues by way of the Army Corps ofEngineers’ pump-and-treat system, which extracts groundwater from the shallow aquifer, purifies itand re-injects it underground. This process will continue for 15 or more years.Obsolete and abandoned Army buildings remain on the TAMC, MST and city of Marina landsidentified for a transit oriented development, together with above ground infrastructure and parkingareas.Deconstruction and removal of these materials, including some hazardous materials, are theresponsibility of FORA. The Caltrain <strong>Extension</strong> to Monterey County Draft Environmental ImpactReport does not address the Marina/CSUMB MST Transit Center and Park-and-Ride facilitydiscussed above. This information is provided to assess environmental risks (or lack thereof)associated with the Express Bus Alternative.Frank J. Lichtanski Monterey Bay Operations Center ExpansionAs the reuse plan for the former Fort Ord unfolds, the demands on the region’s transportationinfrastructure and services will greatly increase. MST has outgrown both of its operating divisions inMonterey and Salinas. Fleet expansion to meet growing community needs requires upgradedmaintenance, operations and administrative facilities to provide adequate support. On January 13,2003, MST received quit claim deeds from the United States Department of the Army for threeparcels of the former Fort Ord Military Reservation. A portion of this acreage will serve as the site ofthe Frank J. Lichtanski Monterey Bay Operations Center. Figure 5-10 illustrates the proposed site ofthe operations center. Approximately one-half of the site is paved and the other one-half remainsundeveloped. Responsibilities for environmental cleanup are as noted above. Implementation of theExpress Bus Alternative would require an expansion of the Frank J. Lichtanski Monterey BayOperations Center or reuse of existing MST facilities in Monterey and/or Salinas. Environmentalissues associated with these expansion or reuse options are expected to be minimal.parsons CHAPTER 5: ENVIRONMENTAL ANALYSIS 128
CALTRAIN EXTENSION TO MONTEREY COUNTY PASSENGER RAIL STATIONSALTERNATIVES ANALYSISFigure 5-8Marina/CSUMB Site Location645188AA-061parsons CHAPTER 5: ENVIRONMENTAL ANALYSIS 129
CALTRAIN EXTENSION TO MONTEREY COUNTY PASSENGER RAIL STATIONSALTERNATIVES ANALYSISFigure 5-9Marina/CSUMB Monterey-Salinas Transit Center and Park-and-Ride Facility Site Map and Photographic Views645188AA-062parsons CHAPTER 5: ENVIRONMENTAL ANALYSIS 130
CALTRAIN EXTENSION TO MONTEREY COUNTY PASSENGER RAIL STATIONSALTERNATIVES ANALYSISFigure 5-10Frank J. Lichtanski Monterey Bay Operations Center Site Location645188AA-077parsons CHAPTER 5: ENVIRONMENTAL ANALYSIS 131
CALTRAIN EXTENSION TO MONTEREY COUNTY PASSENGER RAIL STATIONSALTERNATIVES ANALYSISENVIRONMENTAL JUSTICEUnder Executive Order 12898, effective February 1994, consideration of environmental justiceinvolves an examination of income and ethnicity patterns in relation to the environmental impacts ofplanning and development decisions to determine whether governmental actions createunreasonable biases that disadvantage low-income and/or minority residents or provide advantagesto higher-income or non-minority residents.Racial and Ethnic PopulationsMonterey CountyThe communities of Pajaro and Castroville are unincorporated areas of Monterey County. Accordingto the findings of the 2000 U.S. Census, approximately 47 percent of Monterey County’s population(unincorporated and incorporated areas) was identified as being of Hispanic/Latino background. Ofthe total 401,762 persons reported in the 2000 U.S. Census data for Monterey County, 187,969identified themselves as of Hispanic/Latino background and the remaining 213,793 persons wereidentified as non-Hispanic/Latino (Monterey County, 2003).SalinasBased on the 2000 U.S. Census, the city’s population is 64 percent Hispanic, 45 percent Caucasian,6 percent Asian, 3 percent African-American, and 1 percent Native American.Figure 5-11 illustrates the distribution of population and race by census block group relative to theCaltrain <strong>Extension</strong> Alternative and Express Bus Alternative station sites. The graphic illustratesrelatively high concentrations of racial and ethnic populations that would be served by the proposedinvestments.Income LevelsMonterey CountyThe 2000 U.S. Census data reports median income for the calendar year 1999. According to thatdata, the median household income for Monterey County was $48,305 annually. The informationbelow compares Monterey County’s median household income with that of neighboring counties andthe state (Monterey County, 2003).Geographic Area 1999 Median Household IncomeMonterey County $48,305Santa Cruz County $53,998San Luis Obispo County $42,428Santa Clara County $74,335State of California $47,493Source: U.S. Census, 2000645188AA-096parsons CHAPTER 5: ENVIRONMENTAL ANALYSIS 132
CALTRAIN EXTENSION TO MONTEREY COUNTY PASSENGER RAIL STATIONSALTERNATIVES ANALYSISFigure 5-11Monterey Bay Area Population and Race645188AA-063parsons CHAPTER 5: ENVIRONMENTAL ANALYSIS 133
CALTRAIN EXTENSION TO MONTEREY COUNTY PASSENGER RAIL STATIONSALTERNATIVES ANALYSISAt the time that the Monterey County Housing Element was prepared (2003), the 2000 U.S. Censusdata regarding household income according to the income categories of lower, moderate and abovemoderate was not yet available. Based on 1990 U.S. Census Data for the County of Monterey(unincorporated and incorporated areas), approximately 22 percent of all households could beconsidered very low income and another 19 percent of households as low income.The State of California, Department of Finance, has estimated that there were 34,762 households asof January 1, 2002 in the unincorporated areas of Monterey County. The chart below demonstratesthe estimated number of households by income category using the 1990 household incomepercentage distributions as applied to the 2002 Department of Finance household estimates.HouseholdIncome:VeryLowLowModerateAboveModerateUnincorporatedArea TotalNumber of Households 7,648 6,605 8,690 11,819 34,762(Percentage of Total) 22% 19% 25% 34% 100%645188AA-097Information provided in the Housing Element (Monterey County, 2003) indicates that the two majorindustries in Monterey County are tourism and agriculture. The average annual wage in the“agricultural industry cluster” in Monterey County is approximately $18,608, which is considered verylow income for households of two persons or more. Tourism related jobs also pay very low wages.Households with members who rely on employment in either or both of these fields could beexpected to qualify as either very low or low income, depending on household size.SalinasThe 1990 U.S. Census indicates that 49.85 percent of Salinas’ population is of low and moderateincome. The city of Salinas’ economy is predominantly agriculturally oriented, with relatively lowskilled,low-paying jobs (City of Salinas, 2002).Figure 5-12 illustrates the distribution of population by block group above and below income povertylevels according to the 2000 census. The graphic illustrates concentrations of lower income familieswhich would be served by the proposed transit investment.Table 5-1 summarizes the environmental impacts and mitigation measures proposed for the project.The complete Draft Environmental Assessment dated April 2007 is incorporated with this<strong>Alternatives</strong> <strong>Analysis</strong> by reference. With implementation of the proposed mitigations, the Caltrain<strong>Extension</strong> to Monterey County would pose no significant environmental impact. (Beneficial impacts ofthe Caltrain <strong>Extension</strong> Alternative and Express Bus Alternative are addressed in Chapter 8.)Insofar as the Express Bus Alternative, the express bus transit vehicles would operate over existinglocal streets and state highways (U.S. 101, SR 1, SR 129, SR 156, and SR 183). Other than accessto the park-and-ride sites themselves, bus operation over state highways would be eligible for aProgrammatic Categorical Exclusion under NEPA.parsons CHAPTER 5: ENVIRONMENTAL ANALYSIS 134
CALTRAIN EXTENSION TO MONTEREY COUNTY PASSENGER RAIL STATIONSALTERNATIVES ANALYSISFigure 5-12Monterey Bay Area Population by Poverty Level645188AA-064parsons CHAPTER 5: ENVIRONMENTAL ANALYSIS 135
CALTRAIN EXTENSION TO MONTEREY COUNTY PASSENGER RAIL STATIONSALTERNATIVES ANALYSISTable 5-1Summary of Impacts and Mitigation MeasuresImpact3.1. Visual ResourcesVR-1: Will the Project have a substantialeffect on a scenic vista?VR-2. Will the Project substantiallydamage scenic resources along adesignated scenic highway?VR-3: Will the Project substantiallydegrade the existing visual character orquality of the site and its surroundings?VR-4: Will the Project create a newsource of substantial light or glare whichwould adversely affect day or nighttimeviews in the area?VR-C1: Will the project have significantcumulative aesthetic impacts?3.2. Air QualityAQ-1: Would the project conflict with orobstruct implementation of the applicableair quality plan?AQ-2: Would the project violate any airquality standard or contribute substantiallyto an existing or project air qualityviolation?AQ-3: Would the project expose sensitivereceptors to substantial pollutantconcentrations?AQ-4: Would the project create or exposea substantial number of people toobjectional odorsPre-mitigationSignificanceLess thansignificantNo impact-AlternateCastroville Site;Potentiallysignificant - LPASignificantPotentiallysignificantPotentiallysignificantLess thansignificantLess thansignificantLess thansignificantMitigation MeasureNo mitigation necessary.No mitigation necessary.VR-2: Conduct a final designreview and analysis for CastrovilleSite No. 2.VR-3a: Incorporation of designstandards to preserve historicvisual character of the area.VR-3b: Design parking to becompatible with surroundingcharacter and setting.VR-4: Prepare an ExteriorLighting Design, in accordancewith Monterey County GeneralPlan Policy ER-9.8, along withimplementation of MitigationMeasure VR-2, conduct a visualimpact analysis of affectedresidential properties.Implement Mitigation MeasuresVR-3a and VR-3b, as shownabove.No mitigation necessary.No mitigation necessary.No mitigation necessary.Significance afterMitigationLess thansignificantNo impactLess thansignificantLess thansignificantLess thansignificantLess thansignificant.Less thansignificantLess thansignificantLess thansignificantNo impact No mitigation necessary. No impactparsons CHAPTER 5: ENVIRONMENTAL ANALYSIS 136
CALTRAIN EXTENSION TO MONTEREY COUNTY PASSENGER RAIL STATIONSALTERNATIVES ANALYSISImpactAQ-C1: Would the project result in acumulatively considerable net increase ofany criteria pollutant for which the projectregion is nonattainment under anapplicable federal or state ambient airquality standard (including releasingemissions which exceed quantitativethresholds for ozone precursors)?3.3. Biological ResourcesBIO-1: Will the project cause loss ofindividuals or occupied habitat ofendangered, threatened, or rare fish,wildlife or plant species?BIO-2: Will the project cause loss ofindividuals of CNPS List 2, 3, or 4 plantspecies?BIO-3: Will the project cause loss ofactive raptor nest or other breeding sites?BIO-4: Will the project cause apermanent loss of sensitive wildlifehabitats?BIO-5: Will the project cause apermanent loss of sensitive native plantcommunities?BIO-6: Will the project substantiallyblock or disrupt major fish or wildlifemigration or travel corridors?BIO-7: Will the project conflict with theprovisions of an adopted HabitatConservation Plan, Natural CommunityConservation Plan, or other approvedlocal, regional, or State habitatconservation plan?BIO-8: Will the Project destroy wetlandsor waters of the U.S. or waters of theState?BIO-C1: Will the project have significantcumulative impacts to biologicalresources?3.4. Cultural ResourcesPre-mitigationSignificanceLess thansignificantPotentiallysignificantLess thansignificantLess thansignificantLess thansignificantMitigation MeasureNo mitigation necessary.BIO-1: Conduct floristicallybasedspecial-status plant surveysfor Congdon’s tarplant atCastroville sites and if found,redesign the project to avoid theplants or provide compensationand habitat restoration.No mitigation necessary.No mitigation necessary.No mitigation necessary.Significance afterMitigationLess thansignificantLess thansignificantLess thansignificantLess thansignificantLess thansignificantNo impact No mitigation necessary. No impactNo impact No mitigation necessary. No impactNo impact No mitigation necessary. No impactNo impact –AlternateCastroville SitePotentiallysignificant - LPALess thansignificantNo mitigation necessary.BIO-8: Avoid wetlands to theextent feasible and compensatefor any wetlands that cannot beavoided.No mitigation necessary.No impactLess thansignificantLess thansignificantparsons CHAPTER 5: ENVIRONMENTAL ANALYSIS 137
CALTRAIN EXTENSION TO MONTEREY COUNTY PASSENGER RAIL STATIONSALTERNATIVES ANALYSISImpactCR-1: Will the project cause asubstantial adverse change in thesignificance of historical resources asdefined in Section 15064.5?CR-2: Will the project cause asubstantial adverse change in thesignificance of an archaeological resourcepursuant to Section 15064.5?CR-3: Will the project directly orindirectly destroy a unique paleontologicalresource or site or unique geologicalfeature?CR-4: Will the project disturb anyhuman remains, including those interredoutside of formal cemeteries?CR-C1: Will the project have the potentialto have a cumulative impact on culturalresources?3.5. Geology, Soils, and SeismicityGEO-1: Will the Project be located withinan area of unstable slope conditions?GEO-2: Will the Project be located withinan area of unstable slope conditions?GEO-3: Will the Project be located inareas with soils and groundwaterconditions that are susceptible toliquefaction during an earthquake?GEO-4: Will earthquake-induced strongground shaking damage Project facilities?GEO-5: Will construction of the Projectcause off-site water-related soil erosion?GEO-6: Will the Project be exposed todamage due to expansive soils?GEO-C1: Will the Project have thepotential to have a cumulative geologichazard impact?Pre-mitigationSignificanceSignificant.SignificantMitigation MeasureCR-1: Adhere to the Secretary ofthe Interior’s Standards for theTreatment of Historic Properties(36 CFR Part 68).CR-2: Protect archaeologicalresources.Significance afterMitigationLess thansignificantLess thansignificantNo impact No mitigation necessary. No impactSignificant CR-4: Protect human remains. Less thansignificantNo impact No mitigation necessary. No impactNo impact No mitigation necessary. No impactNo impact No mitigation necessary. No impactPotentiallysignificantPotentiallysignificantGEO-3: Minimize risk ofliquefaction damage by applyingstandard design and constructionpractices.GEO-4: Minimize damage due toground shaking by applyingstandard structural engineeringdesign and construction practices.Less thansignificantLess thansignificantNo impact No mitigation necessary. No impactLess thansignificantLess thansignificantNo mitigation necessary.No mitigation necessary.Less thansignificantLess thansignificant3.6. Hazards and Hazardous MaterialsHM-1: Will the Project create a hazardto the public or the environment throughthe routine transport, use or disposal ofhazardous materials?Less thansignificantNo mitigation necessary.Less thansignificantparsons CHAPTER 5: ENVIRONMENTAL ANALYSIS 138
CALTRAIN EXTENSION TO MONTEREY COUNTY PASSENGER RAIL STATIONSALTERNATIVES ANALYSISImpactPre-mitigationSignificanceMitigation MeasureSignificance afterMitigationHM-2: Will the Project create a hazardto the public or the environment throughreasonably foreseeable upset andaccident conditions involving the releaseof hazardous materials?Less thansignificantNo mitigation necessary.Less thansignificantHM-3: Will the Project releasehazardous emissions or handle hazardousor acutely hazardous materials,substances, or waste within one-quartermile of an existing or proposed school?Less thansignificantNo mitigation necessary.Less thansignificantHM-4: Will the Project expose workersor the public to hazards from a knownhazardous waste site as identifiedpursuant to Government Code Section65962.5 (Cortese List)?SignificantHM-1a: Update Phase I SiteAssessment summarizingreported releases of hazardousmaterials within the project areaprior to construction.HM-1b: Monitor soil andgroundwater during constructionfor evidence of hazardous waste.HM-1c: Containerize and testsuspect soil and groundwater priorto disposal.HM-1d: Inspect and Test for ACMand lead-based paint.Less thansignificantHM-C1: Will the project have the potentialto have a cumulative impact on hazardousmaterials or hazardous wastemanagement?Less thansignificantNo mitigation necessary.Less thansignificant3.7. Hydrology and Water QualityHYDRO-1: Will the Project violate anysurface water or groundwater qualitystandards or waste dischargerequirements or cause a substantialdegradation of surface runoff quality?Less thansignificantNo mitigation necessary.Less thansignificantHYDRO-2: Will the Project cause waterrelatederosion or siltation on- or off-site?Less thansignificantNo mitigation necessary.Less thansignificantHYDRO-3: Will the Project causeincreased runoff or flooding?Less thansignificantNo mitigation necessary.Less thansignificantHYDRO-4: Will the Project create orcontribute stormwater that would exceedthe capacity of existing or plannedstormwater drainage systems?Less thansignificantNo mitigation necessary.Less thansignificantHYDRO-5: Will the Project depletegroundwater supplies or interfere withgroundwater recharge?Less thansignificantNo mitigation necessary.Less thansignificantparsons CHAPTER 5: ENVIRONMENTAL ANALYSIS 139
CALTRAIN EXTENSION TO MONTEREY COUNTY PASSENGER RAIL STATIONSALTERNATIVES ANALYSISImpactPre-mitigationSignificanceMitigation MeasureSignificance afterMitigationHYDRO-6: Will the Project imperil peopleor structures by causing flooding,including inundation due to levee or damfailure?Less thansignificantNo mitigation necessary.Less thansignificantHYDRO-7: Will the Project placestructures or housing within a 100-yearflood hazard area as mapped on a federalFlood Hazard Boundary or FloodInsurance Rate Map or other flood hazarddelineation map?Less thansignificantNo mitigation necessary.Less thansignificantHYDRO-C1: Will the project havesignificant cumulative impacts tohydrology and water quality?Less thansignificantNo mitigation necessary.Less thansignificant3.8. Land Use and PlanningLU-1 Will the Project be inconsistent withCounty or City zoning ordinances?Less thansignificant-AlternativeCastroville SitePotentiallysignificant-LPANo mitigation necessary.LU-1: Rezone propertiesLess thansignificantLess thansignificantLU-2: Will the Project increase potentialfor conflict as a result of incompatible landuses?Less thansignificant-AlternativeCastroville SitePotentiallysignificant-LPANo mitigation necessary.LU-2: Design project to be compatiblewith surrounding land use.Less thansignificantLess thansignificantLU-C1: Will the Project result incumulative impacts on land uses?Less thansignificantNo mitigation necessary.Less thansignificant3.9. AgricultureAG-1: Will the project convert PrimeFarmland, Unique Farmland, or Farmlandof Statewide Importance (Farmland) tonon-agricultural use?No impact –AlternateCastroville SiteLess thansignificant-LPANo mitigation necessary.AG-1: Purchase ofdevelopment rights, conservationeasements or transfer ofdevelopment rights.No impactLess thansignificantAG-2: Will the Project conflict withexisting zoning for agricultural use or aWilliamson Act?AG-3: Will the Project involve otherchanges in the existing environmentwhich, due to their location or nature,could result in conversion of farmland tonon-agricultural use?No impact –AlternateCastroville SiteSignificant-LPALess thansignificantNo mitigation necessary.AG-2: Rezoning of CastrovillePassenger Station Site.No mitigation necessary.No impactLess thansignificantLess thansignificantparsons CHAPTER 5: ENVIRONMENTAL ANALYSIS 140
CALTRAIN EXTENSION TO MONTEREY COUNTY PASSENGER RAIL STATIONSALTERNATIVES ANALYSISImpactAG-C1: Will the project have the potentialto have a cumulative impact onagriculture?3.10. NoiseNO-1: Would the Project expose personsto or generate noise levels in excess ofstandards established in the local generalplan or noise ordinance, or applicablestandards of lead or responsibleagencies?NO-2: Would the Project expose personsto or generate excessive groundbornevibration or groundborne noise levels?NO-3: Would the Project cause asubstantial permanent increase in ambientnoise levels in the project vicinity?NO-4: Would the Project cause asubstantial temporary or periodic increasein ambient noise levels in the projectvicinity?NO-5: For a project located within anairport land use plan or, where such aplan has not been adopted, within twomiles of a public airport or public useairport, would the Project expose peopleresiding or working in the project area toexcessive noise levels?NO-6: For a project within the vicinity of aprivate airstrip, would the Project exposepeople residing or working in the projectarea to excessive noise levels?NO-1c: Will the Project have the potentialto generate cumulative noise impacts inexcess of standards or cause asubstantial increase in noise levels aboveexisting levels in the project vicinity?3.11. SocioeconomicsPH-1: Would the Project inducesubstantial population growth in an area,either directly (for example, by proposingnew homes and businesses) or indirectly(for example, through extension of roadsor other infrastructure)?Pre-mitigationSignificanceLess thansignificantSignificantMitigation MeasureNo mitigation necessary.NO-1: Utilize special horndesigns, establish quiet zones, orinstall residential sound insulation.Significance afterMitigationLess thansignificantLess thansignificantNo impact No mitigation necessary. No impact.Less thansignificantSignificantNO-1: Utilize special horndesigns or establish quiet zones.NO-4: Implement BestManagement Practices duringconstruction of the project.Less thansignificantLess thansignificantNo impact No mitigation necessary. No impactNo impact No mitigation necessary. No impactPotentiallysignificantSignificantRegionally, noise impacts fromincreased service on the rail linescould be minimized by implementationof additional noise abatementmethods such as limited useof train horns, as described abovein Mitigation Measure NO-1.PH-1A: Implement MontereyCounty and City of Salinas GrowthManagement PoliciesPH-1B: Implement TAMC<strong>Transportation</strong>-Related PrinciplesLess thansignificant.Less thansignificantparsons CHAPTER 5: ENVIRONMENTAL ANALYSIS 141
CALTRAIN EXTENSION TO MONTEREY COUNTY PASSENGER RAIL STATIONSALTERNATIVES ANALYSISImpactPH-2: Would the Project displacesubstantial numbers of existing housing orpeople, necessitating the construction ofreplacement housing elsewhere?PH-3: Would the Project displacesubstantial numbers of existingbusinesses or jobs, requiring relocation ofbusinesses or employees elsewhere?PH-1c: Would the Project have thepotential to have a cumulative impact onpopulation, housing, or socio-economics?Pre-mitigationSignificancePotentiallysignificantPotentiallysignificantLess thansignificant3.12. Public Services, Utilities, and Service SystemsPSU-1: Will the Project increase demandfor police, fire, water, wastewatertreatment and disposal, or solid wasteremoval to such a degree that acceptedservice standards are not maintained?PSU-2: Will project construction disruptpolice, fire, water, wastewater treatmentand disposal, or solid waste removal tosuch a degree that accepted servicestandards are not maintained?PSU-3: Will the project constructionand/or permanent operation result ingreater demand for school, library, andpark facilities and services?PSU-C1: Will the project have significantcumulative impacts to public services andutility resources?3.13. Parks and RecreationPR-1: Would the project increase theuse of existing recreational facilities,including neighborhood and regionalparks, such that substantial physicaldeterioration of the existing facilities wouldoccur or be accelerated?PR-2. Would the project includerecreational facilities or require theconstruction or expansion of recreationalfacilities, which might have an adversephysical effect on the environment?Less thansignificantLess thansignificantLess thansignificantLess thansignificantLess thansignificantMitigation MeasurePH-2: Implement procedures forresidential acquisition andrelocation consistent with City ofSalinas Redevelopment Agencyrequirements and the federalUniform Act (49 CFR 24C Section24.205).PH-3: Implement procedures forbusiness property acquisition andrelocation consistent with City andCounty requirements and thefederal Uniform Act (49 CFR 24CSection 24.205).No mitigation is necessary.No mitigation is necessary.No mitigation is necessary.No mitigation is necessary.No mitigation is necessary.No mitigation is necessary.Significance afterMitigationLess thansignificantLess thansignificantLess thansignificantLess thansignificantLess thansignificantLess thansignificantLess thansignificantLess thansignificantNo impact No mitigation is necessary. No impactparsons CHAPTER 5: ENVIRONMENTAL ANALYSIS 142
CALTRAIN EXTENSION TO MONTEREY COUNTY PASSENGER RAIL STATIONSALTERNATIVES ANALYSISImpactPR-3: Would the project preclude orsubstantially limit the use of existing parkand recreational facilities by the generalpublic?PR-C-1. Would the proposed projectresult in cumulative impacts to parklandand recreation?3.14. TrafficTC-1: Will Project cause the 5-year or 10-year (cumulative) no project LOS at ananalysis location—to worsen from LOS Cor better to LOS D or worse?TC-2: Will the Project cause the existingor cumulative no project LOS at ananalysis location within the City of Salinasor unincorporated Monterey County toworsen from LOS D or better to LOS E orworse?TC-3: Will the Project worsen already (orprojected) unacceptable operations at ananalysis location?TC-4: Will the Project create aninconsistency with policies concerningroadway systems set forth in the GeneralPlans for the City of Salinas and MontereyCounty?TC-5: Will the Project create the demandfor public transit service above that whichis provided, or planned to be provided?TC-6: Will the Project disrupt or interferewith existing or planned public transitservices or facilities?TC-7: Will the Project create aninconsistency with policies concerningtransit systems set forth in the GeneralPlans for the City of Salinas and MontereyCounty?TC-8: Will the Project disrupt or interferewith existing or planned bicycle orpedestrian facilities?TC-9: Will the Project create an unmetneed for bicycle or pedestrian facilities?Pre-mitigationSignificancePotentiallysignificantLess thansignificantSignificantSignificantSignificantMitigation MeasurePR-3: Prepare a TrafficManagement Plan toAccommodate Parking around theHarvey-Baker House duringProject Construction.No mitigation is necessary.TC-1: Install traffic signal atSalinas Road and <strong>Rail</strong>roadAvenue in Pajaro.TC-1: Install traffic signal atSalinas Road and <strong>Rail</strong>roadAvenue in Pajaro.TC-3 Install traffic signal atSalinas Road and <strong>Rail</strong>roadAvenue in Pajaro; reroute MSTbus routes as needed to avoidcongestion at Salinas Road andWest Market Street.Significance afterMitigationLess thansignificantLess thansignificantLess thansignificantLess thansignificantLess thansignificant; LPASignificant andUnavoidable;AlternativeCastoville Site.No impact No mitigation necessary. No impactLess thansignificantNo mitigation necessary.Less thansignificantNo impact No mitigation necessary. No impactNo impact No mitigation necessary. No impactNo impact No mitigation necessary. No impactLess thansignificantNo mitigation necessary.Less thansignificantparsons CHAPTER 5: ENVIRONMENTAL ANALYSIS 143
CALTRAIN EXTENSION TO MONTEREY COUNTY PASSENGER RAIL STATIONSALTERNATIVES ANALYSISImpactTC-10: Will the Project create aninconsistency with policies related tobicycle or pedestrian systems in theGeneral Plans of the City of Salinas andMonterey County?TC-C1: Will the Project have the potentialto have a cumulative impact on traffic andcirculation?TC-C2: Will the Project have the potentialto have a cumulative impact on activehighway/rail at-grade crossings?TC-C3: Will the Project have the potentialto have a cumulative impact on freighttrain operations?Pre-mitigationSignificanceMitigation MeasureSignificance afterMitigationNo impact No mitigation necessary. No impactLess thansignificantLess thansignificantPotentiallysignificantNo mitigation necessary.No mitigation necessary.TC-C3 Conduct 4-train <strong>Rail</strong>Capacity <strong>Analysis</strong>. Work withUnion Pacific to identify capitalinvestments in track, switch, andsignaling required to accommodateboth commuter and freighttrains. Include these investmentsas part of the Locally PreferredAlternative.Less thansignificantLess thansignificantLess thansignificant.parsons CHAPTER 5: ENVIRONMENTAL ANALYSIS 144
CALTRAIN EXTENSION TO MONTEREY COUNTY PASSENGER RAIL STATIONSALTERNATIVES ANALYSISCHAPTER 6: ESTIMATION OF CAPITAL, OPERATING ANDMAINTENANCE COSTS, AND REVENUECALTRAIN EXTENSION ALTERNATIVE CAPITAL COST ESTIMATESThe Caltrain <strong>Extension</strong> Alternative includes seven major transit improvement components:• Upgrading trackage and signal systems on the Union Pacific <strong>Rail</strong>road (UPRR) Coast main linebetween Gilroy and Salinas• Extending the Gilroy station track 0.9 miles and connecting to the Coast main line track• Constructing a Caltrain station at Pajaro/Watsonville• Constructing a Caltrain station at Castroville• Expanding the existing Salinas Intermodal <strong>Transportation</strong> Center (ITC) to accommodateCaltrain and intercity buses; providing additional parking; and upgrading the Amtrak platformto comply with Americans with Disabilities Act accessibility standards• Expanding the Salinas ITC to accommodate an expanded downtown Salinas transit center forMonterey-Salinas Transit (MST) local buses• Constructing a layover facility in Salinas for Caltrain trainsets.A description of this alternative and these investments is summarized in Chapter 3. A morethorough definition of the Caltrain <strong>Extension</strong> Alternative physical facilities, design basis andconceptual design drawings are provided in the Caltrain <strong>Extension</strong> to Monterey CountyProject Study Report, dated February 21, 2006, which is incorporated with this <strong>Alternatives</strong><strong>Analysis</strong> by reference.The estimated project cost of the Caltrain <strong>Extension</strong> Alternative, in FY 2007 dollars, is $102 million.This estimate includes an allowance for unallocated contingencies, but does not include escalationand is subject to change. Risk factors that may affect project costs include the cost of right-of-wayacquisition in Salinas; the costs of upgrading trackage and signal systems on the UPRR main linebetween Gilroy and Salinas; and the potential/eventual cost of accommodating diesel rail to electricrail cross platform transfers at the San Jose Diridon station. Table 6-1 lists the estimated project costsby component (location) and work type expressed in FY 2007 and year of expenditure (YOE) dollars.The cost indicated for the UPRR main line is an allowance and is subject to change.The estimated project cost, escalated to midpoint of right-of-way acquisition, design and constructionphase indirect (soft) costs, and construction is $109 million. This escalated cost assumes a threepercent per year increase in construction and other costs.These costs include an allowance of $8.8 million for the acquisition of rolling stock. This rolling stockis not required to accommodate peak passenger loads. The capital cost of this equipment is includedas a risk element for comparison with the Express Bus Alternative.parsons CHAPTER 6: ESTIMATION OF CAPITAL, OPERATING AND MAINTENANCE COSTS, AND REVENUE 145
CALTRAIN EXTENSION TO MONTEREY COUNTY PASSENGER RAIL STATIONSALTERNATIVES ANALYSISTable 6-1Caltrain <strong>Extension</strong> Alternative Capital Cost Estimate ($1,000 FY 2007)Work DescriptionUPRRMainLineGilroyYardPajaroStationCastrovilleStationSalinasStationSalinasBusSalinasYard2007TotalsYOETotalsParking and access — — $ 1,805 $ 2,085 $ 2,244 $1,526 — $7,660 $8,426Pedestrian structures — — — 900 — — — 900 990Platform and station— — 1,602 1,953 2,555 1,298 — 7,408 8,149amenitiesTrack and signal5,000 2,088 3,937 3,251 1,103 — 3,718 19,097 20,099improvementsSpecialty items — — 179 — 227 — 202 608 669Mobilization — 209 753 729 613 282 392 2,978 3,276Contingencies — 804 2,897 3,122 2,360 1,087 1,509 11,779 12,957Construction Total $5,000 $3,101 $11,173 $12,040 $ 9,102 $4,193 $5,821 $50,430 $54,566Soft cost — 1,023 3,687 3,973 3,004 1,384 1,921 14,992 15,756Right-of-way — — 2,170 430 7,750 4,250 4,000 18,600 19,346Subtotal $5,000 $4,124 $17,030 $16,443 $19,856 $9,827 $11,742 $84,022 $89,668Vehicles (risk element) — — — — — — — 8,800 9,616Unallocated contingency 9,282 9,871Total $5,000 $4,124 $17,030 $16,443 $19,856 $9,827 $11,742 $102,104 $109,155Table 6-2 provides additional capital detail, summarized by FTA cost code. Totals vary slightly fromthose tallied in Table 6-1 due to rounding.Table 6-3 provides an estimate of annualized capital costs. These costs are based on a 7 percentdiscount rate and Federal Transit Administration (FTA) assumptions regarding the number of usefulyears of each component.Detailed cost estimates and methodologies are provided in Appendix E of this document.parsons CHAPTER 6: ESTIMATION OF CAPITAL, OPERATING AND MAINTENANCE COSTS, AND REVENUE 146
CALTRAIN EXTENSION TO MONTEREY COUNTY PASSENGER RAIL STATIONSALTERNATIVES ANALYSISTable 6-2Main Worksheet—Build AlternativeM A I N W O R K S H E E T - B U I L D A L T E R N A T I V E (Rev.9, Feb. 6, 2007)<strong>Transportation</strong> Agency for Monterey County Today's Date 3/6/07Caltrain <strong>Extension</strong> to Monterey County Yr of Base Year $ 2007Conceptual Engineering Yr of Revenue Ops 2011QuantityBase Year Base YearDollars w/o DollarsContingency Allocated(X000) Contingency(X000)Base YearDollarsTOTAL(X000)Base YearDollars UnitCost(X000)Base YearDollarsPercentageofConstructionCostBase YearDollarsPercentageofTotalProject CostYOE DollarsTotal(X000)10 GUIDEWAY & TRACK ELEMENTS (route miles) 0.00 15,352,424 0 15,352,424 30% 15% 16,613,13410.01 Guideway: At-grade exclusive right-of-way 0 010.02 Guideway: At-grade semi-exclusive (allows cross-traffic) 0 010.03 Guideway: At-grade in mixed traffic 0 010.04 Guideway: Aerial structure 0 010.05 Guideway: Built-up fill 0 010.06 Guideway: Underground cut & cover 0 010.07 Guideway: Underground tunnel 0 010.08 Guideway: Retained cut or fill 0 010.09 Track: Direct fixation 0 010.10 Track: Embedded 0 010.11 Track: Ballasted 10,464,317 10,464,317 11,323,62510.12 Track: Special (switches, turnouts) 4,888,107 4,888,107 5,289,50910.13 Track: Vibration and noise dampening 0 020 STATIONS, STOPS, TERMINALS, INTERMODAL (number) 0 6,985,896 0 6,985,896 14% 7% 7,559,56420.01 At-grade station, stop, shelter, mall, terminal, platform 6,985,896 6,985,896 7,559,56420.02 Aerial station, stop, shelter, mall, terminal, platform 0 020.03 Underground station, stop, shelter, mall, terminal, platform 0 020.04 Other stations, landings, terminals: Intermodal, ferry, trolley, etc. 0 020.05 Joint development 0 020.06 Automobile parking multi-story structure 0 020.07 Elevators, escalators 0 030 SUPPORT FACILITIES: YARDS, SHOPS, ADMIN. BLDGS 0.00 3,885,341 0 3,885,341 8% 4% 4,204,39730.01 Administration Building: Office, sales, storage, revenue counting 675,000 675,000 730,43030.02 Light Maintenance Facility 0 030.03 Heavy Maintenance Facility 0 030.04 Storage or Maintenance of Way Building 0 030.05 Yard and Yard Track 3,210,341 3,210,341 3,473,96740 SITEWORK & SPECIAL CONDITIONS 0.00 18,855,777 0 18,855,777 37% 18% 20,404,17540.01 Demolition, Clearing, Earthwork 3,457,588 3,457,588 3,741,51840.02 Site Utilities, Utility Relocation 0 040.03 Haz. mat'l, contam'd soil removal/mitigation, ground water treatments 207,495 207,495 224,53440.04 Environmental mitigation, e.g. wetlands, historic/archeologic, parks 0 040.05 Site structures including retaining walls, sound walls 511,988 511,988 554,03140.06 Pedestrian / bike access and accommodation, landscaping 2,571,660 2,571,660 2,782,83940.07 Automobile, bus, van accessways including roads, parking lots 7,474,945 7,474,945 8,088,77240.08 Temporary Facilities and other indirect costs during construction 4,632,102 4,632,102 5,012,48150 SYSTEMS 0.00 5,346,000 0 5,346,000 11% 5% 5,785,00350.01 Train control and signals 4,725,000 4,725,000 5,113,00850.02 Traffic signals and crossing protection 135,000 135,000 146,08650.03 Traction power supply: substations 0 050.04 Traction power distribution: catenary and third rail 0 050.05 Communications 0 050.06 Fare collection system and equipment 486,000 486,000 525,90950.07 Central Control 0 0Construction Subtotal (10 - 50)0.00 50,425,437 0 50,425,437 100% 49% 54,566,27360 ROW, LAND, EXISTING IMPROVEMENTS 0.00 18,600,000 0 18,600,000 18% 19,345,74060.01 Purchase or lease of real estate 18,600,000 18,600,000 19,345,74060.02 Relocation of existing households and businesses 0 070 VEHICLES (number) 4 8,800,000 0 8,800,000 $ 2,200,0009% 9,615,99870.01 Light <strong>Rail</strong> 0 070.02 Heavy <strong>Rail</strong> 0 070.03 <strong>Commuter</strong> <strong>Rail</strong> 4 8,800,000 8,800,000 $ 2,200,0009,615,99870.04 Bus 0 070.05 Other 0 070.06 Non-revenue vehicles 0 070.07 Spare parts 0 080 PROFESSIONAL SERVICES 0.00 14,991,013 0 14,991,013 30% 15% 15,756,43980.01 Preliminary Engineering 1,362,797 1,362,797 1,432,38080.02 Final Design 3,179,860 3,179,860 3,342,22080.03 Project Management for Design and Construction 3,634,371 3,634,371 3,819,93880.04 Construction Administration & Management 4,542,657 4,542,657 4,774,60180.05 Insurance 0 080.06 Legal; Permits; Review Fees by other agencies, cities, etc. 2,271,328 2,271,328 2,387,30080.07 Surveys, Testing, Investigation, Inspection 0 080.08 Start up 0 0Subtotal (10 - 80) 0.00 92,816,450 0 92,816,450 91% 99,284,45090 UNALLOCATED CONTINGENCY 9,282,000 9% 9,871,407Subtotal (10 - 90) 0.00 102,098,450 100% 109,155,857100 FINANCE CHARGES 0 0% 0Total Project Cost (10 - 100) 0.00 102,098,450 100% 109,155,857Allocated Contingency as % of Base Yr Dollars w/o Contingency 0.00%Unallocated Contingency as % of Base Yr Dollars w/o Contingency 10.00%Total Contingency as % of Base Yr Dollars w/o Contingency 10.00%Unallocated Contingency as % of Subtotal (10 - 80) 10.00%YOE Construction Cost per Mile (X000)YOE Total Project Cost per Mile Not Including Vehicles (X000)YOE Total Project Cost per Mile (X000)Enter financecharges onInflationWorksheet.#DIV/0!#DIV/0!#DIV/0!parsons CHAPTER 6: ESTIMATION OF CAPITAL, OPERATING AND MAINTENANCE COSTS, AND REVENUE 147
CALTRAIN EXTENSION TO MONTEREY COUNTY PASSENGER RAIL STATIONSALTERNATIVES ANALYSISTable 6-3Annualized Cost—Build AlternativeA N N U A L I Z E D C O S T - B U I L D A L T E R N A T I V E (Rev.9, Feb. 6, 2007)<strong>Transportation</strong> Agency for Monterey County Today's Date 3/6/07Caltrain <strong>Extension</strong> to Monterey County Yr of Base Year $ 2007Conceptual Engineering Yr of Revenue Ops 2011QuantityTotal BaseYear Dollars(X000)Cat. 80Prof. Svc.spreadproportionallyoverCats. 10 - 50(X000)SpreadCat. 90Unalloc.Cont.according toperceivedrisks(X000)RevisedTotal BaseYear Dollars(X000)Years ofUseful LifeAnnualizationFactor(based on 7%rate)[.07/1 - (1.07)^no.yrs]AnnualizedCost(X000)10 GUIDEWAY & TRACK ELEMENTS (route miles) 0.00 15,352,424 4,564,133 5,000,000 24,916,556 1,945,66310.01 Guideway: At-grade exclusive right-of-way 0.00 0 0 0 125 0.0700 010.02 Guideway: At-grade semi-exclusive (allows cross-traffic) 0.00 0 0 0 30 0.0806 010.03 Guideway: At-grade in mixed traffic 0.00 0 0 0 20 0.0944 010.04 Guideway: Aerial structure 0.00 0 0 0 80 0.0703 010.05 Guideway: Built-up fill 0.00 0 0 0 80 0.0703 010.06 Guideway: Underground cut & cover 0.00 0 0 0 125 0.0700 010.07 Guideway: Underground tunnel 0.00 0 0 0 125 0.0700 010.08 Guideway: Retained cut or fill 0.00 0 0 0 125 0.0700 010.09 Track: Direct fixation 0 0 0 30 0.0806 010.10 Track: Embedded 0 0 0 20 0.0944 010.11 Track: Ballasted 10,464,317 3,110,944 5,000,000 18,575,261 35 0.0772 1,434,64110.12 Track: Special (switches, turnouts) 4,888,107 1,453,189 6,341,296 30 0.0806 511,02210.13 Track: Vibration and noise dampening 0 0 0 30 0.0806 020 STATIONS, STOPS, TERMINALS, INTERMODAL (number) 0 6,985,896 2,076,842 1,000,000 10,062,738 710,62620.01 At-grade station, stop, shelter, mall, terminal, platform 0 6,985,896 2,076,842 1,000,000 10,062,738 70 0.0706 710,62620.02 Aerial station, stop, shelter, mall, terminal, platform 0 0 0 0 70 0.0706 020.03 Underground station, stop, shelter, mall, terminal, platform 0 0 0 0 125 0.0700 020.04 Other stations, landings, terminals: Intermodal, ferry, trolley, etc. 0 0 0 0 70 0.0706 020.05 Joint development 0 0 0 70 0.0706 020.06 Automobile parking multi-story structure 0 0 0 50 0.0725 020.07 Elevators, escalators 0 0 0 30 0.0806 030 SUPPORT FACILITIES: YARDS, SHOPS, ADMIN. BLDGS 3,885,341 1,155,076 0 5,040,416 356,28930.01 Administration Building: Office, sales, storage, revenue counting 675,000 200,671 875,671 50 0.0725 63,45130.02 Light Maintenance Facility 0 0 0 50 0.0725 030.03 Heavy Maintenance Facility 0 0 0 50 0.0725 030.04 Storage or Maintenance of Way Building 0 0 0 50 0.0725 030.05 Yard and Yard Track 3,210,341 954,404 4,164,745 80 0.0703 292,83840 SITEWORK & SPECIAL CONDITIONS 18,855,777 5,605,647 500,000 24,961,424 2,078,18240.01 Demolition, Clearing, Earthwork 3,457,588 1,027,909 4,485,496 125 0.0700 314,05140.02 Site Utilities, Utility Relocation 0 0 0 125 0.0700 040.03 Haz. mat'l, contam'd soil removal/mitigation, ground water treatments 207,495 61,686 269,181 125 0.0700 18,84740.04 Environmental mitigation, e.g. wetlands, historic/archeologic, parks 0 0 0 125 0.0700 040.05 Site structures including retaining walls, sound walls 511,988 152,209 664,197 80 0.0703 46,70240.06 Pedestrian / bike access and accommodation, landscaping 2,571,660 764,530 500,000 3,836,190 20 0.0944 362,10940.07 Automobile, bus, van accessways including roads, parking lots 7,474,945 2,222,231 9,697,176 20 0.0944 915,34540.08 Temporary Facilities and other indirect costs during construction 4,632,102 1,377,081 6,009,183 100 0.0701 421,12850 SYSTEMS 5,346,000 1,589,316 0 6,935,316 562,18650.01 Train control and signals 4,725,000 1,404,699 6,129,699 30 0.0806 493,97050.02 Traffic signals and crossing protection 135,000 40,134 175,134 30 0.0806 14,11350.03 Traction power supply: substations 0 0 0 50 0.0725 050.04 Traction power distribution: catenary and third rail 0 0 0 30 0.0806 050.05 Communications 0 0 0 20 0.0944 050.06 Fare collection system and equipment 486,000 144,483 630,483 25 0.0858 54,10250.07 Central Control 0 0 0 30 0.0806 0Construction Subtotal (10 - 50)50,425,437 14,991,013 6,500,000 71,916,450 5,652,94660 ROW, LAND, EXISTING IMPROVEMENTS 18,600,000 2,782,000 21,382,000 1,497,05860.01 Purchase or lease of real estate 18,600,000 2,782,000 21,382,000 125 0.0700 1,497,05860.02 Relocation of existing households and businesses 0 0 125 0.0700 070 VEHICLES (number) 4 8,800,000 0 8,800,000 755,13370.01 Light <strong>Rail</strong> 0 0 0 25 0.0858 070.02 Heavy <strong>Rail</strong> 0 0 0 25 0.0858 070.03 <strong>Commuter</strong> <strong>Rail</strong> 4 8,800,000 8,800,000 25 0.0858 755,13370.04 Bus 0 0 0 12 0.1259 070.05 Other 0 0 0 12 0.1259 070.06 Non-revenue vehicles 0 0 0 12 0.1259 070.07 Spare parts 0 0 0 12 0.1259 080 PROFESSIONAL SERVICES 14,991,01380.01 Preliminary Engineering 1,362,79780.02 Final Design 3,179,86080.03 Project Management for Design and Construction 3,634,37180.04 Construction Administration & Management 4,542,65780.05 Insurance 080.06 Legal; Permits; Review Fees by other agencies, cities, etc. 2,271,32880.07 Surveys, Testing, Investigation, Inspection 080.08 Start upSubtotal (10 - 80)092,816,45090 UNALLOCATED CONTINGENCY 9,282,000Subtotal (10 - 90)The range for buses is 12 to 18 years.Provide supporting documentation for anestimated useful life of more than 12years.102,098,450 14,991,013 9,282,000 ######### 7,905,137parsons CHAPTER 6: ESTIMATION OF CAPITAL, OPERATING AND MAINTENANCE COSTS, AND REVENUE 148
CALTRAIN EXTENSION TO MONTEREY COUNTY PASSENGER RAIL STATIONSALTERNATIVES ANALYSISEXPRESS BUS ALTERNATIVE CAPITAL COSTSSimilar to the Caltrain <strong>Extension</strong> Alternative, the Express Bus Alternative has seven major transit improvementcomponents:• Constructing a park-and-ride facility at Pajaro/Watsonville• Constructing a park-and-ride facility at Castroville• Expanding the existing Salinas ITC to accommodate intercity buses and upgrading the Amtrakplatform to comply with Americans with Disabilities Act accessibility standards• Expanding the Salinas ITC to accommodate an expanded downtown Salinas transit center forMonterey-Salinas Transit local buses• Providing additional parking at the Salinas ITC to accommodate Express Bus patrons• Constructing a MST Transit Center in Marina/California State University–Monterey Bay• Constructing a park-and-ride facility at Marina/California State University–Monterey Bay, adjacentto the MST Transit Center.A description of this alternative and these investments is summarized in Chapter 3.The estimated project cost of the Express Bus Alternative, in FY 2007 dollars, is $96.5 million. Thisestimate does not include escalation and is subject to change. Table 6-4 lists the estimated projectcosts by component (location) and work type expressed in FY 2007 and year of expenditure dollars.The cost indicated for the expansion of the Frank L. Lichtanski Monterey Bay Operations Center(maintenance facility) is an allowance and is subject to change.Table 6-4Express Bus Alternative Capital Cost Estimate ($1,000 FY 2007)Work DescriptionPajaroPark-and-RideCastrovilleParkand-RideSalinasStationSalinasBusSalinasPark-and-RideMarinaBusMarinaParkand-Ride2007TotalsYOETotalsParking and access $2,227 $1,426 — $1,215 $ 8,888 $ 485 $1,390 $15,631 $17,194Pedestrian structures — 900 — — — — — 900 990Platform and station amenities 576 453 2,301 1,298 — 1,204 — 5,832 6,415Track and signal improvements — 605 316 — — — — 921 1,013Specialty items 50 100 75 50 — — — 275 303Mobilization 285 349 269 256 889 169 139 2,356 2,592Contingencies 1,098 1,341 1,036 987 1,955 650 535 7,602 8,362Construction Total $4,236 $5,174 $3,997 $3,806 $11,732 $2,508 $2,064 $33,517 36,271Soft cost 1,398 1,707 1,319 1,256 4,106 702 681 11,169 11,741Right-of-way 2,170 409 — 4,250 1,650 74 2,622 11,175 11,593Subtotal $7,804 $7,290 $5,316 $9,312 $17,488 $3,284 $5,367 $55,861 59,605Vehicles — — — — — — — 30,000 36,383Maintenance facility — — — — — — — 6,000 6,493Unallocated contingency — — — — — — — 4,593 4,866Total $7,804 $7,290 $5,316 $9,312 $17,488 $3,284 $5,367 $96,454 $107,347parsons CHAPTER 6: ESTIMATION OF CAPITAL, OPERATING AND MAINTENANCE COSTS, AND REVENUE 149
CALTRAIN EXTENSION TO MONTEREY COUNTY PASSENGER RAIL STATIONSALTERNATIVES ANALYSISThe estimated project cost, escalated to midpoint of right-of-way acquisition, design and constructionphase indirect (soft) costs, and construction is $107 million. This escalated cost assumes a threepercent per year increase in construction and other items. Table 6-5 provides additional capital detail,summarized by FTA cost code. Totals vary slightly from those tallied in Table 6-4 due to rounding.In addition to facilities, a cost allowance is included in Table 6-4 for the acquisition of express busvehicles.Table 6-6 provides an estimate of annualized capital costs based on a 7 percent discount rate andFTA assumptions regarding the useful life of each component.Appendix E of this document includes detailed, line item cost estimates for the Express BusAlternative along with assumptions and cost estimating methodology.parsons CHAPTER 6: ESTIMATION OF CAPITAL, OPERATING AND MAINTENANCE COSTS, AND REVENUE 150
CALTRAIN EXTENSION TO MONTEREY COUNTY PASSENGER RAIL STATIONSALTERNATIVES ANALYSISTable 6-5TSM AlternativeM A I N W O R K S H E E T - B U I L D A L T E R N A T I V E (Rev.9, Feb. 6, 2007)<strong>Transportation</strong> Agency for Monterey County Today's Date 3/8/07Express Bus Alternative Yr of Base Year $ 2007Conceptual Engineering Yr of Revenue Ops 2011QuantityBase Year Base YearDollars w/o DollarsContingency Allocated(X000) Contingency(X000)Base YearDollarsTOTAL(X000)Base YearDollars UnitCost(X000)Base YearDollarsPercentageofConstructionCostBase YearDollarsPercentageofTotalProject CostYOE DollarsTotal(X000)10 GUIDEWAY & TRACK ELEMENTS (route miles) 0.00 1,458,783 0 1,458,783 4% 2% 1,578,57510.01 Guideway: At-grade exclusive right-of-way 0 010.02 Guideway: At-grade semi-exclusive (allows cross-traffic) 0 010.03 Guideway: At-grade in mixed traffic 0 010.04 Guideway: Aerial structure 0 010.05 Guideway: Built-up fill 0 010.06 Guideway: Underground cut & cover 0 010.07 Guideway: Underground tunnel 0 010.08 Guideway: Retained cut or fill 0 010.09 Track: Direct fixation 0 010.10 Track: Embedded 0 010.11 Track: Ballasted 1,438,776 1,438,776 1,556,92510.12 Track: Special (switches, turnouts) 20,007 20,007 21,65010.13 Track: Vibration and noise dampening 0 020 STATIONS, STOPS, TERMINALS, INTERMODAL (number) 0 4,048,807 0 4,048,807 10% 4% 4,381,28720.01 At-grade station, stop, shelter, mall, terminal, platform 4,048,807 4,048,807 4,381,28720.02 Aerial station, stop, shelter, mall, terminal, platform 0 020.03 Underground station, stop, shelter, mall, terminal, platform 0 020.04 Other stations, landings, terminals: Intermodal, ferry, trolley, etc. 0 020.05 Joint development 0 020.06 Automobile parking multi-story structure 0 020.07 Elevators, escalators 0 030 SUPPORT FACILITIES: YARDS, SHOPS, ADMIN. BLDGS 0.00 7,376,190 0 7,376,190 19% 8% 7,981,90830.01 Administration Building: Office, sales, storage, revenue counting 675,000 675,000 730,43030.02 Light Maintenance Facility 6,000,000 6,000,000 6,492,70830.03 Heavy Maintenance Facility 0 030.04 Storage or Maintenance of Way Building 0 030.05 Yard and Yard Track 701,190 701,190 758,77040 SITEWORK & SPECIAL CONDITIONS 0.00 25,891,808 0 25,891,808 66% 27% 28,017,99140.01 Demolition, Clearing, Earthwork 1,987,471 1,987,471 2,150,67840.02 Site Utilities, Utility Relocation 0 040.03 Haz. mat'l, contam'd soil removal/mitigation, ground water treatments 33,750 33,750 36,52140.04 Environmental mitigation, e.g. wetlands, historic/archeologic, parks 0 040.05 Site structures including retaining walls, sound walls 0 040.06 Pedestrian / bike access and accommodation, landscaping 2,831,016 2,831,016 3,063,49340.07 Automobile, bus, van accessways including roads, parking lots 18,721,551 18,721,551 20,258,92740.08 Temporary Facilities and other indirect costs during construction 2,318,020 2,318,020 2,508,37150 SYSTEMS 0.00 742,500 0 742,500 2% 1% 803,47350.01 Train control and signals 0 050.02 Traffic signals and crossing protection 337,500 337,500 365,21550.03 Traction power supply: substations 0 050.04 Traction power distribution: catenary and third rail 0 050.05 Communications 0 050.06 Fare collection system and equipment 405,000 405,000 438,25850.07 Central Control 0 0Construction Subtotal (10 - 50)0.00 39,518,088 0 39,518,088 100% 41% 42,763,23460 ROW, LAND, EXISTING IMPROVEMENTS 0.00 11,174,225 0 11,174,225 12% 11,593,02460.01 Purchase or lease of real estate 11,174,225 11,174,225 11,593,02460.02 Relocation of existing households and businesses 0 070 VEHICLES (number) 0 30,000,000 0 30,000,000 31% 36,382,61370.01 Light <strong>Rail</strong> 0 070.02 Heavy <strong>Rail</strong> 0 070.03 <strong>Commuter</strong> <strong>Rail</strong> 0 070.04 Bus 30,000,000 30,000,000 36,382,61370.05 Other 0 070.06 Non-revenue vehicles 0 070.07 Spare parts 0 080 PROFESSIONAL SERVICES 0.00 11,170,242 0 11,170,242 28% 12% 11,740,58380.01 Preliminary Engineering 1,181,531 1,181,531 1,241,85880.02 Final Design 2,756,905 2,756,905 2,897,66980.03 Project Management for Design and Construction 1,742,857 1,742,857 1,831,84680.04 Construction Administration & Management 3,938,435 3,938,435 4,139,52880.05 Insurance 0 080.06 Legal; Permits; Review Fees by other agencies, cities, etc. 1,550,515 1,550,515 1,629,68380.07 Surveys, Testing, Investigation, Inspection 0 080.08 Start up 0 0Subtotal (10 - 80) 0.00 91,862,555 0 91,862,555 95% 102,479,45590 UNALLOCATED CONTINGENCY 4,593,000 5% 4,866,369Subtotal (10 - 90) 0.00 96,455,555 100% 107,345,823100 FINANCE CHARGES 0 0% 0Total Project Cost (10 - 100) 0.00 96,455,555 100% 107,345,823Allocated Contingency as % of Base Yr Dollars w/o Contingency 0.00%Unallocated Contingency as % of Base Yr Dollars w/o Contingency 5.00%Total Contingency as % of Base Yr Dollars w/o Contingency 5.00%Unallocated Contingency as % of Subtotal (10 - 80) 5.00%YOE Construction Cost per Mile (X000)YOE Total Project Cost per Mile Not Including Vehicles (X000)YOE Total Project Cost per Mile (X000)Enter financecharges onInflationWorksheet.#DIV/0!#DIV/0!#DIV/0!parsons CHAPTER 6: ESTIMATION OF CAPITAL, OPERATING AND MAINTENANCE COSTS, AND REVENUE 151
CALTRAIN EXTENSION TO MONTEREY COUNTY PASSENGER RAIL STATIONSALTERNATIVES ANALYSISTable 6-6TSM Alternative Annualized CostA N N U A L I Z E D C O S T - B U I L D A L T E R N A T I V E (Rev.9, Feb. 6, 2007)<strong>Transportation</strong> Agency for Monterey County Today's Date 3/8/07Express Bus Alternative Yr of Base Year $ 2007Conceptual Engineering Yr of Revenue Ops 2011QuantityTotal BaseYear Dollars(X000)Cat. 80Prof. Svc.spreadproportionallyoverCats. 10 - 50(X000)SpreadCat. 90Unalloc.Cont.according toperceivedrisks(X000)RevisedTotal BaseYear Dollars(X000)Years ofUseful LifeAnnualizationFactor(based on 7%rate)[.07/1 - (1.07)^no.yrs]AnnualizedCost(X000)10 GUIDEWAY & TRACK ELEMENTS (route miles) 0.00 1,458,783 412,342 0 1,871,125 144,60010.01 Guideway: At-grade exclusive right-of-way 0.00 0 0 0 125 0.0700 010.02 Guideway: At-grade semi-exclusive (allows cross-traffic) 0.00 0 0 0 30 0.0806 010.03 Guideway: At-grade in mixed traffic 0.00 0 0 0 20 0.0944 010.04 Guideway: Aerial structure 0.00 0 0 0 80 0.0703 010.05 Guideway: Built-up fill 0.00 0 0 0 80 0.0703 010.06 Guideway: Underground cut & cover 0.00 0 0 0 125 0.0700 010.07 Guideway: Underground tunnel 0.00 0 0 0 125 0.0700 010.08 Guideway: Retained cut or fill 0.00 0 0 0 125 0.0700 010.09 Track: Direct fixation 0 0 0 30 0.0806 010.10 Track: Embedded 0 0 0 20 0.0944 010.11 Track: Ballasted 1,438,776 406,687 1,845,463 35 0.0772 142,53210.12 Track: Special (switches, turnouts) 20,007 5,655 25,662 30 0.0806 2,06810.13 Track: Vibration and noise dampening 0 0 0 30 0.0806 020 STATIONS, STOPS, TERMINALS, INTERMODAL (number) 0 4,048,807 1,144,442 0 5,193,249 366,74520.01 At-grade station, stop, shelter, mall, terminal, platform 0 4,048,807 1,144,442 5,193,249 70 0.0706 366,74520.02 Aerial station, stop, shelter, mall, terminal, platform 0 0 0 0 70 0.0706 020.03 Underground station, stop, shelter, mall, terminal, platform 0 0 0 0 125 0.0700 020.04 Other stations, landings, terminals: Intermodal, ferry, trolley, etc. 0 0 0 0 70 0.0706 020.05 Joint development 0 0 0 70 0.0706 020.06 Automobile parking multi-story structure 0 0 0 50 0.0725 020.07 Elevators, escalators 0 0 0 30 0.0806 030 SUPPORT FACILITIES: YARDS, SHOPS, ADMIN. BLDGS 7,376,190 2,084,965 0 9,461,155 683,62430.01 Administration Building: Office, sales, storage, revenue counting 675,000 190,797 865,797 50 0.0725 62,73530.02 Light Maintenance Facility 6,000,000 1,695,969 7,695,969 50 0.0725 557,64930.03 Heavy Maintenance Facility 0 0 0 50 0.0725 030.04 Storage or Maintenance of Way Building 0 0 0 50 0.0725 030.05 Yard and Yard Track 701,190 198,199 899,389 80 0.0703 63,23940 SITEWORK & SPECIAL CONDITIONS 25,891,808 7,318,617 2,922,000 36,132,425 3,275,15840.01 Demolition, Clearing, Earthwork 1,987,471 561,782 2,549,253 125 0.0700 178,48640.02 Site Utilities, Utility Relocation 0 0 0 125 0.0700 040.03 Haz. mat'l, contam'd soil removal/mitigation, ground water treatments 33,750 9,540 43,290 125 0.0700 3,03140.04 Environmental mitigation, e.g. wetlands, historic/archeologic, parks 0 0 0 125 0.0700 040.05 Site structures including retaining walls, sound walls 0 0 0 80 0.0703 040.06 Pedestrian / bike access and accommodation, landscaping 2,831,016 800,219 500,000 4,131,235 20 0.0944 389,95940.07 Automobile, bus, van accessways including roads, parking lots 18,721,551 5,291,862 2,422,000 26,435,413 20 0.0944 2,495,31640.08 Temporary Facilities and other indirect costs during construction 2,318,020 655,215 2,973,235 100 0.0701 208,36750 SYSTEMS 742,500 209,876 0 952,376 79,46250.01 Train control and signals 0 0 0 30 0.0806 050.02 Traffic signals and crossing protection 337,500 95,398 432,898 30 0.0806 34,88650.03 Traction power supply: substations 0 0 0 50 0.0725 050.04 Traction power distribution: catenary and third rail 0 0 0 30 0.0806 050.05 Communications 0 0 0 20 0.0944 050.06 Fare collection system and equipment 405,000 114,478 519,478 25 0.0858 44,57750.07 Central Control 0 0 0 30 0.0806 0Construction Subtotal (10 - 50)39,518,088 11,170,242 2,922,000 53,610,330 4,549,59060 ROW, LAND, EXISTING IMPROVEMENTS 11,174,225 1,671,000 12,845,225 899,35760.01 Purchase or lease of real estate 11,174,225 1,671,000 12,845,225 125 0.0700 899,35760.02 Relocation of existing households and businesses 0 0 125 0.0700 070 VEHICLES (number) 0 30,000,000 0 30,000,000 3,777,06070.01 Light <strong>Rail</strong> 0 0 0 25 0.0858 070.02 Heavy <strong>Rail</strong> 0 0 0 25 0.0858 070.03 <strong>Commuter</strong> <strong>Rail</strong> 0 0 0 25 0.0858 070.04 Bus 0 30,000,000 30,000,000 12 0.1259 3,777,06070.05 Other 0 0 0 12 0.1259 070.06 Non-revenue vehicles 0 0 0 12 0.1259 070.07 Spare parts 0 0 0 12 0.1259 080 PROFESSIONAL SERVICES 11,170,24280.01 Preliminary Engineering 1,181,53180.02 Final Design 2,756,90580.03 Project Management for Design and Construction 1,742,85780.04 Construction Administration & Management 3,938,43580.05 Insurance 080.06 Legal; Permits; Review Fees by other agencies, cities, etc. 1,550,51580.07 Surveys, Testing, Investigation, Inspection 080.08 Start upSubtotal (10 - 80)091,862,55590 UNALLOCATED CONTINGENCY 4,593,000Subtotal (10 - 90)The range for buses is 12 to 18 years.Provide supporting documentation for anestimated useful life of more than 12years.96,455,555 11,170,242 4,593,000 96,455,555 9,226,006parsons CHAPTER 6: ESTIMATION OF CAPITAL, OPERATING AND MAINTENANCE COSTS, AND REVENUE 152
CALTRAIN EXTENSION TO MONTEREY COUNTY PASSENGER RAIL STATIONSALTERNATIVES ANALYSISCALTRAIN EXTENSION ALTERNATIVE OPERATING AND MAINTENANCECOST ESTIMATESOperating Plan for Caltrain <strong>Extension</strong> AlternativeThe Caltrain <strong>Extension</strong> Alternative would extend existing and programmed Caltrain commuter railservice between Gilroy and Salinas with intermediate stops at Pajaro/Watsonville and Castroville. ThePeninsula Corridor Joint Powers Board (JPB) currently operates 96 daily trains between San Joseand San Francisco. Six of these trains operate between Gilroy and San Francisco. Prior to 2006,eight trains operated between Gilroy and San Francisco on weekdays.The Santa Clara Valley <strong>Transportation</strong> Authority (VTA) is the lead agency for Caltrain programdevelopment between San Jose and Gilroy. As part of its long-term Transit Capital InvestmentProgram, VTA has negotiated an agreement with UPRR which grants VTA/JPB rights to operate upto 20 trains (10 round trips) between Gilroy and San Jose upon completion of $35 million of capacityimprovements. These improvements include construction of 8.5 miles of double track (addition of asecond track) between San Jose and Gilroy on UPRR property. VTA also plans to construct a Gilroyyard facility to accommodate storage of 10 commuter rail train sets.<strong>Extension</strong> of the Caltrain service to Salinas would reduce or completely remove the need forexpansion of the Caltrain layover yard in Gilroy.Table 6-7 displays an illustrative timetable for 10 round trip trains operating between San Jose andGilroy 6 . For planning purposes, the schedules have been extended north to Mountain View and southto Salinas to indicate potential departure/arrival times. Trains indicated as “proposed service” wouldbest meet the needs of Monterey County commuters.To illustrate a more complete operating schedule, Table 6-8 reproduces a portion of the Caltrainpublic timetable, effective January 1, 2006. This table highlights the extension of three existing“Gilroy” round trip trains to/from Salinas. A fourth round trip train is also extended from San Jose toGilroy and Salinas for planning purposes.These schedules are preliminary and are based on train simulation/capacity modeling undertaken forUPRR. Factors which might affect scheduling include electrification of the Caltrain line north of SanJose; upgrades to the UPRR coast line track between Salinas and Gilroy; Caltrain/Amtrak schedulecoordination south of Gilroy; and schedule recovery “padding” to ensure reliability of Caltrain servicenorth of Gilroy. These schedule refinements would be expected to have minor impact on the Caltrain<strong>Extension</strong> Alternative operating and maintenance (O&M) cost estimate.6The San Jose–Gilroy portion of the schedule was developed in October 2004 and served as the basis of the agreement between UPRRand VTA.parsons CHAPTER 6: ESTIMATION OF CAPITAL, OPERATING AND MAINTENANCE COSTS, AND REVENUE 153
CALTRAIN EXTENSION TO MONTEREY COUNTY PASSENGER RAIL STATIONSALTERNATIVES ANALYSISTable 6-7<strong>Commuter</strong> Service between Salinas and Mountain View—Depart TimesSchedule ID 10 1 6 2 5 3 4 7 8 9Train # 215 121 New 227 New 231 235 New 239 141Northbound, a.m.Lv Salinas 3:54 4:21 4:44 5:07 5:30 5:50 6:07 6:30 6:54 7:21Lv Gilroy 4:49 5:16 5:39 6:02 6:25 6:45 7:02 7:25 7:49 8:16Lv San Jose 5:39 6:06 6:29 6:52 7:15 7:37 7:52 8:15 8:39 9:06Ar Mountain View 6:03 6:25 6:48 7:11 7:37 8:03 8:13 8:34 8:58 9:25Schedule ID 8 7 1 6 5 2 3 4 9 10Train # 258 New 160 262 New 164 270 172 278 284Southbound, p.m.Lv Mountain View 3:39 4:00 4:21 4:44 5:04 5:27 5:50 6:27 6:50 7:39Lv San Jose 4:01 4:23 4:45 5:06 5:28 5:51 6:16 6:49 7:16 8:01Lv Gilroy 4:52 5:15 5:36 5:57 6:20 6:42 7:07 7:41 8:08 8:53Ar Salinas 5:47 6:10 6:31 6:52 7:15 7:37 8:02 8:36 9:03 9:48Proposed serviceOther possible services645188AA-081parsons CHAPTER 6: ESTIMATION OF CAPITAL, OPERATING AND MAINTENANCE COSTS, AND REVENUE 154
CALTRAIN EXTENSION TO MONTEREY COUNTY PASSENGER RAIL STATIONSALTERNATIVES ANALYSISTable 6-8Caltrain Public TimetableGilroy/San Jose to San Francisco—NorthboundTrain # 101 103 305 207 309 211 313 215 217 319 221 323 225 227 329 231 233 135Salinas 5:12 5:35 6:10 6:37Castroville 5:22 5:45 6:20 6:47Pajaro 5:36 5:59 6:34 7:01Gilroy 6:07 6:30 7:05 7:32San Martin 6:16 6:39 7:14 7:41Morgan Hill 6:22 6:45 7:20 7:47Blossom Hill 6:35 6:58 7:33 8:00Capitol 6:41 7:04 7:39 8:06Tamien — 4:58 — 5:50 5:56 — — — 6:49 6:56 7:12 — — 7:47 7:56 8:14 8:33 —San Jose Diridon 4:30 5:05 5:45 5:57 6:03 6:22 6:45 6:50 6:57 7:03 7:20 7:45 7:50 7:55 8:03 8:22 8:40 9:10College Park — — — — — — — — — — — — — 7:58 — — — —Santa Clara 4:35 5:10 — 6:02 — 6:27 — — 7:02 — 7:25 — — 8:02 — 8:27 8:45 9:15Lawrence 4:40 5:15 — 6:12 — — — — 7:12 — 7:30 — — 8:12 — — 8:50 9:20Sunnyvale 4:44 5:19 — 6:18 6:13 — — 7:00 7:18 7:13 — — 8:00 8:18 8:13 — 8:54 9:24Mountain View 4:49 5:24 5:57 6:23 — 6:37 6:57 7:05 7:23 — 7:37 7:57 8:05 8:23 — 8:37 8:59 9:29San Antonio 4:53 5:28 — 6:27 — — — — 7:27 — — — — 8:27 — — 9:03 9:33California Avenue 4:57 5:32 — 6:31 — — — 7:11 7:31 — — — 8:11 8:31 — — 9:07 9:37Palo Alto 5:01 5:36 6:05 6:36 6:23 — 7:05 7:16 7:36 7:23 — 8:05 8:16 8:36 8:23 — 9:11 9:41Menlo Park 5:04 5:39 — 6:39 — 6:45 — — 7:39 — 7:45 — — 8:39 — 8:45 9:14 9:44Redwood City 5:09 5:44 — 6:45 6:30 6:51 — — 7:45 7:30 7:51 — — 8:45 8:30 8:51 9:19 9:49San Carlos 5:13 5:48 — — — 6:55 — 7:24 — — 7:55 — 8:24 — — 8:55 9:23 9:53Belmont 5:16 5:51 — — — 6:58 — — — — 7:58 — — — — 8:58 9:26 9:56Hillsdale 5:19 5:54 6:16 6:51 — 7:02 7:16 7:28 7:51 — 8:02 8:16 8:28 8:51 — 9:02 9:29 9:59Hayward Park 5:22 5:57 — — — 7:05 — — — — 8:05 — — — — 9:05 — 10:02San Mateo 5:25 6:00 — — 6:39 7:08 — 7:32 — 7:39 8:08 — 8:32 — 8:39 9:08 9:33 10:05Burlingame 5:28 6:03 — — — 7:11 — 7:35 — — 8:11 — 8:35 — — 9:11 9:36 10:08Millbrae 5:33 6:08 6:24 6:59 6:45 7:17 7:24 — 7:59 7:45 8:17 8:24 — 8:59 8:45 9:17 9:41 10:13San Bruno 5:37 6:12 — — — 7:21 — 7:42 — — 8:21 — 8:42 — — 9:21 9:45 10:17So. San Francisco 5:41 6:16 — 7:05 — 7:25 — — 8:05 — 8:25 — — 9:05 — 9:25 — 10:21Bayshore 5:47 6:22 — — — 7:33 — — — — 8:33 — — — — 9:31 — 10:2722nd Street 5:52 6:27 — — — 7:40 — — — — 8:40 — — — — 9:37 — 10:32San Francisco 6:01 6:36 6:42 7:19 7:02 7:48 7:42 7:57 8:19 8:02 8:48 8:42 8:57 9:19 9:02 9:45 10:02 10:41San Francisco to San Jose/Gilroy—SouthboundTrain # 154 256 158 260 362 264 266 368 270 372 274 276 378 280 382 284 386 288San Francisco 2:07 2:37 3:07 3:37 4:09 4:19 4:27 4:33 4:56 5:14 5:20 5:27 5:33 5:56 6:14 6:27 6:33 6:5622nd Street 2:12 — 3:12 — — — 4:32 — — — — 5:32 — — — 6:32 — —Bayshore 2:17 — 3:17 — — — 4:40 — — — — 5:40 — — — 6:40 — —So. San Francisco 2:23 — 3:23 — — — 4:48 — 5:08 — — 5:48 — 6:08 — 6:48 — 7:08San Bruno 2:27 2:51 3:27 3:51 — 4:33 4:52 — — — 5:34 5:52 — — — 6:52 — —Millbrae 2:31 2:55 3:31 3:55 4:25 — 4:56 4:49 5:14 5:30 — 5:56 5:49 6:14 6:30 6:56 6:49 7:14Burlingame 2:35 2:59 3:35 3:59 — 4:38 5:00 — — — 5:39 6:00 — — — 7:00 — —San Mateo 2:38 3:02 3:38 4:02 — 4:42 5:04 4:57 — — 5:43 6:04 5:57 — — 7:04 6:57 —Hayward Park 2:41 — 3:41 — — — 5:07 — — — — 6:07 — — — 7:07 — —Hillsdale 2:44 3:06 3:44 4:06 4:33 4:47 5:11 — 5:22 5:38 5:48 6:11 — 6:22 6:38 7:11 — 7:22Belmont 2:47 3:09 3:47 4:09 — — 5:14 — — — — 6:14 — — — 7:14 — —San Carlos 2:50 3:12 3:50 4:12 — 4:51 5:18 — — — 5:52 6:18 — — — 7:18 — —Redwood City 2:55 3:17 3:55 4:17 — — 5:22 5:06 5:28 — — 6:22 6:06 6:28 — 7:22 7:06 7:28Menlo Park 3:00 3:22 4:00 4:22 — — 5:28 — 5:34 — — 6:28 — 6:34 — 7:28 — 7:34Palo Alto 3:03 3:25 4:03 4:25 4:44 5:01 — 5:12 5:38 5:49 6:02 — 6:12 6:38 6:49 — 7:12 7:38California Avenue 3:07 3:29 4:07 4:29 — 5:05 — — 5:42 — 6:06 — — 6:42 — — — 7:42San Antonio 3:11 3:33 4:11 4:33 — — — — 5:46 — — — — 6:46 — — — 7:46Mountain View 3:15 3:37 4:15 4:37 4:51 5:11 5:36 — 5:50 5:56 6:12 6:36 — 6:50 6:56 7:36 — 7:50Sunnyvale 3:20 3:42 4:20 4:42 — 5:16 — 5:21 5:55 — 6:17 6:21 6:55 — — 7:21 7:55Lawrence 3:24 3:46 4:24 4:46 — — — — 6:01 — — 6:43 — 7:01 — — — 7:59Santa Clara 3:29 3:51 4:29 4:51 — — 5:47 — 6:08 — — 6:48 — 7:08 — 7:47 — 8:04College Park — — 4:32 — — — — — — — — — — — — — — —San Jose Diridon 3:38 4:00 4:39 5:00 5:06 5:27 5:55 5:32 6:16 6:11 6:28 6:56 6:32 7:16 7:11 7:55 7:32 8:12Tamien — 4:07 4:45 5:07 — 5:33 — 5:39 6:22 — — 7:02 6:39 7:23 — — 7:39 8:19Capitol 4:52 5:40 6:29 7:09Blossom Hill 4:58 5:46 6:35 7:15Morgan Hill 5:11 5:59 6:48 7:28San Martin 5:17 6:05 6:54 7:34Gilroy 5:30 6:18 7:07 7:47Pajaro 6:01 6:49 7:38 8:18Castroville 6:15 7:03 7:52 8:32Salinas 6:25 7:13 8:02 8:42Gilroy/Salinas service645188AA-082parsons CHAPTER 6: ESTIMATION OF CAPITAL, OPERATING AND MAINTENANCE COSTS, AND REVENUE 155
CALTRAIN EXTENSION TO MONTEREY COUNTY PASSENGER RAIL STATIONSALTERNATIVES ANALYSISOperating and Maintenance Cost Estimates for Caltrain <strong>Extension</strong> AlternativeOperating and maintenance cost estimates have been developed for the Caltrain <strong>Extension</strong> Alternativebased on JPB experience with operating Caltrain service between Gilroy and San Francisco.Table 6-9 reports actual and forecast O&M history for Caltrain service between FY 2001 and FY 2007(projected). The table indicates that operating expenses remained relatively constant from FY 2001through FY 2004, but have increased during the past three years as the number of trains operatedhas increased. FY 2007 service is forecast to remain unchanged from FY 2006 levels.Given this well established cost basis, O&M expense for the Caltrain extension of service to Salinasis based on the incremental addition of service associated with the operation of two, three or fourround trip trains between Salinas and Gilroy. Train service between Gilroy and San Francisco wouldbe unchanged by the Caltrain <strong>Extension</strong> Alternative extension of service.Table 6-10 indicates the anticipated increase in O&M expense associated with two, three or fourround trip trains between Gilroy and Salinas. Fully allocated costs are assumed for all expense categoriesexcept shuttle bus service on the peninsula and head end power debt service. An allowance isincluded under “rail operator extra work” for basing train crews in Salinas rather than Gilroy.Table 6-9Peninsula Corridor Joint Powers Board Expense Budget (FY 2001–2007)Expense DescriptionFY 2001ActualFY 2002ActualFY 2003ActualFY 2004ActualFY 2005ActualFY 2006RevisedFY 2007ProposedOperating Expense<strong>Rail</strong> operator service $39,152,888 $39,978,701 $42,750,000 $42,105,709 $45,444,945 $50,644,650 $54,814,110Shuttle service 4,759,804 4,724,215 4,232,360 3,236,339 2,725,038 2,929,231 2,929,231Fuel 4,652,707 3,669,723 3,594,540 4,570,479 7,364,964 8,485,531 10,147,799Timetables and tickets 366,846 188,627 323,000 257,708 171,921 280,000 275,000Insurance 3,041,018 3,649,321 3,436,540 3,251,469 3,607,201 4,042,000 3,810,078Facilities and equipment 1,031,271 1,483,738 1,523,340 1,348,755 1,626,485 1,965,957 1,546,600Utilities 707,050 982,880 1,109,810 693,053 793,690 896,345 937,260Total Operating Expense $53,711,584 $53,677,205 $56,969,590 $55,463,512 $61,734,243 $69,243,714 $74,460,078Administrative ExpenseWages and benefits $ 2,869,128 $ 3,612,613 $ 3,934,310 $ 4,269,643 $ 4,223,298 $ 4,227,642 $ 5,009,905Board of Directors 22,693 23,236 22,000 17,758 19,453 18,800 19,300Professional services 1,814,749 2,056,790 1,833,440 1,674,472 2,280,049 1,211,886 1,322,568Marketing 255,593 191,251 369,400 358,627 304,244 316,900 298,400Other expenses 1,518,682 1,975,596 1,286,430 1,302,535 1,545,263 1,634,036 1,884,278Total Administrative Expense $ 6,480,845 $ 7,859,486 $ 7,445,580 $ 7,623,034 $ 8,372,308 $ 7,409,264 $ 8,534,451Head End Power Debt Service $ 341,434 $ 365,546 $ 365,800 $ 367,235 $ 364,617 $ 363,200 $ 366,190Capital Contingency FundMainline $ 960,000 $ 960,000 $ 960,000 $ 960,000 $ 960,000 $ 660,000 $ 660,000Gilroy 50,000 50,000 50,000 50,000 50,000 50,000 50,000Total Capital Contingency Fund $ 1,010,000 $ 1,010,000 $ 1,010,000 $ 1,010,000 $ 1,010,000 $ 710,000 $ 710,000Total Expense $61,543,863 $62,912,237 $65,790,970 $64,463,781 $71,481,168 $77,726,178 $84,070,719645188AA-083parsons CHAPTER 6: ESTIMATION OF CAPITAL, OPERATING AND MAINTENANCE COSTS, AND REVENUE 156
CALTRAIN EXTENSION TO MONTEREY COUNTY PASSENGER RAIL STATIONSALTERNATIVES ANALYSISTable 6-10Caltrain <strong>Extension</strong> Alternative Operating and Maintenance Cost ($ FY 2007)Expense CategoryFY 2007Weekday Round Trip TrainsCost Basis Variable Two Three Four<strong>Rail</strong> operator $54,814,110 Train hours $1,409,983 $2,115,002 $2,819,966<strong>Rail</strong> operator extra work Included LS 225,000 337,500 450,000Shuttles 2,929,231 LS — —Fuel 10,147,799 Train miles 291,465 437,198 582,930Timetables and tickets 275,000 Passengers 17,669 26,503 35,338Insurance 3,810,078 Train miles 109,433 164,150 218,866Facilities and equipment 1,546,600 Stations 159,993 159,993 159,993Utilities 937,260 Stations 96,958 96,958 96,958Administrative expense 8,534,451 % allocation 548,338 822,508 1,096,676Head end power debt service 366,190 LS —Total $83,360,719 $2,633,839 $3,822,312 $5,010,727UPRR track use charge Train miles 528,841 793,262 1,057,682UPRR slot fees RT trains 1,098,000 1,647,000 2,196,000$4,485,680 $6,600,074 $8,714,409645188AA-084In addition to JPB fees for the assumed purchase of service described in Chapter 4, Table 6-10includes UPRR fees for the use of its track between Gilroy and Salinas. First, a track use charge isincluded based on the number of Caltrain train miles operated annually over the extended route toSalinas. Recent experience of the San Joaquin Regional <strong>Rail</strong> Commission with UPRR related to theACE service forms the basis of this track use charge. The fee would cover train scheduling, trackmaintenance and repair, and capital investment recovery. Second, a “slot fee” is included with theO&M cost estimate. This fee would be negotiated with UPPR—hence, the precise cost is unknown.The amount indicated in Table 6-10 is based on the VTA purchase of Caltrain trackage rights fromUPRR in southern Santa Clara County. The slot fees have been annualized for 15 years at a discountrate of seven percent.EXPRESS BUS ALTERNATIVE OPERATING AND MAINTENANCE COSTESTIMATESOperating and maintenance cost estimates have been developed for the Express Bus Alternativebased on MST experience with operating local and longer distance fixed route, fixed schedule busservice throughout Monterey County.Table 6-11 reports actual and forecast O&M cost parameters for MST fixed route bus servicebetween FY 2002 and FY 2007 (proposed). The table indicates that operating expenses per hour andmile rose gradually between FY 2002 and FY 2005, but have risen at a faster rate in FY 2006 andFY 2007 (projected) due to increases in retirement benefits, fuel and purchased transportation 7 .7Additional routes and existing shuttle services contracted to MV <strong>Transportation</strong>, Inc., which operates 17 passenger vans.parsons CHAPTER 6: ESTIMATION OF CAPITAL, OPERATING AND MAINTENANCE COSTS, AND REVENUE 157
CALTRAIN EXTENSION TO MONTEREY COUNTY PASSENGER RAIL STATIONSALTERNATIVES ANALYSISTable 6-11Monterey–Salinas Transit Fixed Route Bus Operating and Maintenance Cost ParametersFY 2002ActualFY 2003ActualFY 2004ActualFY 2005ActualFY 2006BudgetedFY 2007ProposedTotal operating expense $13,913,880 $15,678,182 $16,580,573 $17,074,778 $19,122,802 $21,584,207Employees 212 220 218 214 216 223Fixed route vehicles 77 79 95 99 98 100Vehicle revenue miles 2,878,871 3,082,365 2,878,702 2,929,738 2,905,878 3,120,443Vehicle revenue hours 204,921 210,871 197,416 196,699 198,581 205,371Vehicle revenue hours/employee 967 959 906 919 919 921Expense/mile $4.83 $5.09 $5.76 $5.83 $6.58 $6.92Expense/hour 1 $67.90 $74.35 $83.99 $86.81 $96.29 $105.10Operating cost/hour 2 $55.26 $64.54 $65.78 $72.65 $87.50 $102.311Fully allocated and loaded 645188AA-0852Fully allocated cost for new serviceFor new service, MST has established a “fully allocated cost per vehicle hour” which is less than itsfully allocated and loaded expense per vehicle hour. The fully allocated cost for service in FY 2007 isproposed to be $102.31 per vehicle hour for new service. This unit cost assumes that thefundamental nature of the new service will be similar to the existing Monterey–Salinas Transit fixedroute bus operations.In the case of the Express Bus Alternative, the fundamental nature of the proposed service isdifferent from normal Monterey–Salinas Transit fixed-route, fixed-schedule operations. Whereasvirtually all Monterey–Salinas Transit service operates under relatively low speed, and therefore lowmileage per hour conditions, the express bus alternative would incur high mileage per hour ofoperation. A cost model based on multiple parameters, such as cost per revenue vehicle hour, mile,and vehicles operated was developed to more accurately forecast operations and maintenance costsfor the Express Bus Alternative.Table 6-12 provides a historical and projected overview of Monterey–Salinas Transit’s operating andmaintenance expenses by major cost object for FY 2005 actual through FY 2007 proposed. Table 6-13provides additional detail, with expenses broken down by both object and function. Functions aredefined as follows:Vehicle OperationsVehicle MaintenanceIncludes operating buses, and scheduling the buses and drivers.Includes preventive and corrective maintenance on revenue and supportvehicles, as well as updating vehicle records, and servicing and fuelingvehicles.Facilities Maintenance Includes maintenance of grounds, buildings, and bus stops.General Administration Includes transit planning, customer services, marketing, finance and accounting,computer system, personnel administration, and legal services.Each of the object and function combinations can be described as (1) fixed in the short run, (2) variableproportional to mileage, or (3) variable proportional to hours of service. A cost forecasting model,sensitive to changes in the quantity of service operated, can then be developed.parsons CHAPTER 6: ESTIMATION OF CAPITAL, OPERATING AND MAINTENANCE COSTS, AND REVENUE 158
CALTRAIN EXTENSION TO MONTEREY COUNTY PASSENGER RAIL STATIONSALTERNATIVES ANALYSISTable 6-12Monterey–Salinas Transit Fixed Route Bus Operating Expense RecapAccount Object FY 2005 Actual FY 2006 Budgeted FY 2007 Proposed501 Labor $ 7,941,660 $ 8,068,833 $ 8,724,377502 Fringe benefits 4,523,988 5,450,872 6,342,440503 Services 730,135 1,056,160 1,077,870504 Materials and supplies 2,178,374 2,520,428 2,789,280505 Utilities 233,007 224,829 233,106506 Casualty and liability 291,688 597,108 472,108507 Taxes 120,989 151,242 174,845508 Purchased transportation 828,864 789,283 1,528,833509 Miscellaneous 218,175 223,347 224,948512 Leases and agreements 7,898 40,700 16,400Total Expenses $17,074,778 $19,122,802 $21,584,207The cost forecasting model is of the form:WhereC (m,h,v) – m C m + h C h + v C vC (m,v,h) = the estimated cost for a service consisting ofm = operating miles,h = operating hours, andv = peak operating vehiclesC m = the expected incremental operating cost of an additional mileC h = the expected incremental operating cost of an additional hourC v = the expected incremental operating cost of an additional peak vehicleOf these, the peak hour vehicle cost is the most difficult to apply in practice. Many transit costs, such asadministration and utilities, are fixed in the short run and an additional number of vehicles (within somesmall range) can be operated without adding to the staff of general management, accounting, legal,planning and marketing functions. However, after a period of time, these costs will rise in response toincreased service. While the addition of a single bus cannot be causally linked to a specific increase inthese costs, the Express Bus Alternative requires the addition of 10 or more vehicles—a level ofsufficient scale as to think of the short run fixed costs as variable.All Monterey–Salinas Transit costs for FY 2005 through FY 2007 were assigned to one of the three costdrivers—miles, hours and peak vehicles (fixed) as shown in Table 6-11.From this table, one can estimate the coefficients for the cost model by dividing the cost totals by thevalue of the cost drivers (miles, hours and vehicles). The estimates are:FY 2005 FY 2006 FY 2007C m = $ 1.58 $ 1.78 $ 1.82C h = $45.29 $48.45 $56.23Cv = $55,948 $67,606 $68,055parsons CHAPTER 6: ESTIMATION OF CAPITAL, OPERATING AND MAINTENANCE COSTS, AND REVENUE 159
CALTRAIN EXTENSION TO MONTEREY COUNTY PASSENGER RAIL STATIONSALTERNATIVES ANALYSISTable 6-13Allocation of Monterey–Salinas Transit FY 2005–FY 2007 Operating Costs to Cost DriversFunction and ObjectBasisFY 2005Actual AmountFY 2006Budget AmountFY 2007Proposed AmountVehicle OperationsSalaries and wages Hours $ 5,317,181 $ 5,213,521 $ 5,970,888Fringe benefits Hours 3,055,844 3,909,141 4,578,099Services Fixed 88,673 142,600 102,378Materials and supplies Miles 1,439,424 1,807,191 1,996,817Taxes Miles 85,333 104,174 125,533Leases and rentals Fixed 4,974 30,500 7,500Subtotal $ 9,991,430 $11,207,126 $12,781,216Vehicle MaintenanceSalaries and wages Miles $ 1,386,218 $ 1,396,868 $ 1,395,921Fringe benefits Miles 821,084 959,436 975,231Services Miles 91,751 101,960 104,853Materials and supplies Miles 434,516 428,386 465,213Casualty and liability Miles 63,442 45,000 45,000Taxes Miles 26,398 38,068 40,312Leases and rentals Miles 0 3,000 2,000Subtotal $ 2,823,409 $ 2,972,718 $ 3,028,530Facilities MaintenanceSalaries and wages Fixed $ 190,602 $ 240,619 $ 252,112Fringe benefits Fixed 113,283 118,456 134,626Services Fixed 205,147 325,800 394,839Materials and supplies Fixed 70,837 85,750 97,050Leases and rentals Fixed 106 1,800 1,500Subtotal $ 579,974 $ 772,425 $ 880,127General AdministrationSalaries and wages Fixed $ 1,047,659 $1,142,684 $ 1,105,456Fringe benefits Fixed 533,777 664,082 654,484Services Fixed 344,564 485,800 475,800Materials and supplies Fixed 233,597 199,000 230,200Utilities Fixed 233,007 224,829 233,106Casualty and liability Fixed 228,246 427,108 427,108Taxes Fixed 9,258 9,000 9,000Purchase transportation Hours 535,938 498,852 1,000,041Miles 292,926 290,431 528,792Miscellaneous Fixed 218,175 223,347 224,948Leases and rentals Fixed 2,818 5,400 5,400Subtotal $ 3,679,965 $ 4,170,533 $ 4,894,335Total $17,074,778 $19,122,802 $21,584,207Source: Monterey-Salinas Transit FY 2007 Budget, Parsonsparsons CHAPTER 6: ESTIMATION OF CAPITAL, OPERATING AND MAINTENANCE COSTS, AND REVENUE 160
CALTRAIN EXTENSION TO MONTEREY COUNTY PASSENGER RAIL STATIONSALTERNATIVES ANALYSISTable 6-14 lists the operating parameters associated with Year 2030 conditions, with the express busfleet transporting just under 2000 passengers in the peak commute direction during the AM and PMpeak periods. This scenario is equivalent to the four-train Caltrain <strong>Extension</strong> scenario.Table 6-14Express Bus Alternative Operating Parameters (2030 Conditions)Origin–DestinationRevenueRound Trip Revenue Miles Revenue HoursFrequency Daily MaximumMiles Hours (Minutes) Trips Vehicles Daily Annual Daily AnnualAveragePassengerLoad/Vehicle†Pajaro–Santa Clara Mid 107 3.08 30 8 4 856 218,280 24.67 6,291 41.75Pajaro–Santa Clara North* 128 3.97 30 16 8 2,048 522,240 63.47 16,185 45.25Pajaro–San Mateo/San Francisco 205 6.17 60 4 2 820 209,100 24.67 6,291 30.0Marina/Castroville–Santa Clara Mid 125 3.67 60 4 2 500 127,500 14.67 3,741 25.0Marina/Castroville–Santa Clara North 146 4.55 30 8 4 1,168 297,840 36.40 9,282 27.25Marina/Castroville–San Mateo/San Francisco 223 6.75 60 4 2 892 227,460 27.00 6,885 9.5Salinas–Santa Clara Mid** 132 4.00 30 16 8 2,112 538,560 64.00 16,320 42.5Salinas–Santa Clara North* 153 4.88 15 32 16 4,896 1,248,480 156.27 39,849 45.94Salinas–San Mateo/San Francisco 230 7.08 30 8 4 1,840 469,200 56.67 14,450 30.50Totals 50 14,722 3,858,660 467.82 119,294 39.26*Includes two stop groups—Mountain View and San Antonio; California and Palo Alto**Includes two stop groups—Diridon and Santa Clara; Lawrence and Sunnyvale†Peak directionTable 6-15 indicates the anticipated O&M expense associated with MST operating variousincrements of express buses to/from Santa Clara, San Mateo, and San Francisco counties eachweekday, excluding holidays. None of MST’s vehicle operators work straight, eight-hour shifts bydesign of its Union contract. Therefore, round trips to/from the San Francisco Bay Area would be splitinto two work pieces, with separate drivers working the morning and afternoon shifts.Average round trip travel time between Monterey County park-and-ride lots and San Francisco BayArea sets of Caltrain stations is computed to be 5.31 hours per shift, comprised of driverreport/inspection times, revenue service, driver recovery, and deadhead to/from the operationscenter. Some driver shifts would be less, some more, depending on the station sets served by theexpress bus routes. Run time estimates are based on anticipated 2030 conditions. Year 2010 runtimes, and therefore O&M costs, would be less.The O&M expenses identified in Table 6-15 assume that express bus vehicles have a seatedcapacity of 45 passengers per vehicle, and operate with an average load of 39 passengers pervehicle, equal to 87 percent of their seated capacity. 8 Lower or higher utilization rates and fewer ormore average pay hours per shift would affect these cost estimates. A minimum floor of eight vehiclesoperated in maximum service is reflected in the table, representing two trips per peak periodoperating from each park-and-ride facility in Monterey County. Increasing ridership levels could bematched closely by capacity increases given the relatively small size of the express bus units (45passengers per vehicle versus 550 to 700 passengers per four- or five-car train.8Average load = 1963 passengers/50 trips = 39.26 passengers/bus in peak direction.parsons CHAPTER 6: ESTIMATION OF CAPITAL, OPERATING AND MAINTENANCE COSTS, AND REVENUE 161
CALTRAIN EXTENSION TO MONTEREY COUNTY PASSENGER RAIL STATIONSALTERNATIVES ANALYSISTable 6-15Express Bus Alternative Operating and Maintenance CostWeekday RidershipLevel (MontereyCounty Boardings)Vehicles OperatedinMaximum ServiceAnnual VehicleRevenueMilesAnnual VehicleRevenueHoursAnnualOperating Expense300 8 617,386 19,087 2,741,346500 13 1,003,252 31,016 4,454,6871,000 25 1,929,330 59,647 8,566,7071,250 32 2,469,542 76,348 10,965,3841,500 38 2,932,582 90,663 13,021,3931,750 44 3,395,621 104,979 15,077,4032,000 50 3,858,660 119,294 17,133,413PASSENGER REVENUESEstimated passenger revenues are based on the ridership forecasts reported in Chapter 4 and theJPB Caltrain fare structure effective as of January 1, 1996. Caltrain currently operates with a six zonefare system. The limits of the fare zones along with the proposed extension of Caltrain service (orexpress bus) to Salinas are illustrated on Figure 6-1. The Caltrain <strong>Extension</strong> Alternative and ExpressBus Alternative would expand the fare structure from six to eight zones. Zone 7 would be reserved forfuture (potential) service to Hollister, while Zone 8 would cover northern Monterey County. Table 6-16reports the existing fares as of January 1, 2006 with the inclusion of two additional zones to serveSan Benito (Hollister) and Monterey counties. Table 6-17 provides a comparison of the maximum ridedistances within and between Caltrain fare zones for reference.Based on the daily ridership estimated in Chapter 4 and the proposed eight zone fare structure,annual passenger revenue has been computed for various levels of ridership. These estimates ofpassenger revenue are reported in Table 6-18 and are based on all riders purchasing a monthly adultticket which is utilized for 40 one-way rides per month. Forecasts denoted as Year 2000 are nowviewed to be appropriate for the opening year, 2010 planning horizon 9 .9Chapter 2 of this <strong>Alternatives</strong> <strong>Analysis</strong> discusses commuting trends observed between 2000 and 2005 insofar as gateway traffic volumesand regional rail ridership. Based on this information, it appears that 2006 travel demand conditions are similar to Year 2000 traveldemand conditions with respect to long distance commutes from outlying counties to Silicon Valley employers. Thus, references to Year2000 demand and ridership projections are assumed to be now realized in 2010. Year 2020 ridership projections are assumed to be nowrealized in 2030.parsons CHAPTER 6: ESTIMATION OF CAPITAL, OPERATING AND MAINTENANCE COSTS, AND REVENUE 162
CALTRAIN EXTENSION TO MONTEREY COUNTY PASSENGER RAIL STATIONSALTERNATIVES ANALYSISFigure 6-1Caltrain Map and Fare Zones645188AA-079parsons CHAPTER 6: ESTIMATION OF CAPITAL, OPERATING AND MAINTENANCE COSTS, AND REVENUE 163
CALTRAIN EXTENSION TO MONTEREY COUNTY PASSENGER RAIL STATIONSALTERNATIVES ANALYSISTable 6-16Proposed Fares and Zones ($ 2006)AdultNumber of Fare Zones in Journey1 2 3 4 5 6 7 8One-Way $2.25 $3.75 $5.25 $6.75 $8.25 $9.75 $11.25 $12.75Day Pass $4.50 $7.50 $10.50 $13.50 $16.50 $19.50 $22.50 $25.5010-Ride Ticket $19.25 $32.00 $44.75 $57.50 $70.25 $83.00 $97.75 $108.50Monthly Ticket $59.75 $99.50 $139.25 $179.00 $218.75 $258.50 $298.25 $338.00Monthly ÷ 40 Rides* ($1.4937) ($2.4875) ($3.4813) ($4.475) ($5.4687) ($6.4625) ($7.4563) ($8.45)Senior/Disabled/YouthOne-Way $1.00 $1.75 $2.50 $3.25 $4.00 $4.75 $5.50 $6.25Day Pass $2.25 $3.75 $5.25 $6.75 $8.25 $9.75 $11.25 $12.7510-Ride Ticket $9.50 $16.00 $22.25 $28.75 $35.00 $41.50 $47.75 $54.25Monthly Ticket $29.75 $49.75 $69.50 $89.50 $109.25 $129.25 $149.25 $169.25*One way cost assuming 40 tripsZone upgrade $1.50Senior/Disabled/Youth Zone Upgrade $0.75ZoneCaltrain StationsMilepostLimits1 4 th /King; 22 nd Street; Paul Avenue; Bayshore; South San Francisco; San Bruno 0–11.62 Millbrae; Broadway; Burlingame; San Mateo; Hayward Park; Bay Meadows; Hillsdale; Belmont; San 13.7–25.4Carlos; Redwood City3 Atherton; Menlo Park; Palo Alto; Stanford; California Avenue; San Antonio; Mountain View; Sunnyvale 27.8–38.84 Lawrence; Santa Clara; College Park; San Jose Diridon; Tamien 40.8–49.15 Capitol; Blossom Hill 52.4–55.76 Morgan Hill; San Martin; Gilroy 67.5–77.27 No Stations —8 Pajaro; Castroville; Salinas 97.1–114.9645188AA-087Table 6-17Maximum Caltrain Zone Ride Distance (Miles)Zone 1 2 3 4 5 6 7 81 11.6 25.4 38.8 49.1 55.7 77.2 — 114.92 25.4 11.7 25.1 35.4 42.0 63.5 — 101.23 38.8 25.1 11 21.3 27.9 49.4 — 87.14 49.1 35.4 21.3 8.3 14.9 36.4 — 73.35 55.7 42.0 27.9 14.9 3.3 24.8 — 62.56 77.2 63.5 49.4 36.4 24.8 9.7 — 47.47 — — — — — — — —8 114.9 101.2 87.1 73.3 62.5 47.4 — 17.8645188AA-088parsons CHAPTER 6: ESTIMATION OF CAPITAL, OPERATING AND MAINTENANCE COSTS, AND REVENUE 164
CALTRAIN EXTENSION TO MONTEREY COUNTY PASSENGER RAIL STATIONSALTERNATIVES ANALYSISTable 6-18Passenger Revenue (Eight-Zone Fare Structure—$ 2006)Egress2000 1Fare ZoneDaily Boardings inMonterey CountyAnnual2-Way RidersAverageFareAnnualRevenueSanta Clara-Mid 1 291 148,410 $5.4687 $ 811,610Santa Clara-North 2 632 322,320 $6.4625 2,082,993San Mateo 3 72 36,720 $7.4563 273,795San Francisco 4 33 16,830 $8.45 142,214Total 1,028 524,280 $3,310,6122006Santa Clara-Mid 1 395 201,450 $5.4687 $1,101,670Santa Clara-North 2 854 435,540 $6.4625 2,814,677San Mateo 3 97 49,470 $7.4563 368,863San Francisco 4 44 22,440 $8.45 189,618Total 1,390 708,900 $4,474,8282010Santa Clara-Mid 1 492 250,920 $5.4687 $1,372,206Santa Clara-North 2 1,064 542,640 $6.4625 3,506,811San Mateo 3 121 61,710 $7.4563 460,128San Francisco 4 54 27,540 $8.45 232,713Total 1,731 882,810 $5,571,8582020 2Santa Clara-Mid 1 557 284,070 $5.4687 $1,553,494Santa Clara-North 2 1,206 615,060 $6.4625 3,974,825San Mateo 3 137 69,870 $7.4563 520,972San Francisco 4 63 32,130 $8.45 271,499Total 1,963 1,001,130 $6,320,7902025Santa Clara-Mid 1 579 295,290 $5.4687 $1,614,852Santa Clara-North 2 1,253 639,030 $6.4625 4,129,731San Mateo 3 143 72,930 $7.4563 543,788San Francisco 4 64 32,640 $8.45 275,808Total 2,039 1,039,890 6,564,1792030Santa Clara-Mid 1 600 306,000 $5.4687 $1,673,422Santa Clara-North 2 1,300 663,000 $6.4625 4,284,638San Mateo 3 147 74,970 $7.4563 558,999San Francisco 4 67 34,170 $8.45 288,737Total 2,114 1,078,140 $6,805,79612000 forecast applies to Year 2010 planning horizon 645188AA-08922020 forecast applies to Year 2030 planning horizonparsons CHAPTER 6: ESTIMATION OF CAPITAL, OPERATING AND MAINTENANCE COSTS, AND REVENUE 165
CALTRAIN EXTENSION TO MONTEREY COUNTY PASSENGER RAIL STATIONSALTERNATIVES ANALYSISThis page intentionally left blank.parsons CHAPTER 6: ESTIMATION OF CAPITAL, OPERATING AND MAINTENANCE COSTS, AND REVENUE 166
CALTRAIN EXTENSION TO MONTEREY COUNTY PASSENGER RAIL STATIONSALTERNATIVES ANALYSISCHAPTER 7: FINDINGS FROM PUBLIC AND STAKEHOLDERWORKSHOPS ON ALTERNATIVESPublic meetings and stakeholder workshops have been held during the course of the projectdevelopment process to solicit input regarding facility design and environmental impact mitigation.This public involvement has focused on the Caltrain <strong>Extension</strong> Alternative/Express Bus Alternativefacilities (stations, park-and-ride, layover base) within the context of the Caltrain <strong>Extension</strong> toMonterey County/Salinas.Insofar as the Caltrain <strong>Extension</strong> Alternative service (two to four round trips of Caltrain commuter railservice), no public comments have been received regarding operation of the train service over theUnion Pacific <strong>Rail</strong>road (UPRR) Coast Line track between Salinas and Gilroy. All public comment andinput has related to facility location and design.As part of the Monterey County Fixed Guideway Study, the provision of passenger rail service to theMonterey Peninsula via the Monterey Branch line has been examined. Public input has beenreceived regarding this alignment and is reported in this section.The public involvement program has focused on the Caltrain <strong>Extension</strong> Alternative service andfacilities as the Express Bus Alternative facilities are a subset of the Caltrain <strong>Extension</strong> Alternative,with the exception of the Marina/CSUMB (California State University–Monterey Bay) MST (Monterey–Salinas Transit) Transit Center.As part of the environmental document scoping process, community meetings regarding the provisionof passenger rail service, the proposed location of stations and support facilities, and the conceptualdesign of Caltrain facilities were held in Pajaro (March 31, 2003), Castroville (January 15, 2003) andSalinas (March 31 and April 2, 2003). Public comments received during these meetings wereincluded as part of the Initial Study prepared for the project. Summaries of these community andpublic meetings comments are included below.PAJARO COMMUNITYThe community of Pajaro is located on the edge of the city of Watsonville. Its population fluctuatesbetween approximately 3,400 in the winter months and approximately 7,000 in the summer months.Watsonville’s population numbered 44,265 at the time of the 2000 census and is now estimated bythe Association of Monterey Bay Area Governments to be 52,716 as of Year 2005. In 2000, thePajaro Station Area Feasibility <strong>Analysis</strong> indicated that new passenger and freight train activityprovides the opportunity to create mixed-use and industrial development to generate jobs for localresidents and to achieve a balanced community. Such a development could be based around apassenger rail station and expanded freight-handling capabilities.The existing facility is located at the UPRR Watsonville junction just east of the intersection of SalinasRoad and <strong>Rail</strong>road Avenue and just north of Lewis Road. It was constructed in 1948 and consists of a7,600-quare-foot wood and stucco-wood building and an asphalt concrete platform. The existingplatform is adjacent to the Santa Cruz branch line tracks. There is no platform adjacent to the CoastLine tracks that could be used for the proposed passenger service. There is also a 40,000-squarefootasphalt concrete parking area at the station.Freight activity at the Pajaro Valley station is currently generated by through traffic, loading andunloading of freight on the team track and spurs, storage of tank cars, maintenance of freight cars,parsons CHAPTER 7: FINDINGS FROM PUBLIC AND STAKEHOLDER WORKSHOPS ON ALTERNATIVES 167
CALTRAIN EXTENSION TO MONTEREY COUNTY PASSENGER RAIL STATIONSALTERNATIVES ANALYSISand switching of local trains. In addition, UPRR crews are based in Pajaro and the yard is used for asubregional switching yard.A community meeting concerning train service to Pajaro was held on March 31, 2003 at Pajaro MiddleSchool, 250 Salinas Road, Pajaro. There were approximately 60 members of the Pajaro communityin attendance. Translation to Spanish was provided to ensure full participation. Comments weretaken and recorded to be incorporated into the Initial Study. Comments and concerns included remediationof the station site, rail service times, stops and passenger services at the depot, circulation,bike and pedestrian access and safety, security, noise and traffic issues.A public information/presentation of the Draft Environmental Impact Report (EIR) findings and questionand answer session was held at an Action Pajaro Valley meeting on May 10, 2006. Comments/suggestions received included looking at design features that could reduce potential flooding and itsdisruption of service; adding a station/stop in Aromas; designing with drought-resistant landscaping;reusing the old Watsonville Junction sign on the site; and concerns over peak hour traffic on SalinasRoad adjacent to the site. It was noted that Caltrain service would depart in the morning prior to thepeak hour of traffic volumes, and return in the evening following the peak period of afternoon traffic.CASTROVILLE COMMUNITYCastroville is an unincorporated community with a Year 2000 population of 6,700 and a 2005population of 7,099. Currently no station facilities exist in Castroville. The proposed site for theCastroville facility is located immediately north of State Route (SR) 156 at Castroville Boulevard onland currently used for agriculture. The site lies between downtown Castroville and a residentialneighborhood about one-half mile to the east, which also houses North (Monterey) County HighSchool. The Monterey County General Bikeways Plan (2001) includes a pedestrian/bicycle trailthrough the site that connects Salinas Street with Castroville Boulevard along with a grade separatedpedestrian and bicycle crossing. The site is included within the community area boundaries defined inthe Castroville Community Plan and has been identified as a potential location for mixed-use transitorienteddevelopment. The site would be accessed from SR 156, which connects Monterey Baycommunities with U.S. 101 and Salinas Street/Benson Road. The city of Marina is seven miles (nineminutes) southwest of Castroville and is connected to the station site via a four-lane freeway.Marina’s estimated 2005 population is 23,172.A community meeting concerning train service to Castroville was held on January 15, 2003 atGambetta Elementary School in Castroville. There were approximately 70 members of the Castrovillecommunity in attendance. Comments were taken and recorded to be incorporated into the InitialStudy. Comments and concerns included a desire for weekend service, the need for a pedestrianundercrossing, connection of the bike route through the site to the high school, improvements to SR156, building aesthetics and creating a station design that blends in, security, passenger services,parking, noise issues, and energy efficiency. Three goals of the meeting were to integrate the projectwith the Community Plan, minimize traffic impacts and include a pedestrian path to the high school.A follow-up public information/presentation of the Draft EIR findings and question and answer sessionwas held at a Castroville Community Plan Advisory Committee meeting held on May 24, 2006. Nocomments on the Draft EIR or proposed project were received from the public other than support forthe overall service and proposed station facilities.parsons CHAPTER 7: FINDINGS FROM PUBLIC AND STAKEHOLDER WORKSHOPS ON ALTERNATIVES 168
CALTRAIN EXTENSION TO MONTEREY COUNTY PASSENGER RAIL STATIONSALTERNATIVES ANALYSISSALINAS PROPERTY OWNERS MEETINGSalinas is the county seat of Monterey County with a Year 2000 population of 143,920. TheAssociation of Monterey Bay Area Governments estimates its 2005 population at 146,687. Althoughagriculture is the economic base of Salinas, the city is also home to more than 100 manufacturingfirms and several government offices.The proposed Salinas Intermodal <strong>Transportation</strong> Center (ITC) expansion would take place on the siteof the current Amtrak station. The city of Salinas has been making improvements on this propertysince 1999. The current Amtrak station building was constructed in 1942. A new parking area andbus berths were constructed in 2000. A historical train exhibit that will serve as a focal point for thestation area is also being constructed at this site.A 2003 U.S. <strong>Transportation</strong> Authorization bill appropriated $1.2 million for additional improvements tothe station building to address access requirements by the Americans with Disabilities Act and othermiscellaneous deficiencies.The existing Amtrak station includes the equivalent of a Type 150B station building with adjacentadministrative space currently used for UPRR operations; a 10-bus-berth/circulation and passengerdrop-off/pickup roadway; 155 parking spaces available for overnight and commuter passenger use;two rail-side boarding platforms; pedestrian-scale and security lighting; and landscaping.A meeting concerning train service to Salinas was held on March 31, 2003, with owners of propertiesin the Salinas area. The meeting was held at Chapala’s Restaurant, 438 Salinas Street, Salinas.Approximately 40 property owners attended the meeting. Comments were taken and recorded to beincorporated into the Initial Study. Comments and concerns included a time schedule for taking ofproperty, viability of state and federal funding for the project, transportation management issues, trucktraffic on Market Street, the effect of closing business on nearby businesses, parking calculations andthe movement and layover of trains.SALINAS COMMUNITY MEETINGA meeting concerning Caltrain service to Monterey County was held on April 2, 2003 at the SteinbeckCenter in Salinas. There were approximately 30 members of the Salinas community in attendance.Comments were taken and recorded to be incorporated into the Initial Study. Comments and concernsincluded the cost of fares for train service, delays due to shared track utilization, whether to imposeparking fees to park in the parking structure/lots, security concerns, more frequent weekday andweekend service, passenger services in the stations, design and aesthetics of station buildings, developmentof local commercial businesses surrounding the station site, traffic circulation, pedestrianaccess, and access into the Oldtown area.In addition to the single meeting with Salinas property owners in March 2003, a series of meetingswere held with affected property owners from August 2004 through September 2005. Input receivedfrom these meetings influenced the layout of the ITC expansion and layover facilities, as ultimatelyreflected in Salinas ITC Expansion Design Options 17A, 17B, 18A and 18B.MONTEREY PENINSULA COMMUNITIESThe Monterey Peninsula Communities of Marina, Seaside, Sand City and Monterey lie to the southwestof Castroville along the Pacific Ocean, adjacent to the Monterey branch line railroad right-ofway.The Monterey branch line right-of-way has been purchased over time by the <strong>Transportation</strong>parsons CHAPTER 7: FINDINGS FROM PUBLIC AND STAKEHOLDER WORKSHOPS ON ALTERNATIVES 169
CALTRAIN EXTENSION TO MONTEREY COUNTY PASSENGER RAIL STATIONSALTERNATIVES ANALYSISAgency for Monterey County (TAMC), from Castroville to Seaside; and by Seaside and Montereythrough their communities.As part of the Monterey County Fixed Guideway Study, public meetings were held in Marina, Seasideand Monterey to explore fixed guideway transit reuse of this right-of-way.A summary of public opinions expressed during the aforementioned public meetings is summarizedby topic below.Service• Express, high-speed service with limited stops on the Monterey branch line is unacceptable.• Frequent service with frequent stations and all day service is desirable.• Opportunities for adding intercity passenger rail service to San Francisco should bepreserved.• Funding availability will likely necessitate phased implementation.• MST bus service should integrate with light rail transit/bus rapid transit service, withoutduplication.Alignment• Monterey branch line service should extend between Washington Street in Monterey andArmstrong Ranch in Marina at a minimum.• Intergarrison Road should be preserved as a future transit corridor, eventually linking Marinawith Salinas, possibly via Davis Road.Equipment• Large, locomotive hauled passenger trains are unacceptable to Monterey branch line communityleaders and residents.• Electric propulsion is not required. Overhead electric lines are considered to be unsightly.• Diesel light rail transit and bus rapid transit vehicles are acceptable to community leaders andresidents if air quality and noise impacts are generally equal to electric propulsion.Stations• An intercity passenger rail station north of Marina at Highway 1 and Lapis Road should bedropped from further consideration. This site is too distant from existing or futuredevelopment.• All other proposed stations should be retained for continued project development investigations.Platform or stop locations may shift in the future to reflect community input.• Pedestrian and bicycle access to stations should be emphasized, with park-and-ride limited toselect locations.parsons CHAPTER 7: FINDINGS FROM PUBLIC AND STAKEHOLDER WORKSHOPS ON ALTERNATIVES 170
CALTRAIN EXTENSION TO MONTEREY COUNTY PASSENGER RAIL STATIONSALTERNATIVES ANALYSISOTHER PUBLIC INFORMATION MECHANISMSDesign concepts, status, issues and public input were regularly presented to policy boards and advisorycommittees and as public outreach to interested parties within the community. These public forumpresentations included:• May 10, 1999 – Caltrain <strong>Extension</strong> Task Force Meeting with VTA, City of Salinas, San BenitoCounty, Caltrain JPB, City of Watsonville, Santa Cruz County Regional <strong>Transportation</strong>Commission (SCCCRTC), MST, AMBAG, Caltrans District 5, and TAMC to discuss goals andcurrent plans.• August 26, 1999 – Caltrain <strong>Extension</strong> Task Force Meeting to discuss preparation of businessplan, equipment capacity, Salinas layover facility.• August 15, 2000 – Meeting with JPB and VTA staff to discuss <strong>Extension</strong> of Caltrain <strong>Commuter</strong>Service to Monterey County Business Plan.• October 6, 2000 – Meeting with City of Salinas Council Facilities Committee, RedevelopmentAgency and staff to discuss Caltrain <strong>Extension</strong> implementation and action plan.• February 25, April 23, and June 25, 2001 – Meetings with Monterey County, City of Watsonville,Santa Cruz Metropolitan Transit District, Monterey–Salinas Transit, and Caltrans staffrepresentatives to discuss Pajaro Valley Station project development.• March 29, 2001 – VTA/TAMC coordination meeting regarding Salinas layover facility, funding,unknown UPRR capacity improvements, TAMC funding, initial train service schedules.• May 24, 2001 – Meeting with JPB staff to discuss Caltrain <strong>Extension</strong> project.• May 30, 2001 – Caltrain <strong>Extension</strong> project discussed with three members of the Santa ClaraCounty Board of Supervisors who sit on the VTA Board.• June 7, 2001 – Formal presentation of Caltrain <strong>Extension</strong> project to JPB Board (publicmeeting).• June 11, 2001 – Presentation on TCRP funding application to <strong>Rail</strong> Policy Committee (publicmeeting).• November 1, 2001 – TAMC presentation to PCJPB Board regarding Caltrain extension toSalinas.• April 4, June 6, and October 22, 2002 – Caltrain <strong>Extension</strong> project and proposed stationsdesign discussed with UPRR staff.• May 8, 2002 – Meeting with JPB staff to discuss Caltrain <strong>Extension</strong> project and MontereyIntercity Passenger <strong>Rail</strong> project.• May 16, 2002 – Meeting with Caltrans environmental staff to scope Caltrain <strong>Extension</strong> NEPAenvironmental document.• June 10, 2002 – Presentation on qualifying Caltrain <strong>Extension</strong> to Monterey County for federalfunding and additional public outreach to <strong>Rail</strong> Policy Committee (public meeting).• January 22 and 30, 2003 – Caltrain <strong>Extension</strong> project discussed with UPRR staff.• May 5, 2003 – <strong>Rail</strong> Policy Committee tours Salinas project site (public meeting).• June 9, 2003 – Presentation on Salinas Station and Pajaro Station to MST Board (open topublic).• June 25, 2003 – Presentation to the TAMC Board (public meeting).parsons CHAPTER 7: FINDINGS FROM PUBLIC AND STAKEHOLDER WORKSHOPS ON ALTERNATIVES 171
CALTRAIN EXTENSION TO MONTEREY COUNTY PASSENGER RAIL STATIONSALTERNATIVES ANALYSIS• June 26, 2003 – Caltrain <strong>Extension</strong> project discussed with UPRR staff.• August 28, 2003 – Caltrain <strong>Extension</strong> project discussed with Federal Transit Administration(FTA) staff.• September 2, 2003 – Notice of Preparation for the Caltrain <strong>Extension</strong> to Monterey CountyProject Draft Environmental Impact Report.• September 15, 2003 – Caltrain <strong>Extension</strong> project presented to MST Board and Facilities Subcommittee(public meeting).• December 9, 2003 – Presentation on Pajaro station and Caltrain <strong>Extension</strong> to Watsonville CityCouncil (public meeting).• April 19, 2004 – JPB, VTA and TAMC Caltrain <strong>Extension</strong> to Monterey County coordinationmeeting.• April 26, 2004 – Federal Transit Administration staff tour of project sites.• May 3, 2004 – Presentation on Salinas site to <strong>Rail</strong> Policy Committee (public meeting).• June 23, 2004 – Castroville Community Plan Citizens Advisory Committee on Castrovillestation. Approximately 30 members of public in attendance.• June 30, 2004 – Caltrain <strong>Extension</strong> project discussed with Coastal Commission staff.• August 2004 through December 2005 – Affected property owners in Salinas met individuallywith TAMC (dates and minutes available for review at TAMC office).• October 12, 2004 – Study session with Marina City Council regarding Monterey County FixedGuideway <strong>Alternatives</strong>.• November 4, 2004 – Presentation to Oldtown Salinas Association on Salinas ITC (publicpresentation).• November 8, 2004 – Presentation to MST Facilities Committee on Salinas project site (opento public).• December 13, 2004 – MST Board presentation on Salinas project site (open to public).• January 18, 2005 – Meeting with concerned citizens on the Salinas freight building. Organizedby Salinas Redevelopment Agency. Public meeting – approximately 50 people attended toask questions. The group expressed that they did not want the freight building removed orrelocated.• February 1, 2005 – Salinas project site on agenda for Salinas City Council at a regularlyscheduled City Council meeting (open to the public). Public input was received on the projectand entered into the record. American Supply Company (a business within the project area)opposed the project, and City Council members stated their opinions for the record. CityCouncil approved Salinas ITC Expansion Configurations 17 and 18 for environmental review.• February 18, 2005 – Meeting with Coastal Commission staff to discuss footprint of CastrovilleStation parking supply.• March 3, 2005 – Presentation to Seaside City Council of Monterey County Fixed Guideway<strong>Alternatives</strong> (open to public).• March 15, 2005 – Presentation to Monterey City Council of Monterey County Fixed Guideway<strong>Alternatives</strong> (open to public).• March 23, 2005 – Presentation to TAMC Board on Salinas ITC Expansion Options 17 and 18(open to public).parsons CHAPTER 7: FINDINGS FROM PUBLIC AND STAKEHOLDER WORKSHOPS ON ALTERNATIVES 172
CALTRAIN EXTENSION TO MONTEREY COUNTY PASSENGER RAIL STATIONSALTERNATIVES ANALYSIS• April 5, 2005 – Televised interview regarding fixed guideway investment options onKNRY/AMP.• April 5, 2005 – Presentation to Sand City Council of Monterey County Fixed Guideway<strong>Alternatives</strong> (open to public).• April 5, 2005 – Presented options for rail service to Monterey County and announced Aprilpublic meetings on KNRY and Access Monterey Peninsula (AMP).• April 6, 2005 – Public informational meeting/open house regarding Monterey CountyGuideway <strong>Alternatives</strong> at Seaside Community Center, 7 PM to 9 PM.• April 27, 2005 – Public informational meeting/open house regarding Monterey CountyGuideway <strong>Alternatives</strong> at Monterey Conference Center, 7 PM to 9 PM.• June 10, 2005 – Presented rail projects and 14-year plan on KNRY and AMP.• July 11, 2005 – <strong>Rail</strong> Policy Committee deliberations regarding the shortlisting of MontereyCounty Fixed Guideway <strong>Alternatives</strong> (open to public).• July 26, 2005 – Presentation to LandWatch Monterey County on the Castroville rail station inthe context of the Community Plan.• August 3, 2005 – Teleconference with FTA staff regarding project status.• August 8, 2005 – Presentation to <strong>Rail</strong> Policy Committee on Monterey County Fixed Guidewaymode technology and deployment options. Continued deliberation on shortlisting ofalternatives (open to public).• September 12, 2005 – Presentation of bus rapid transit technologies, FTA <strong>Alternatives</strong><strong>Analysis</strong> process, and <strong>Rail</strong> Policy Committee selection of four shortlisted alternatives forHighway 101 Corridor and Monterey Peninsula Fixed Guideway/express bus transit service(open to the public).• October 10, 2005 – Presentation to MST Board regarding transit-oriented developmentopportunities at Fort Ord/University Villages site.• November 2, 2005 – Teleconference with FTA staff regarding project status, need for MST onboardrider survey.• November 7, 2005 – Discussed the benefits of Amtrak Thruway bus service to MontereyCounty and TAMC rail projects at the Amtrak Thruway bus ribbon-cutting ceremony.• December 8, 2005 – Discussed TAMC’s 14-year plan, rail program and transit-orienteddevelopment program with the Monterey Bay chapter of the Association of EnvironmentalProfessionals.• January 9, 2006 – <strong>Rail</strong> Policy Committee discussion of Caltrain <strong>Extension</strong> demonstrationservice to accelerate implementation (open to public).• February 6, 2006 – Coordination meeting with Caltrans Division of <strong>Rail</strong>, Amtrak, UPRR andTAMC to discuss Coast Line capacity improvements and Caltrain extension.• February 6, 2006 – <strong>Rail</strong> Policy Committee continued discussion of Caltrain <strong>Extension</strong> demonstrationservice (open to public).• February 14, 2006 – Discussed Transit-Oriented Development/Transit Villages/”SmartGrowth,” <strong>Rail</strong> projects and the 14-year plan on KNRY and AMP.parsons CHAPTER 7: FINDINGS FROM PUBLIC AND STAKEHOLDER WORKSHOPS ON ALTERNATIVES 173
CALTRAIN EXTENSION TO MONTEREY COUNTY PASSENGER RAIL STATIONSALTERNATIVES ANALYSIS• April 3, 2006 – Presentation to <strong>Rail</strong> Policy Committee of Caltrain <strong>Extension</strong> Draft EnvironmentalImpact Report. <strong>Rail</strong> Policy Committee approves Draft Environmental Impact Report forpublic review (open to public).• April 7, 2006 – Federal Transit Administration staff tour of project sites.• April 26, 2006 – Caltrain <strong>Extension</strong> to Monterey County Passenger <strong>Rail</strong> Stations DraftEnvironmental Impact Report circulation for public review.• May 9, 2006 – Discussed Caltrain project and transit-oriented development on KNRY andAMP.• May 10, 2006 – Informational presentation of Caltrain <strong>Extension</strong> Draft Environmental ImpactReport to Action Pajaro public meeting.• May 16, 2006 – Caltrain <strong>Extension</strong> Draft Environmental Impact Report informational briefingon agenda for Salinas City Council regularly scheduled City Council meeting (open to thepublic). Public input was received on the project. American Supply Company opposed thetaking of their lands for the project, but supported the Caltrain <strong>Extension</strong> to MontereyCounty/Salinas. Council persons asked questions regarding ITC Expansion integration withthe First Mayor’s (Harvey-Baker) House.• May 24, 2006 – Caltrain <strong>Extension</strong> Draft Environmental Impact Report Public Hearing onTAMC regularly scheduled Board Meeting. No public comment was made at the meeting.• May 24, 2006 – Informational presentation of Caltrain <strong>Extension</strong> Draft Environmental ImpactReport to Castroville Development Citizens Advisory Subcommittee (public meeting).• May 30, 2006 – Federal Transit Administration staff tour of project sites.• June 5, 2006 – Presentation to <strong>Rail</strong> Policy Committee of Caltrain <strong>Extension</strong> <strong>Alternatives</strong><strong>Analysis</strong> study findings (open to the public).• June 7, 2006 – VTA/TAMC coordination meeting regarding Draft Environmental Impact Reportand summary of business plan assumptions.• July 12, 2006 – Meeting with JPB and VTA staff to review project status and summary ofbusiness plan assumptions.• August 23, 2006 – TAMC Board of Directors public hearing and certification of the FinalEnvironmental Impact Report.• August 29, 2006 – Discussed Caltrain project Final Environmental Impact Report on KNRYand AMP.• September 22, 2006 – Distribution of Draft Caltrain <strong>Extension</strong> to Monterey County <strong>Alternatives</strong><strong>Analysis</strong> study report to public agencies and TAMC <strong>Rail</strong> Policy Committee.• October 2, 2006 – TAMC <strong>Rail</strong> Policy Committee discussion of Draft Caltrain <strong>Extension</strong> toMonterey County <strong>Alternatives</strong> <strong>Analysis</strong> and endorsement of the Build Alternative as theLocally Preferred Alternative (open to the public).• October 2, 2006 – Distribution of the <strong>Alternatives</strong> <strong>Analysis</strong> report to the public via TAMC’s website.• January 31, 2007 – TAMC Board adoption of the Caltrain <strong>Extension</strong> to Monterey County asthe Locally Preferred Alternative (open to the public).parsons CHAPTER 7: FINDINGS FROM PUBLIC AND STAKEHOLDER WORKSHOPS ON ALTERNATIVES 174
CALTRAIN EXTENSION TO MONTEREY COUNTY PASSENGER RAIL STATIONSALTERNATIVES ANALYSISCONSULTATIONSA series of monthly Project Development Team meetings were held between March 2002 andJune 2006. Meetings were held at either the offices of the Monterey County Redevelopment Agencyor TAMC. Discussion topics included review of scope of work and schedules, design of project andproject components, integration with existing data (traffic, noise, ridership expectancy, etc.), negotiationswith other agencies and parties, parking options, status reports and funding requirements andupdates. Project Development Team members included staff from the following agencies:<strong>Transportation</strong> Agency for Monterey CountyState of California Department of <strong>Transportation</strong>Monterey–Salinas TransitSanta Clara Valley <strong>Transportation</strong> AuthorityPeninsula Corridor Joint Powers BoardUnion Pacific <strong>Rail</strong>roadCity of SalinasSalinas Redevelopment AgencyCounty of MontereyParsons <strong>Transportation</strong> GroupSUMMARY OF PUBLIC AND STAKEHOLDER INPUT• All Highway 101 Corridor communities (Pajaro/Watsonville, Castroville, Salinas) support theCaltrain <strong>Extension</strong> Alternative.• One affected property owner in Salinas, American Supply, supports the project, but opposesthe acquisition of its property.• Monterey Peninsula communities support the Caltrain <strong>Extension</strong> Alternative as well as localservice along the Monterey Peninsula, connecting to Caltrain service at Castroville.• Public agencies internal to Monterey County support the Caltrain <strong>Extension</strong> Alternative. Theseinclude TAMC, Monterey–Salinas Transit, the Monterey County Resource ManagementAgency, and the City of Salinas.• Public agencies external to Monterey County support the Caltrain <strong>Extension</strong> Alternative.These include the State of California Department of <strong>Transportation</strong>, the Association ofMonterey Bay Area Governments, the Santa Cruz County Regional <strong>Transportation</strong>Commission, the San Francisco Bay Area Metropolitan <strong>Transportation</strong> Commission, the SantaClara Valley <strong>Transportation</strong> Authority, the Peninsula Corridor Joint Powers Board, and the Cityof San Jose.• The Union Pacific <strong>Rail</strong>road has developed a draft term sheet for extending Caltrain service toSalinas and has approved the conceptual design plans for Monterey County station facilities.• The California Coastal Commission staff supports the Caltrain <strong>Extension</strong> Alternative andseeks to reduce the size of the parking footprint at the Castroville Station.• No public opposition to the Caltrain <strong>Extension</strong> Alternative has arisen in four years of projectdevelopment informational meetings or circulation of the CEQA Draft Environmental ImpactReport.parsons CHAPTER 7: FINDINGS FROM PUBLIC AND STAKEHOLDER WORKSHOPS ON ALTERNATIVES 175
CALTRAIN EXTENSION TO MONTEREY COUNTY PASSENGER RAIL STATIONSALTERNATIVES ANALYSISThis page intentionally left blank.parsons CHAPTER 7: FINDINGS FROM PUBLIC AND STAKEHOLDER WORKSHOPS ON ALTERNATIVES 176
CALTRAIN EXTENSION TO MONTEREY COUNTYALTERNATIVES ANALYSISCHAPTER 8: EVALUATION OF ALTERNATIVESThe Caltrain <strong>Extension</strong> Alternative and Express Bus Alternative have been evaluated based on the“Tier Two” evaluation criteria and performance measures identified in Chapter 1 (see Figure 1-4).Performance information reported in this chapter is organized into two sections. The first sectionpresents an economic evaluation of the two alternatives using benefit/cost analysis methodologies.This analysis includes estimates of user benefits including travel time savings, reductions in out-ofpockettravel expenses, and reduced accident costs. Estimates of revenue transfers (reduced publictax revenue collections) are included in the analysis. The economic analysis also measures externalcosts such as the health cost of motor vehicle emissions and accident costs which are not perceivedby users.The second portion of this chapter measures social performance criteria. These include costeffectiveness, equity, land use, environmental and public acceptance issues.ECONOMIC PERFORMANCE OF THE CALTRAIN EXTENSION ANDEXPRESS BUS ALTERNATIVESThe economic performance evaluation of the alternatives is patterned on traditional benefit/costanalysis techniques. The California Life-Cycle Benefit/Cost <strong>Analysis</strong> Model (Cal-B/C) and the Surface<strong>Transportation</strong> Efficiency <strong>Analysis</strong> Module (STEAM 2.0) provide the framework for the economicanalysis of alternatives which is described below.Travel Time SavingsAutomobile Travel TimeAs reported in Table 2-5, travel time between a representative origin–destination pair (Morgan Hill toSanta Clara) improved by approximately 20 minutes between 2000 and 2005. This decrease in traveltime resulted from capacity improvements to U.S. 101 between Morgan Hill and San Jose, and areduction in travel demand caused by lower employment in the technology sector. In the future,highway travel times are forecast to increase, returning to and exceeding those experienced in thedotcom boom of 2000/2001.Table 8-1 indicates existing (2005) measured travel times and estimated, future year travel times.These times exclude “terminal” access/egress times, assumed to be 10 minutes for each one-wayjourney to work or home.Table 8-1Existing and Estimated Travel TimesTravel Time (min)City Pair Highway Distance (mi) 2005 2010 2030Salinas–Gilroy 27.6 30 30 41Castroville–Gilroy 24.1 27 27 36Pajaro–Gilroy 15.0 23 25 28Gilroy–Morgan Hill 9.0 9 9 13Morgan Hill–San Jose 23.5 30 35 40San Jose–Santa Clara 7.1 24 29 33Santa Clara–Mountain View 8.2 15 18 34Source: Valley <strong>Transportation</strong> Authority, Caltrans, Parsonsparsons CHAPTER 8: EVALUATION OF ALTERNATIVES 177
CALTRAIN EXTENSION TO MONTEREY COUNTYALTERNATIVES ANALYSISTransit Travel TimeTransit travel time includes time while on board the commuter rail train or express bus, timeexpended to access the origin station, wait for the transit vehicle to arrive or depart, and timeexpended to reach the journey’s final destination. Table 8-2 indicates the various station mode ofarrival/egress assumptions; weighted access/egress travel times; weighted transfer times; and onboard transit vehicle travel times for the line haul portion of the trip (e.g., Salinas Intermodal<strong>Transportation</strong> Center (ITC) to Mountain View Caltrain station). Travel times by express bus andcommuter rail are assumed to be comparable for year 2010 operations.Time expended outside a transit vehicle for walking or bicycle access to or from a station, and timeexpended outside waiting for a transit vehicle to arrive is weighted by a factor of 2.0 to account for theinconvenience of these delays.Table 8-2Station Mode of Arrival/Egress AssumptionsOrigin StationParameter Pajaro Castroville SalinasMonterey County station mode of arrival (percent)Auto 86% 73% 60%Other 14% 27% 40%Weighted access time (minutes) 11.4 12.7 14.0Weighted transfer time (minutes)AM—6 13 13 13PM–20Santa Clara County station mode of egress (percent)Walk/bicycle 50% 50% 50%Bus/auto 50% 50% 50%Weighted egress time (minutes) 15 15 15On board train (2010 and 2030)San Jose Diridon 81 95 105Mountain View 107 121 131On board express bus (2010)San Jose Diridon 81 95 105Mountain View 107 121 131On board express bus (2030)San Jose Diridon 93 111 123Mountain View 121 139 151Source: ParsonsTotal Travel Time (Minutes)Total travel times by automobile, commuter rail, and express bus modes are reported in Table 8-3 forthe 2010 and 2030 planning horizons. All times include in- and out-of-vehicle terminal times andtransfer wait times. For the transit modes, out-of-vehicle times are weighted by a factor of 2.0 toreflect user inconvenience.Travel Time SavingsWhile commuting by automobile, it is difficult to productively utilize the travel time expended duringthe journey. Cellular telephone conversations, listening to books on tape and putting on cosmeticsare marginally productive uses of time which may, however, lead to higher incidents of auto crashes.parsons CHAPTER 8: EVALUATION OF ALTERNATIVES 178
CALTRAIN EXTENSION TO MONTEREY COUNTYALTERNATIVES ANALYSISTable 8-3Total Travel Times (minutes) for Auto/Caltrain/Express Bus JourneysOrigin StationDestination Station Pajaro Castroville Salinas2010San Jose (Santa Clara–Mid) 79/120/120 81/136/136 84/147/147Mountain View (Santa Clara–North) 126/146/146 128/162/162 131/173/1732030San Jose (Santa Clara–Mid) 91/120/132 99/136/152 104/147/165Mountain View (Santa Clara–North) 158/146/160 166/162/180 171/173/193Automobile travel times (includes 10 minutes of terminal time)Caltrain travel times (includes out-of-vehicle time weighted × 2.0)Express bus travel times (includes out-of-vehicle time weighted × 2.0)Source: ParsonsBy comparison, traveling by Caltrain or express bus will free the commuter to read, work, write and/orrelax. This recovered time can be viewed to be a travel time “savings.”For the purpose of this benefit calculation, travel time savings, i.e., time which can be put toproductive use, is computed to be time on-board the line haul transit vehicle (Caltrain or express bus),minus the time difference of the overall journey by transit versus automobile (Method 1).Figure 8-1 illustrates this travel time savings concept. Table 8-4 reports the findings of this analysis.An alternative and more conservative approach to calculating travel time savings (Method 2) is tobase the savings on the total travel time difference between the highway and transit for the Caltrain<strong>Extension</strong> project scenario. The Cal-B/C 1 utilizes this approach.“ If the difference in travel time is negative (i.e., the travel time is smaller on the parallel highwaythan on transit), the benefit is assumed to be zero. The new transit riders must have shiftedmodels for reasons other than travel time savings. Assuming that these new riders are rationalin their decision making, the sum of these benefits must be positive. Since Cal-B/C is unlikelyto capture all of the benefits (e.g., the value of reducing one’s stress by not having to drive, theimproved reliability of transit, etc.), the model conservatively estimates that the new transitriders do not receive a benefit.”A third approach (Method 3) is to recognize some useful benefit to the on-board line haul portion ofthe transit trip. This method weighs the in-vehicle travel time by a factor, typically 75 percent, andthen calculates the total travel time difference. Table 8-5 reports the findings of this analysis.Value of TimeConsistent with U.S. Department of <strong>Transportation</strong> guidance for the valuation of travel time ineconomic analysis, local personal travel was assumed to be valued at 50 percent of the local medianwage rate. Monterey County’s mean wage for all occupations was reported by the CaliforniaEmployment Development Department to be $18.01 per hour for the third quarter of 2005, or $37,458when expressed as an annual wage or salary. Using this wage rate as a basis, the value of timewould equal $9.00 per hour.Most people who commute to Silicon Valley (Santa Clara County) do so to earn a higher wage,however. Why else would a worker commute 60 to 100 miles from home to work to earn the samewage found locally.1Technical Supplement to User’s Guide, Booz • Allen & Hamilton, Inc., September 1999.parsons CHAPTER 8: EVALUATION OF ALTERNATIVES 179
CALTRAIN EXTENSION TO MONTEREY COUNTYALTERNATIVES ANALYSISFigure 8-1Travel Time Utilization—Method 1MinutesElapsed Time 0 30 60 90 120 150 180 210Auto TripBeginChangemodeEndTransit TripBegin Change Line haul EndmodeEgressAccess stationUnproductive timeProductive timeTable 8-4Travel Time Savings (minutes per one-way trip)—Method 1Origin StationDestination TimePajaro Castroville SalinasStation Component Caltrain Express Bus Caltrain Express Bus Caltrain Express Bus2010San JoseSanta Clara–MidMountain ViewSanta Clara–NorthOn-board 81 81 95 95 105 105Δ time (41) (41) (55) (55) (63) (63)Net 40 40 40 40 42 42On-board 107 107 121 121 131 131Δ time (20) (20) (34) (34) (42) (42)Net 87 87 87 87 89 892030San JoseSanta Clara–MidMountain ViewSanta Clara–NorthOn-board 81 93 95 111 105 123Δ time (29) (41) (37) (53) (43) (61)Net 52 52 58 58 62 62On-board 107 121 121 139 131 151Δ time 12 (2) 4 (14) (2) (22)Net 119 119 125 125 129 129According to a report published by the American Electronics Association, California Cybercities 2006,San Jose/Silicon Valley is home to 214,900 high-tech jobs as of the end of 2004, which pay $126,729per year on average. (The average wage for all private sector workers in San Jose/Silicon Valley was$72,225.)Table 8-6 reports selected wage rates for comparison.parsons CHAPTER 8: EVALUATION OF ALTERNATIVES 180
CALTRAIN EXTENSION TO MONTEREY COUNTYALTERNATIVES ANALYSISTable 8-5Travel Time Savings (minutes per one-way trip)—Method 3Origin StationPajaro Castroville SalinasDestination Station Caltrain Express Bus Caltrain Express Bus Caltrain Express Bus2010San Jose (Santa Clara–Mid) 0 0 0 0 0 0Mountain View (Santa Clara–North) 7 7 0 0 0 02030San Jose (Santa Clara–Mid) 0 0 0 0 0 0Mountain View (Santa Clara–North) 39 28 34 21 31 16Source: ParsonsTable 8-6Selected Wage Rates (2004 unless noted)Job Location and Type Average Annual Wage Hourly WageSanta Clara County—High Tech $126,729 $60.93Santa Clara County—All Private $ 72,225 $34.72Monterey County—All Industries (Q3 2005) $ 37,459 $18.01Statewide—High Tech $ 90,554 $43.54Statewide—All Private $ 44,045 $21.18Source: American Electronics Association, California Development DepartmentBased on the ridership assessment of likely origin–destination patterns, the average wage rate of allSilicon Valley workers is assumed as the basis for commuting value of time. At $34.72 per hour,50 percent of this amount equals $17.36.Value of Travel Time SavingsThe number of annual passengers forecast for the Caltrain <strong>Extension</strong> and Express Bus alternatives isreported in Table 8-7.Table 8-7Annual Passengers—Caltrain <strong>Extension</strong> to SalinasAnnual PassengersEgress/Access Pajaro Castroville Salinas Total2010Santa Clara–Mid 48,960 10,200 89,250 148,410Santa Clara–North 106,590 22,440 193,290 322,320San Mateo 12,240 2,550 21,930 36,720San Francisco 5,610 1,020 10,200 16,830173,400 36,210 314,670 524,2802030Santa Clara–Mid 85,170 25,500 173,400 284,070Santa Clara–North 184,620 55,590 374,850 615,060San Mateo 20,910 6,120 42,840 69,870San Francisco 9,690 3,060 19,380 32,130300,390 90,270 610,470 1,001,130Source: Parsonsparsons CHAPTER 8: EVALUATION OF ALTERNATIVES 181
CALTRAIN EXTENSION TO MONTEREY COUNTYALTERNATIVES ANALYSISCombining these ridership levels with the value of in-vehicle transit travel time ($17.36/hour) and theminutes of travel time “savings” yields the following computations of user benefits.Table 8-8User Time Benefits—Method 1Egress/Access Pajaro Castroville Salinas Total2010Santa Clara–Mid $ 566,630 $118,048 $1,084,566 $ 1,769,244Santa Clara–North 2,683,083 564,860 4,977,346 8,225,289San Mateo* 308,105 64,189 564,712 937,006San Francisco* 141,215 25,675 262,657 429,527$3,699,033 $772,772 $6,889,281 $11,361,0862030Santa Clara–Mid $1,281,411 $ 427,924 $ 3,110,565 $ 4,819,900Santa Clara–North 6,356,590 2,010,565 13,990,901 22,357,996San Mateo* 719,945 221,340 1,598,960 2,540,245San Francisco* 333,633 110,670 723,339 1,167,642$8,691,579 $2,770,439 $19,423,765 $30,885,783Source: Parsons*Travel time savings/rider assumed to be equal to Santa Clara–North.Table 8-9User Time Benefits—Method 3Egress/Access2010CaltrainPajaro Castroville Salinas TotalExpressBusCaltrainExpressBusCaltrainExpressBusCaltrainExpressBusSanta Clara–Mid — — — — — — — —Santa Clara–North $ 215,880 $ 215,880 — — — — — —San Mateo* $ 24,790 $ 24,790 — — — — — —San Francisco* $ 11,362 $ 11,362 — — — — — —$ 252,032 $ 252,082 — — — — $ 252,032 $ 252,0822030Santa Clara–Mid — — — — — — — —Santa Clara–North 2,083,252 1,495,668 546,857 337,765 3,362,154 1,735,305 5,992,263 3,568,738San Mateo* 235,948 169,399 60,204 37,185 384,246 198,321 680,398 404,905San Francisco* 109,342 78,502 30,102 18,593 173,826 89,716 313,270 186,811$2,428,542 $1,743,569 $637,163 $393,543 $3,920,226 $2,023,342 $6,985,931 $4,160,454*Travel time savings/rider assumed to be equal to Santa Clara–North.parsons CHAPTER 8: EVALUATION OF ALTERNATIVES 182
CALTRAIN EXTENSION TO MONTEREY COUNTYALTERNATIVES ANALYSISVehicle Operating CostsVehicle operating costs were calculated for the No Build and Caltrain <strong>Extension</strong>/Express Busalternatives using estimates of vehicle miles traveled (VMT) reported in Table 8-10.In lieu of calculating fuel consumption per gallon based on average link speeds and vehicle milestraveled per link, an average rate of vehicle fuel economy was used based on EnvironmentalProtection Agency (EPA) laboratory data adjusted downward by about 15 percent to better representreal-world driving conditions. In its annual report released on July 17, 2006, the EPA said the industry-widefuel economy of 2006 model-year vehicles was 21 miles per gallon, the same as a yearago. 10The resulting average fuel consumption of 0.0476 gallons/mile corresponds reasonably well with theestimates of average fuel consumption for the Year 2000 obtained from the California Air ResourcesBoard’s Motor Vehicle Emission Inventory models. These rates, used in the California Life-CycleBenefit/Cost <strong>Analysis</strong> Model, are reported in Table 8-11.The price-per-gallon of regular grade gasoline was assumed to be $2.995 per gallon, based on pricesprevailing in Salinas, California in March 2007. 11 This cost was separated into tax and non-taxcomponents, using the tax portion to compute “revenue transfers.” The tax rate per gallon of gasolinewas assumed to be 18.4 cents federal, 18.0 cents state excise, 18.1 cents state sales, 3.8 centscounty sales, and 1.2 cents per gallon UST fee. These taxes total 59.5 cents per gallon.Non-fuel costs for vehicle maintenance and tire expense were assumed to be $0.061 per mile forautomobiles based on Center for <strong>Transportation</strong> <strong>Analysis</strong>, Department of Energy statistics for calendaryear 2004. This cost does not include mileage-based depreciation.The resulting vehicle operating cost benefits of the Caltrain <strong>Extension</strong> and Express Bus alternativeimprovements, computed for Year 2030 passenger volumes, are estimated to be $12 million annuallyas shown in Table 8-12. Revenue transfers and fuel taxes not collected as a result of these benefitsamount to $1.7 million annually in 2030.Transit User FeesThe transit user vehicle operating cost savings reported above must be offset by the fares users payto ride the proposed transit service. Table 6-13 lists the anticipated fare revenues for different levelsof ridership. For the 2010 and 2030 planning horizons, the anticipated revenue from passenger fares(user fees) are as follows, based on the Caltrain fare structure in place as of January 1, 2006.• Year 2010 annual passenger revenue = $3,310,612• Year 2030 annual passenger revenue = $6,320,79010Washingtonpost.com, “Gas Prices Are Up but Not Fuel Economy,” July 18, 2006.11www.fuelgaugereport.com for March 7, 2007.parsons CHAPTER 8: EVALUATION OF ALTERNATIVES 183
CALTRAIN EXTENSION TO MONTEREY COUNTYALTERNATIVES ANALYSISTable 8-102010 and 2030 Annual Passengers, Passenger Miles, and Vehicle Equivalents—Caltrain <strong>Extension</strong> to Salinas2010Egress/Access Pajaro Castroville Salinas TotalAnnual PassengersSanta Clara–Mid 48,960 10,200 89,250 148,410Santa Clara–North 106,590 22,440 193,290 322,320San Mateo 12,240 2,550 21,930 36,720San Francisco 5,610 1,020 10,200 16,830173,400 36,210 314,670 524,280Annual Vehicle Equivalents*Santa Clara–Mid 44,509 9,273 81,136 134,918Santa Clara–North 96,900 20,400 175,718 293,018San Mateo 11,127 2,318 19,936 33,381San Francisco 5,100 927 9,273 15,300157,636 32,918 286,063 476,617Vehicle Mile EquivalentsSanta Clara–Mid 44.7 53.8 57.4Santa Clara–North 60.4 69.5 73.1San Mateo 74.6 83.7 87.3San Francisco 92.2 101.3 104.92030Egress/Access Pajaro Castroville Salinas TotalAnnual PassengersSanta Clara–Mid 85,170 25,500 173,400 284,070Santa Clara–North 184,620 55,590 374,850 615,060San Mateo 20,910 6,120 42,840 69,870San Francisco 9,690 3,060 19,380 32,130300,390 90,270 610,470 1,001,130Annual Vehicle Equivalents*Santa Clara–Mid 77,427 23,182 157,636 258,245Santa Clara–North 167,836 50,536 340,773 559,145San Mateo 19,009 5,564 38,945 63,518San Francisco 8,809 2,782 117,618 29,209273,081 82,064 554,972 910,117Vehicle Mile EquivalentsSanta Clara–Mid 44.7 53.8 57.4Santa Clara–North 60.4 69.5 73.1San Mateo 74.6 83.7 87.3San Francisco 92.2 101.3 104.9Annual Vehicle Mile Equivalents**Santa Clara–Mid 1,989,552 498,887 4,657,206 7,145,645Santa Clara–North 5,852,760 1,417,800 12,844,985 20,115,545San Mateo 830,074 194,017 1,740,413 2,764,504San Francisco 470,220 93,905 972,738 1,536,8639,142,606 2,204,609 20,215,342 31,562,557*Assumes average auto occupancy of 1.10 for peak hour commuters.**Reflects highway travel distancesAnnual Vehicle Mile Equivalents**Santa Clara–Mid 3,460,987 1,247,192 9,048,306 13,756,485Santa Clara–North 10,137,294 3,512,252 24,910,506 38,560,052San Mateo 1,418,071 465,707 3,399,899 5,283,677San Francisco 812,190 281,817 1,848,128 2,942,13515,828,542 5,506,968 39,206,839 60,542,349*Assumes average auto occupancy of 1.10 for peak hour commuters.**Reflects highway travel distancesparsons CHAPTER 8: EVALUATION OF ALTERNATIVES 184
CALTRAIN EXTENSION TO MONTEREY COUNTYALTERNATIVES ANALYSISTable 8-11Fuel Consumption Rates (gallons/mile)Speed Auto Truck5 0.182 0.31010 0.123 0.18115 0.089 0.13520 0.068 0.11825 0.054 0.12030 0.044 0.13335 0.037 0.15640 0.034 0.18545 0.033 0.22350 0.033 0.26455 0.034 0.31660 0.037 0.37465 0.043 0.43970 0.052 0.511Source: Cal-B/C, California Air Resources BoardTable 8-12Vehicle Operating Cost SavingsParameter 2010 2030Annual VMT reduction (miles) 31,562,557 60,542,349Annual fuel savings (gallons) 1,502,378 2,881,816Annual motorist cost of fuel savings $4,499,622 $ 8,631,039Annual non-fuel motorist cost savings (excluding mileage-based depreciation) $1,925,316 $ 3,693,083Total vehicle operating cost savings $6,424,938 $12,324,122Revenue transfers ($893,915) ($1,714,681)Crash BenefitsTo compute benefits associated with the Caltrain <strong>Extension</strong> and Express Bus alternatives versus theNo Build Alternative, the number of vehicle miles traveled over the highway system was computed foreach alternative.Rates of crash occurrences resulting in fatalities, personal injuries, and property damage only wereobtained from Caltrans for year 2004. Statewide rates were used in the calculation of benefits. Theserates are listed in Table 8-13.Table 8-13California Crash Rates on State Highways (2004)*Functional Classification PDO Crash Rate Injury Crash Rate Fatal Crash RateAll 100.90 61.96 1.13Source: California Highway Patrol, California Department of <strong>Transportation</strong>*Crash rates per 100 million vehicle miles.parsons CHAPTER 8: EVALUATION OF ALTERNATIVES 185
CALTRAIN EXTENSION TO MONTEREY COUNTYALTERNATIVES ANALYSISThe values of loss associated with accidents were obtained from the National Safety Council and a1991 Urban Institute/Federal Highway Administration (FHWA) study. Periodically, the National SafetyCouncil estimates the average cost of fatal and non-fatal injuries due to motor vehicle crashes. Theseestimates are made using comprehensive or willingness to pay method. These costs includeeconomic costs such as wage and productivity losses, medical expenses, motor vehicle damage, anda value reflecting lost quality of life.In 2001, the National Safety Council estimated the following average comprehensive costs on a perinjured person basis:Death $3,340,000Incapacitating injury $ 165,000Non-incapacitating evident injury $ 42,500Possible injury $ 20,200These per injured person costs were converted to per vehicle crash costs using formulas published inFHWA Technical Advisory T 7570 (June 30, 1988). The resulting costs per vehicle crash werecomputed to be the following, expressed in Year 2006 dollars:Fatal accident $4,314,665Injury accident $ 97,240Property damage only (PDO) accident costs were computed using a cost value obtained from theCal-B/C model. This model uses a value for PDO accidents estimated by the 1991 Urban Institute/FHWA study. The Urban Institute/FHWA calculated its estimate taking two primary factors intoaccount:1. Unreported accidents—Automobile accident surveys indicate that roughly 40 to 50 percent ofall PDO accidents are not reported.2. Combined property value—PDO accidents frequently involve more than one vehicle.The value of an average non-fatal, non-injury accident was calculated primarily using records of vehicleand property damage payments made by insurance companies. Some additional cost categories,such as travel delay and lost wages, were included to make minor contributions to the final estimate.After adjusting the Urban Institute/FHWA estimate to Year 2006 using the gross domestic productdeflator, a value of $8,067 per reported PDO accident was derived.Taking inflation into account, these estimates of accident costs compare favorably with values used infour computerized benefit-cost models, as reported in Table 8-14.One of the benefit-cost models, STEAM 2.0, calculates separate internal and external accident costs.Internal accident costs are defined as costs inflicted upon and perceived by transportation facilityusers. External costs are defined as costs inflicted on users, but not perceived by users. Table 8-15identifies the breakdown of these accident cost assumptions.Overall, the Caltrain <strong>Extension</strong> Alternative provides $7 million of highway accident avoidance costsavings annually, assuming current year dollars and year 2030 ridership levels.Details of these computations are provided in Table 8-16.parsons CHAPTER 8: EVALUATION OF ALTERNATIVES 186
CALTRAIN EXTENSION TO MONTEREY COUNTYALTERNATIVES ANALYSISTable 8-14Accident Cost EstimatesAccident TypeCSI*($ 1993)StratBENCOST**($ 1996)STEAM†($ 1997)<strong>Rail</strong>dec‡($ 1997)TAMC($ 2006)Fatality $3,325,095 $3,521,359 $2,726,350 $3,613,137 $4,314,665Injury $ 78,903 $ 83,848 $ 59,718 $ 86,033 $ 97,240PDO $ 5,651 $ 5,806 $ 3,322 $ 5,957 $ 8,067* Cambridge Systematics, Inc. (CSI), Approaches for Developing Nationwide Estimates of Congestion Delay, Accidents, Emissions, andNoise Impacts: Interim Report, 1995.** NCHRP Project 2-18(3), Development of an Innovative Highway User Cost Estimation Procedure. Midrange of costs reported.† FHWA, Surface <strong>Transportation</strong> Efficiency <strong>Analysis</strong> Model, 1997. Total of internal and external costs.‡ Companion to StratBENCOST which estimates the reduction in accident costs as the change in highway accidents between the baseand alternative (rail) case. StratBENCOST values inflated by 2.6 percent for all accident types. Parsons, based on California Life-Cycle Benefit/Cost <strong>Analysis</strong> Model, Technical Supplement to User’s Guide.Table 8-15Accident Cost Assumptions for TAMC ($ 2006)Accident Type Internal Cost External Cost Total CostFatality $3,667,465 $647,200 $4,314,665Injury $ 82,654 $ 14,586 $ 97,240PDO $ 6,857 $ 1,210 $ 8,067Source: ParsonsTable 8-16Crash Avoidance Benefits of Caltrain <strong>Extension</strong> and Express Bus <strong>Alternatives</strong>Parameter 2010 2030Annual VMT equivalents 31,562,557 60,542,039Fatality crash equivalents 0.357 0.684Injury crash equivalents 19.556 37.512PDO crash equivalents 31.847 61.087Fatality crash costs $1,540,335 $2,951,231Injury crash costs 1,901,625 3,647,667PDO crash costs 256,910 492,789Total accident costs $3,698,870 $7,091,687Internal costs 3,144,040 6,027,934External costs 554,830 1,063,753parsons CHAPTER 8: EVALUATION OF ALTERNATIVES 187
CALTRAIN EXTENSION TO MONTEREY COUNTYALTERNATIVES ANALYSISTransit AccidentsReductions in automobile accidents resulting from increased transit use will be offset to a small extentby increases in transit accidents. Transit accidents and costs can be computed as a function ofvehicle miles operated. Table 8-17 lists accident rates based on U.S. Department of <strong>Transportation</strong>national averages, as reported for the Cal-B/C analysis model. 12Table 8-17Default Fatality, Injury and Accident Rates per Million Vehicle-MilesIncidents Passenger Train Light <strong>Rail</strong> BusFatalities 0.24 0.23 0.05Injuries 0.94 12.8 12.2All accidents 1.09 11.13 14.73Source: U.S. DOT, average of 1994, 1995 and 1996 data.These accident rates are by event rather than accident type. Therefore, the fatality accident raterepresents the number of fatalities per million vehicle-miles rather than the number of fatalaccidents per million vehicle-miles. For rail modes, train-miles must be converted to vehicle-milesusing the average number of vehicles per train.Total transit accident costs are calculated by multiplying the accident rate by the cost for eachincident and summing across incident types. Property damage costs are multiplied by the totalaccident rate, since all transit accidents result in some level of property damage. Fatality and injurycosts are viewed as user disbenefits, inflicted upon and perceived by transportation system users(internal costs). Property damage to transit vehicles and non-transit users are considered to beexternal accident costs.Table 8-18 shows the costs that Cal-B/C uses for each type of transit incident based on 1995National Safety Council estimates. The cost of property damage for transit vehicles are based onestimates provided by the Federal <strong>Rail</strong>road Administration, the California Public Utilities Commission,and the Journal of Safety Research. All costs have been updated to Year 2006 dollars using thegross domestic product (GDP) deflator.Table 8-18Fatality, Injury and Property Damage Costs for Transit AccidentsIncidents Passenger Train Light <strong>Rail</strong> BusFatality $2,986,700 $2,986,700 $2,986,700Injury $ 72,290 $ 72,290 $ 72,280Property damage $ 68,275* $ 11,850** $ 11,600*Sources:* National Safety Council, Federal <strong>Rail</strong>road Administration, and Journal of Safety Research,Winter 1994, Volume 25, No. 4, page 193.** California Public Utilities Commission, 1997, Annual Report of <strong>Rail</strong>road Accidents Occurring inCalifornia, Appendix III-C—Light <strong>Rail</strong>, Rapid <strong>Rail</strong> and Cable Car Accidents, 1997.12California Life-Cycle Benefit/Cost <strong>Analysis</strong> Model, Booz-Allen & Hamilton, Inc., September 1999; and System Metrics Group, Inc., June2004.parsons CHAPTER 8: EVALUATION OF ALTERNATIVES 188
CALTRAIN EXTENSION TO MONTEREY COUNTYALTERNATIVES ANALYSISBased on these rates, the number of transit accidents and costs resulting from implementation of theCaltrain <strong>Extension</strong> or Express Bus alternatives is presented in Table 8-19.Table 8-19Transit Accident Disbenefits of Caltrain <strong>Extension</strong> and Express Bus <strong>Alternatives</strong>2010 2030Parameter Caltrain Express Bus Caltrain Express BusRevenue vehicle miles 193,290 867,970 386,580 1,664,915Fatalities 0.046 0.043 0.093 0.083Injuries 0.182 10.589 0.363 20.068All accidents 0.211 12.785 0.421 24.52Fatality costs $137,388 $ 128,428 $277,763 $ 247,896Injury costs $ 13,157 $ 765,479 $ 26,241 $1,450,716Property damage costs $ 14,406 $ 148,306 $ 28,744 $ 284,432Total accident costs $164,951 $1,042,213 $332,748 $1,983,044Internal (user) costs $150,545 $ 893,907 $304,004 $1,698,612External costs $ 14,406 $ 148,306 $ 28,744 $ 284,432Source: ParsonsEnvironmental CostsEnvironmental costs are computed based on methodologies reported in the Cal-B/C TechnicalSupplement to User’s Guide. 13 As surmised by the Cal-B/C research investigation,“<strong>Transportation</strong> investments have consequences for the natural environment. Environmentaleffects belong to the category of externalities—costs that fall on people other than those whogenerate them.“<strong>Transportation</strong> investments affect the environment because of the construction process,impacts of the facility itself, and resulting changes in travel behavior. … Travel changes, suchas increased travel speeds, increased vehicle trip-making, or diversion of trips, haveimplications for air pollution, greenhouse gas emissions, and noise.“The adverse health effects of vehicle emissions are probably the most significantenvironmental costs of travel. Enough is known about these effects to incorporate them readilyinto benefit-cost analyses. Vehicle emissions generally fall into two categories:• Air Pollutant Emissions – Motor vehicles emit pollutants, such as carbon monoxide(CO), oxides of nitrogen (NO X ), volatile organic compounds (VOC), particulate matter(PM), and oxides of sulfur (SO X ). These emissions, in turn, can react in the atmosphereto form other pollutants. Ozone is formed through the combination of NOX and VOC insunlight. NO X , VOC, and SO X can react in the atmosphere to form secondaryparticulates. Air pollutants can cause damage to human health, building materials, andagriculture and vegetation, as well as limit visibility.13Booz • Allen & Hamilton, Inc., September 1999; Volume 2: System Metrics Group, Inc., June 2004.parsons CHAPTER 8: EVALUATION OF ALTERNATIVES 189
CALTRAIN EXTENSION TO MONTEREY COUNTYALTERNATIVES ANALYSIS• Greenhouse Gas Emissions – Fuel consumption releases gases that trap heat withinthe Earth’s atmosphere, of which carbon dioxide is the most important. Increasingconcentrations of greenhouse gases in the atmosphere may be causing changes in theEarth’s climate that could potentially impose substantial costs on society in terms offlooding, crop loss, and increased incidence of disease.“The physical volumes of air-pollutants and greenhouse gas emissions resulting from travel arereadily quantified, as the processes that result in these emissions are well understood. …As aresult, many benefit-cost models include environmental costs resulting from air-pollutantemissions. Information on the effects of greenhouse gases is currently insufficient to support ameaningful range of cost estimates.“Other environmental effects are less significant, less understood, or difficult to quantify andvalue. As a result, these effects tend to be excluded from benefit-cost models. Ignored effectsinclude:• Noise…• Hazardous Materials Incidents…• Upstream Fuel Effects….“<strong>Transportation</strong> investments may result in increases or decreases in vehicle emissions. …As aresult, transportation projects can result in environmental benefits or disbenefits.”Air quality impacts resulting from station construction, Caltrain operation, commuter access tostations, and emissions credit from commuters using train service rather than auto trip making aredocumented in Caltrain <strong>Extension</strong> to Monterey County Passenger <strong>Rail</strong> Stations, Volume 1 DraftEnvironmental Impact Report (EIR). This analysis addressed emissions and emission creditsoccurring with the Monterey Bay Unified Air Pollution Control District’s area of interest, i.e., the NorthCentral Coast Air Basin—per the environmental scoping effort. The Caltrain <strong>Extension</strong> and ExpressBus alternatives impact a larger area, however, extending northward to the San Francisco Bay AirBasin. For this reason, environmental costs are determined generically below, using the emissionrates cited in the Caltrain <strong>Extension</strong> Draft EIR for passenger trains and commuter vehicles. The urbanbus emission rates are from the California Air Resource Board model, EMFAC2002 version 2.2,computed for the North Central Coast Air Basin.The discussion that follows pertains to operational emissions as opposed to construction emissions.Operational emissions consist of emissions directly from new operations of trains or express busesand indirect emissions from passenger vehicles traveling to the train stations/platforms. Theemissions decrease resulting from commuters taking the train or express bus rather than driving towork is also calculated as an emissions credit. The above emissions are calculated below for the2010 and 2030 planning horizons.Emissions from Train OperationThe estimated one-way trip distance traveled by train between Salinas and Gilroy is 37.9 miles. It isassumed that by 2010 there would be two round trip trains a day in operation, and by 2030 therewould be four round trip trains a day in operation. Therefore, the total miles traveled by train eachyear would be 38,658 miles by 2010 and 77,316 miles by 2030.The emissions from train operations can be calculated by multiplying the emission factors listed inEPA documents (USEPA, 1992 and USEPA, 1997) to the inverse of mileage of the train as derivedfrom the most recent information provided on the website of Bureau of <strong>Transportation</strong> Statisticsparsons CHAPTER 8: EVALUATION OF ALTERNATIVES 190
CALTRAIN EXTENSION TO MONTEREY COUNTYALTERNATIVES ANALYSIS(Bureau of <strong>Transportation</strong>s Statistics, 2002), and total daily miles traveled. For the train emissionscalculations, it was conservatively assumed that the train will haul six cars. In addition, trains wouldemit criteria air pollutants while idling. This idling currently occurs in Gilroy and San Francisco underthe No Project scenario. Under the Caltrain <strong>Extension</strong> Alternative, idling would occur in Salinas ratherthan Gilroy. The net difference in idling emissions is expected to be minimal. The calculated results oftrain cruising emissions are presented in Table 8-20.Table 8-20Emissions from Train OperationVOC**‡(g/mile)CO**(g/mile)NO X **(g/mile)PM 10 **(g/mile)SO X †(g/mile)Year 2010 ScenarioEmissions rates* 13.65 41.1 244.5 8.55 24.45Cruising emissions (tons/year) 0.58 1.75 10.42 0.36 1.04Year 2030 ScenarioEmission rates* 13.05 41.1 230.1 8.1 24.45Cruising emissions (tons/year) 1.11 3.50 19.61 0.69 2.08* Based on data published on BTS website from year 1995 to 1999 of Amtrak operation(http://199.79.179.77/publications/national_transportation_statistics/2002/html/table_rail_profile.html). It was conservatively assumedthat the train will haul six cars. Year 2030 scenario based on year 2014 emission rates.** Based on Technical Highlights of Emission Factors for Locomotives (USEPA, 1997).† Based on Procedures for Emission Inventory Preparation Volume IV: Mobile Sources (USEPA, 1992).‡ Assume all hydrocarbons are VOC (volatile organic compounds). Assume all PM are PM 10 (particulate matter up to 10 microns in size).Emissions from Express Bus OperationThe estimated one-way trip mileage traveled by an average express bus trip between MontereyCounty and the San Francisco Peninsula is 68 miles. Vehicles are assumed to deadhead (returnempty) to the Monterey Bay Area Operations Center between the morning and afternoon commuteperiods. Year 1020 bus mileage is estimated to be 1,735,940 (revenue plus deadhead) miles. Year2030 bus mileage is estimated to be 3,329,830.The emission rates used for buses are based on a blend of uncongested and congested speedswhich average 35 mph for 2010 conditions and 30 mph for 2030 conditions. The calculated results ofexpress bus operations are presented in Table 8-21.Table 8-21Emissions from Express Bus OperationVOC(g/mile)CO(g/mile)NO X(g/mile)PM 10(g/mile)SO X(g/mile)Year 2010 ScenarioEmissions factor (g/mile) 2.245 17.963 12.277 0.128 0.016Cruising daily emissions (tons/year) 4.30 34.37 23.49 0.24 0.03Year 2030 ScenarioEmission factor (g/mile) 2.752 20.56 12.31 0.149 0.017Cruising daily emissions 10.10 75.46 45.18 0.55 0.06parsons CHAPTER 8: EVALUATION OF ALTERNATIVES 191
CALTRAIN EXTENSION TO MONTEREY COUNTYALTERNATIVES ANALYSIS<strong>Commuter</strong> Vehicles Emissions from Home to Train StationEach working day, passengers will commute to the train or express bus stations from home usingvarious modes of transportation such as walking, bicycling, taking bus transit, driving to parking lotthen riding on the train or bus, or being dropped off and taking the express bus or train. No airemissions are associated with walking and bicycling. Changes in local bus transit emissions, if any,as a result of the project, would be expected to be minimal. Therefore, only park-and-ride and autodrop off will have air emissions associated with the proposed project. The emissions from commutervehicles traveling from home to train stations were calculated based on emission factors of grams permile multiplied by total daily miles traveled by vehicles from home to each of the three train stations orplatforms. Emission factors were derived from running the latest EMFAC2002 model version 2.2.EMFAC2002 is the emission factor model developed by CARB that calculates vehicle emissionsinventory and emission factors. The input parameters of EMFAC2002 include speed, temperature,humidity and other default data. The output of the EMFAC2002 contains emission rates or emissionfactors of criteria air pollutants. The total daily miles traveled by vehicles from home to each of thethree train stations/platforms were based on the average distance from home to each of the threestations/platforms and the mode of access. Table 8-22 specifies the percentage of commutersexpected to walk or bicycle, or take a bus, park-and-ride, or be dropped off.Table 8-22Estimated Mode of Arrival by StationMode Pajaro Valley Castroville SalinasWalk 4% 18% 20%Transit 54% 2% 15%Bicycle 5% 7% 5%Taxi — — —Auto drop-off 13% 9% 13%Park-and-ride 73% 64% 47%Source: Parsons, Caltrain <strong>Extension</strong> to Monterey County Project Study Report, Appendix B-2,Station Program RequirementsCalculated emissions for park-and-ride and to be dropped off category are presented in Table 8-23and Table 8-24 for year 2010 and year 2030, respectively.Table 8-23Emissions from Auto Access <strong>Commuter</strong> Vehicles (2010)VOC CO NO X PM 10 SO XEmission factor (grams/mile)—2010 0.169 3.833 0.487 0.014 0.003Daily emissions (pounds/day) at Pajaro location with total 1.02 23.04 2.93 0.08 0.02daily miles of 2,726Daily emissions (pounds/day) at Castroville location with 0.42 9.51 1.21 0.03 0.01total daily miles of 1,125Daily emissions (pounds/day) at Salinas location with total 1.36 30.83 3.92 0.11 0.02daily miles of 4,846Total (pounds/day) 2.79 63.38 8.06 0.22 0.05Total (tons/year) 0.36 8.08 1.03 0.03 0.01parsons CHAPTER 8: EVALUATION OF ALTERNATIVES 192
CALTRAIN EXTENSION TO MONTEREY COUNTYALTERNATIVES ANALYSISTable 8-24Emissions from Auto Access <strong>Commuter</strong> Vehicles (2030)VOC CO NO X PM 10 SO XEmission factor (grams/mile)—2014 0.094 2.438 0.303 0.013 0.003Daily emissions (pounds/day) at Pajaro location with total 0.98 25.38 3.15 0.13 0.03daily miles of 4,722Daily emissions (pounds/day) at Castroville location with 0.58 15.08 1.87 0.09 0.02total daily miles of 2,805Daily emissions (pounds/day) at Salinas location with total 1.82 47.45 5.90 0.26 0.05daily miles of 9,401Total (pounds/day) 3.38 87.91 10.92 0.48 0.10Total (tons/year) 0.43 11.21 1.39 0.06 0.01Emissions Credit from <strong>Commuter</strong> VehiclesOnce the proposed project starts in 2010, the commuters in the neighborhood of Pajaro, Castroville,and Salinas will have the option to travel by train or express bus to the Santa Clara, San Mateo, andSan Francisco areas to work. Therefore, the VMT would be greatly reduced. The reduction of VMT asa result of using train or bus to commute instead of driving was estimated for year 2010 and 2030.The annual reductions of VMT for 2010 and 2030 are 31.56 million and 60.54 million miles,respectively. The reduced VMT were multiplied by emission factors as derived from EMFAC2002model to calculate the reduction of emissions in tons per year. Table 8-25 presents the results ofemission rate reductions.Table 8-25Emissions Reduction (Credit) from <strong>Commuter</strong> VehiclesYear 2010VOC CO NO X PM 10 SO XEmission factor (grams/mile) 0.132 3.330 0.457 0.010 0.003Total annual emission reduction (tons/year) due to VMT reduction of 4.59 115.86 15.90 0.35 0.1031,562,557 milesYear 2030Emission factor (grams/mile) 0.073 2.108 0.283 0.010 0.003Total annual emission reduction (tons/year) due to VMT reduction of 4.87 140.68 18.89 0.67 0.2060,542,349 milesTotal Operational Net Increase of Project EmissionsThe total operational net increase of the Caltrain <strong>Extension</strong> or Express Bus alternative emissions arecalculated by adding the train/express bus operational emissions to the home to station commuteremissions and then subtracting the commuter emissions credit as a result of commuters taking thetrain or express bus instead of driving to work. Tables 8-26 and 8-27 present the calculated resultswhich show the operational total net increase (decrease) of air pollutants.parsons CHAPTER 8: EVALUATION OF ALTERNATIVES 193
CALTRAIN EXTENSION TO MONTEREY COUNTYALTERNATIVES ANALYSISTable 8-26Net Change of Operational Emissions Associated with Caltrain <strong>Extension</strong> Caltrain<strong>Extension</strong> Alternative (tons/year)Year 2010VOC CO NO X PM 10 SO XTrain emissions 0.58 1.75 10.42 0.36 1.04<strong>Commuter</strong> vehicle emissions from home to train station 0.36 8.08 1.03 0.08 0.01<strong>Commuter</strong> emission reductions (4.59) (115.86) (15.90) (0.35) (0.10)2010 Total Net Change of Operational Omissions (3.65) (106.03) (4.45) 0.04 0.95Year 2030Train emissions 1.11 3.50 19.61 0.69 2.08<strong>Commuter</strong> vehicle emissions from home to train station 0.43 11.21 1.39 0.06 0.01<strong>Commuter</strong> emission reductions (4.87) (140.68) (18.89) (0.67) (0.20)2030 Total Net Change of Operational Emissions (3.33) (125.97) 2.11 0.08 1.89Table 8-27Net Change of Operational Emissions Associated with Express Bus Alternative (tons/year)Year 2010VOC CO NO X PM 10 SO XExpress bus emissions 4.30 34.37 23.49 0.24 0.03<strong>Commuter</strong> vehicle emissions from home to station 0.36 8.08 1.03 0.03 0.01<strong>Commuter</strong> emission reductions (4.59) (115.86) (15.90) (0.35) (0.10)2010 Total Net Change of Operational Omissions 0.07 (73.41) 8.62 (0.08) (0.06)Year 2030Express bus emissions 10.10 75.46 45.18 0.55 0.06<strong>Commuter</strong> vehicle emissions from home to station 0.43 11.21 1.39 0.06 0.01<strong>Commuter</strong> emission reductions (4.87) (140.68) (18.89) (0.67) (0.20)2030 Total Net Change of Operational Emissions 5.66 54.01 27.68 (0.06) (0.13)Health Cost of Motor Vehicle EmissionsThe net change in motor vehicle emissions were calculated for the Caltrain <strong>Extension</strong> Alternative andthe Express Bus Alternative as discussed above. Emission factors were derived from running thelatest EMFAC2002 model version 2.2 for the North Central Coast Air Basin. These rates were appliedto the total journey, which includes the San Francisco Bay Air Basin, as a simplifying assumption. Forthe passenger rail, express bus and auto modes, 2010 emission rates were applied to the 2010 operatingscenario. For the 2030 operating scenario, 2014 emission rates were applied for the passengerrail and auto modes; while 2010 rates, reflecting a 5 mph overall speed reduction, were applied to theexpress bus mode. Thus, motor vehicle emissions for the 2030 scenario are overstated.Monetary values for the motor vehicle emissions were obtained from the Cal-B/C model as updated in2004. These health costs are listed in Table 8-28 and have been updated from 2003 to 2006 usingthe GDP deflator (1.0412).parsons CHAPTER 8: EVALUATION OF ALTERNATIVES 194
CALTRAIN EXTENSION TO MONTEREY COUNTYALTERNATIVES ANALYSISTable 8-28Health Cost of Motor Vehicle Emissions ($/ton)*EmissionValueVolatile organic compounds VOC $ 993Carbon monoxide CO $ 62Fine particulates PM 10 $114,801Nitrogen oxides NO X $ 14,208Sulfur dioxide SO 2 $ 57,338Source: California Life-Cycle Benefit/Cost <strong>Analysis</strong> Model, Technical Supplement to User’s Guide, 2004* California urban areasThe resulting health cost of transportation emissions associated with the Caltrain <strong>Extension</strong> andExpress Bus alternatives are itemized in Table 8-29.Table 8-29Health Cost of Caltrain <strong>Extension</strong> and Express Bus <strong>Alternatives</strong>Year 2010VOC CO NO X PM 10 SO X TotalCaltrain ($3,624) ($6,574) ($63,226) $4,592 $54,471 ($14,361)Express bus $70 ($4,551) $122,473 ($9,184) ($3,440) $105,368Year 2030Caltrain ($3,307) ($7,810) $ 29,979 $9,184 $108,369 $136,415Express bus $5,620 ($3,349) $393,277 ($6,884) ($7,454) $381,210Net Operating CostsFares (user fees) paid by riders to utilize the Caltrain <strong>Extension</strong> or Express Bus services will beinsufficient to fully cover the operations and maintenance (O&M) costs of the services. The O&Mcosts for the Caltrain <strong>Extension</strong> and Express Bus alternatives were listed in Tables 6-8 and 6-10.Passenger revenues were listed in Table 6-13. The resulting net operating cost, i.e., the differencebetween O&M costs and passenger revenues, are summarized in Table 8-30 for the 2010 and 2030planning horizons.Table 8-30Net Operating CostsCaltrain <strong>Extension</strong> AlternativeExpress Bus AlternativeParameter 2010 2030 2010 2030Annual O&M cost ($ 2007) $4,485,680 $8,714,409 $8,566,707 $17,133,413Annual fare revenue $3,310,612 $6,320,790 $3,310,612 $ 6,320,790Annual net public operating cost $1,175,068 $2,393,619 $5,256,095 $10,812,623parsons CHAPTER 8: EVALUATION OF ALTERNATIVES 195
CALTRAIN EXTENSION TO MONTEREY COUNTYALTERNATIVES ANALYSISSummary of BenefitsThe Caltrain <strong>Extension</strong> Alternative and Express Bus Alternative will both produce net savings in traveltime, crashes, and vehicle operating expense. These findings are summarized in Table 8-31 and aresorted by benefit type. The benefits monetized in Table 8-31 are expressed as positive dollars, whilecosts are expressed as (negative) dollars. Table 8-31 demonstrates that the benefits of the Caltrain<strong>Extension</strong> Alternative exceed the benefits of the Express Bus Alternative in both 2010 and 2030.Table 8-31Summary of Caltrain <strong>Extension</strong> and Express Bus Alternative Benefits2010 2030Benefit Type Caltrain Express Bus Caltrain Express BusUser BenefitsIn-vehicle travel time (Method 3) $ 252,032 $ 252,032 $ 6,985,931 $ 4,160,454Fuel costs 4,499,622 4,499,622 8,631,039 8,631,039Non-fuel operating savings 1,925,316 1,925,316 3,693,083 3,693,083Transit user fees (3,310,612) (3,310,612) (6,320,790) (6,320,790)Internal accident costs or savings— 3,144,040 3,144,040 6,027,934 6,027,934Highway(150,545) (893,907) (304,004) (1,698,612)Revenue Transfers (fuel taxes) (893,915) (893,915) (1,714,681) (1,714,681)Reduction in External CostsEmissions 14,361 (105,368) (136,415) (381,210)Highway accidents 554,830 554,830 1,063,753 1,063,753Transit accidents (14,406) (148,306) (28,744) (284,432)Net Public Operating Costs (1,175,068) (5,256,095) (2,393,619) (10,812,623)Total $4,845,655 ($232,363) $15,503,487 $2,363,915Life-Cycle Benefits and CostsThe Caltrain <strong>Extension</strong> and Express Bus alternatives are assumed to be implemented by 2010, withthe initiation of service occurring in 2011. The Caltrain <strong>Extension</strong> Alternative assumes that rollingstock for the JPB Caltrain fleet will be purchased in 2010 14 . The Express Bus Alternative assumesthat rolling stock will be purchased in 2010 and at five-year increments thereafter, to increase thefleet size from 30 to 60 vehicles over time. Replacement express bus vehicles are assumed to berequired at 12-year intervals. All FY 2007 dollar capital costs reported in Chapter 6 have beenassumed to reflect year end 2006 dollars.Tables 8-32 and 8-33 report comparisons of life-cycle benefits and costs for the Caltrain <strong>Extension</strong>and Express Bus alternatives, with each compared to the No Build Alternative. Total benefits and14Additional trainset capacity (additions of coaches to consists) required to accommodate riders boarding/deboarding in Monterey Countyare assumed to be addressed through Federal Transit Administration grant requests, with TAMC providing the local funding match contribution.Acquisition of rolling stock to accommodate the initial (two round trip) service plan for extending Caltrain to Salinas has not beenidentified as a near-term requirement by this <strong>Alternatives</strong> <strong>Analysis</strong>. At some time in the future, TAMC anticipates the need to participate inJPB’s rolling stock acquisition program. For the purpose of the <strong>Alternatives</strong> <strong>Analysis</strong> Study, the Caltrain <strong>Extension</strong> Alternative assumesthe acquisition of four bi-level passenger coaches, one for each of the trainsets operating to/from Salinas. This rolling stock may not berequired to accommodate peak passenger loads. The capital cost of this equipment is included as a risk element for comparison with theExpress Bus Alternative.parsons CHAPTER 8: EVALUATION OF ALTERNATIVES 196
CALTRAIN EXTENSION TO MONTEREY COUNTYALTERNATIVES ANALYSIScosts and the net present values of the overall system improvements assume a discount rate ofseven percent. Benefits are computed for a 20-year period from 2011 to 2030.For the Caltrain <strong>Extension</strong> Alternative, these findings indicate the following:1. Total benefits ($203,491,430) exceed total costs ($102,098,450) by $101,392,980 (FY 2007dollars). This benefit/cost (B/C) ratio is 1.99.2. The net present value of these benefits, assuming a discount rate of seven percent is$77,412,425. The net present value of implementation costs is $87,840,176. This B/C ratio is0.88.3. The payback 15 period, at a discount rate of seven percent, is 23.5 years.Table 8-32Life-Cycle Benefits and Costs of Caltrain <strong>Extension</strong> AlternativeYear Total Benefits Total Costs Net Present Value Net Present Value Benefits Net Present Value Costs200720082009201020112012201320142015201620172018201920202021202220232024202520262027202820292030————4,845,6555,406,5945,967,5326,528,4717,089,4097,650,3488,211,2868,772,2259,333,1639,894,10210,455,04011,015,97811,576,91612,137,85412,698,79213,259,73013,820,66814,381,60614,942,54415,503,4873,995,24318,273,70428,102,20851,747,296————————————————————1.0000.9350.8730.8160.7630.7130.6660.6230.5820.5440.5080.4750.4440.4150.3880.3620.3390.3170.2960.2770.2580.2420.2260.2113,697,2353,854,9023,974,3764,067,2374,126,0364,161,7894,171,3334,166,8074,143,9244,106,0524,056,5563,987,7843,924,5753,847,7003,758,8423,672,9453,565,7323,480,3493,377,0153,271,2363,995,24317,085,91324,533,22742,225,793—————————203,491,430 102,098,450 77,412,425 87,840,176———————————Source: ParsonsFor the Express Bus Alternative, the benefit-cost findings are as follows:4. Total benefits ($21,315,517) are less than total costs ($116,455,555) by 95,140,038 (FY 2007dollars). This B/C ratio is 0.18.15The payback period is the amount of time measured in years to recover the life-cycle investments (capital and net public operating costs).parsons CHAPTER 8: EVALUATION OF ALTERNATIVES 197
CALTRAIN EXTENSION TO MONTEREY COUNTYALTERNATIVES ANALYSIS5. The net present value of these benefits, assuming a payback period of 20 years and adiscount rate of seven percent is $6,638,766. The net present value of implementation costs is$84,246,711. This B/C ratio is 0.08.6. At a discount rate of seven percent, user benefits and external costs do not pay back thepublic investment in the Express Bus Alternative due to the high net public cost of express busoperations and the need for periodic replacement of the bus fleet.Table 8-34 compares these life-cycle benefits and costs for the Caltrain <strong>Extension</strong> and Express Busalternatives.Table 8-33Life-Cycle Benefits and Costs of Express Bus AlternativeYear Total Benefits Total Costs Net Present Value Net Present Value Benefits Net Present Value Costs200720082009———3,200,90311,765,43419,472,4131.0000.9350.873———3,200,90311,000,68016,999,416201020112012201320142015201620172018201920202021202220232024202520262027202820292030—(232,363)(95,717)40,929177,575314,222450,868587,514724,160860,80747,016,805———5,000,000———10,000,000—0.8160.7630.7130.6660.6230.5820.5440.5080.4750.444—(177,293)(68,246)27,259110,629182,877245,272298,457343,976382,19838,365,712———3,115,000———4,750,000—997,4531,134,0991,270,7451,407,3911,544,0381,680,6841,817,3301,953,9762,090,6222,227,2692,363,915——15,000,000———5,000,000————0.4150.3880.3620.3390.3170.2960.2770.2580.2420.2260.211413,943440,030460,010477,106489,460497,482503,400504,126505,931503,363498,786——5,430,000———1,385,000————Source: Parsons21,315,517 116,455,555 6,638,766 84,246,711Table 8-34Summary of Benefit Cost <strong>Analysis</strong> ResultsCaltrain <strong>Extension</strong>Express BusLife-cycle benefits/total costs ratio $203 M/$102 M = 1.99 $21 M/$116 M = 0.18Net present value of benefits/costs at 7% discount rate $77 M/$88 M = 0.88 $7 M/$84 M = 0.08Payback period at 7% discount rate 23.5 years Not paid back** The payback period is the amount of time measured in years to recover the life-cycle investments (capital and net public operatingcosts). The table shows that public investment in the Express Bus Alternative will never be paid back.parsons CHAPTER 8: EVALUATION OF ALTERNATIVES 198
CALTRAIN EXTENSION TO MONTEREY COUNTYALTERNATIVES ANALYSISSOCIAL PERFORMANCE OF THE CALTRAIN EXTENSION AND EXPRESSBUS ALTERNATIVESThe social or societal performance evaluation of the alternatives is intended to provide additionalinformation for decision making, other than economic performance. Included in this section are quantitativeand/or qualitative measurements of criteria often used for transit investment decision making.Daily Transit RidersTransit ridership for the Caltrain <strong>Extension</strong> and Express Bus alternatives is a key ingredient ofdetermining both cost effectiveness and societal feasibility, which includes very limited transit servicebetween Monterey County and the San Francisco Bay Area, is assumed to carry negligible ridership(less than 50 riders per day) insofar as determining the beneficial impacts of Caltrain <strong>Extension</strong> orExpress Bus investments. Hence, virtually all ridership attracted to the Caltrain <strong>Extension</strong> andExpress Bus alternatives is considered to be “new” riders.The estimate of Caltrain <strong>Extension</strong>/Express Bus Alternative ridership is assumed to be equal, asreported earlier. Annual patrons along with annual passenger miles are reported in Table 8-35 forreference. The table indicates that 524,280 passengers are anticipated as of year 2010; increasing to1,001,130 by 2030. Expressed on a daily basis, these equate to 2,056 riders per weekday in 2010(1,028 each direction), and 3,926 riders per weekday in 2030 (1,963 each direction).Table 8-352010 and 2030 Annual Passengers and Annual Passenger Miles2010 2030Egress/Access Pajaro Castroville Salinas Total Pajaro Castroville Salinas TotalAnnual PassengersSanta Clara–Mid 48,960 10,200 89,250 148,410 85,170 25,500 173,400 284,070Santa Clara–North 106,590 22,440 193,290 322,320 184,620 55,590 374,850 615,060San Mateo 12,240 2,550 21,930 36,720 20,910 6,120 42,840 69,870San Francisco 5,610 1,020 10,200 16,830 9,690 3,060 19,380 32,130173,400 36,210 314,670 524,280 300,390 90,270 610,470 1,001,130Annual Passenger MilesSanta Clara–Mid 2,428,416 601,800 6,015,450 9,045,666 4,224,432 1,504,500 11,687,160 17,416,092Santa Clara–North 6,960,327 1,676,268 16,062,399 24,698,994 12,055,686 4,152,573 31,150,035 47,358,294San Mateo 973,080 226,695 2,133,789 3,333,564 1,662,345 544,068 4,168,332 6,374,745San Francisco 544,731 108,630 1,171,980 1,825,341 940,899 325,890 2,226,762 3,493,55110,906,554 2,613,393 25,383,618 38,903,565 18,883,362 6,527,031 49,232,289 74,642,682These ridership levels are modest by comparison with many “new starts” proposals. When expressedas equivalent riders, based on passenger miles traveled, these ridership levels are impressive.Listed in Table 8-36 are statistics culled from the 2004 National Transit Database regarding averagetrip lengths of transit riders. The table also lists rider equivalents for the Caltrain <strong>Extension</strong> or ExpressBus alternatives.Interpretation of the table is as follows. The average transit rider trip length for the proposed MontereyCounty service is 74.2 one-way miles. Compared to the national commuter rail average of 23.5 miles,the Monterey County service will attract trips which are 3.16 times as long on average. The 2,056parsons CHAPTER 8: EVALUATION OF ALTERNATIVES 199
CALTRAIN EXTENSION TO MONTEREY COUNTYALTERNATIVES ANALYSISdaily trips on the Caltrain <strong>Extension</strong> or Express Bus service to Monterey County would be equal tonearly 6,500 average commuter rail riders, more than 12,000 daily Bay Area Rapid Transit (BART)riders, or nearly 35,000 riders on Santa Clara Valley <strong>Transportation</strong> Authority’s (VTA) bus and lightrail system based on passenger miles traveled.Table 8-36Daily Caltrain <strong>Extension</strong> Transit Rider Equivalents Based on Trip Length (2004)Mode/ServiceAverage TripLength (miles)Trip LengthRatio*Daily RiderEquivalent†Monterey County Caltrain <strong>Extension</strong>/Express Bus (2010) 74.2 1 2,056National<strong>Commuter</strong> rail 23.5 3.16 6,497Heavy rail 5.2 14.27 29,339Light rail 4.5 16.49 33,903Bus 3.7 20.05 41,223San Francisco Bay AreaCaltrain Peninsula Corridor Joint Powers Board (JPB) 20.07 3.70 7,607Altamont <strong>Commuter</strong> Express (ACE) 47.92 1.55 3,187Bay Area Rapid Transit (BART) 12.59 5.89 12,110Santa Clara Valley <strong>Transportation</strong> Authority (VTA) 4.42 16.79 34,520Source: 2004 National Transit Database, Parsons*Trip Length Ratio = Monterey County Average Trip Length ÷ Average Trip Length†Daily Rider Equivalent = Trip Length Ratio × Monterey County Daily Rider EquivalentCost per RiderTable 8-37 compares ridership and passenger miles with annualized capital costs, O&M costs, andnet public (subsidy) costs. Information is presented for 2010 and 2030 ridership levels for the Caltrain<strong>Extension</strong> Alternative and the Express Bus Alternative.Table 8-37Capital and Operating Costs per Rider and per Passenger MileCaltrain <strong>Extension</strong> AlternativeExpress Bus AlternativeParameter 2010 2030 2010 2030Annual ridership 524,280 1,001,130 524,280 1,001,130Annual passenger miles 38,903,565 74,642,682 38,903,565 74,642,682Annualized capital cost ($ 2007) $7,150,000 $7,905,137 $7,337,476 $9,226,006Annualized capital cost per rider $13.64 $7.90 $14.00 $9.22Annualized capital cost per passenger mile $0.184 $0.106 $0.189 $0.124Annual O&M cost ($ 2007) $4,485,680 $8,714,409 $8,566,7071 $17,133,413O&M cost per rider $8.56 $8.70 $16.34 $17.11O&M cost per passenger mile $0.115 $0.117 $0.220 $0.230Annual fare revenue $3,310,612 $6,320,790 $3,310,612 $6,320,790Annual net public operating cost $1,175,068 $2,393,619 $5,256,095 $10,812,623Net public operating cost per rider $2.24 $2.39 $10.03 $10.80Net public operating cost per passenger mile $0.030 $0.032 $0.135 $0.145parsons CHAPTER 8: EVALUATION OF ALTERNATIVES 200
CALTRAIN EXTENSION TO MONTEREY COUNTYALTERNATIVES ANALYSISInsofar as O&M cost per rider and net public cost per rider, differences between the Caltrain<strong>Extension</strong> and Express Bus alternatives are less pronounced than indicated by the table. Figure 8-2illustrates that Caltrain costs are based on capacity increments which are far greater than ExpressBus capacity increments. At low levels of ridership, under 500 boardings per day in Monterey County(1,000 daily riders round trip), Express Bus is more cost-effective from an O&M cost per riderperspective. At higher levels of ridership, commuter rail service is more cost-effective.Figure 8-2Annual Operating and Maintenance Expense ($ 2007) versus Weekday Ridership LevelsFarebox RecoveryThe farebox recovery ratio for the overall Caltrain service ranges between 30 and 40 percent asindicated below.Caltrain Farebox Recovery RatesFare Revenue Operating Expense Percentage of RecoveryFY 2006 Budgeted $29,760,000 $76,540,321 38.88%FY 2005 Unaudited $23,036,916 $70,574,877 32.64%FY 2004 $19,257,579 $63,817,729 30.18%FY 2003 $20,792,652 $61,557,117 33.78%FY 2002 $22,555,383 $61,536,691 36.65%FY 2001 $23,916,036 $63,172,430 37.86%Source: Peninsula Corridor Joint Powers Board Staff Report, February 2, 2006parsons CHAPTER 8: EVALUATION OF ALTERNATIVES 201
CALTRAIN EXTENSION TO MONTEREY COUNTYALTERNATIVES ANALYSISThe proposed extension of Caltrain service to Salinas will recover approximately twice this rate (73.8percent). This higher recovery rate is due to three factors:1. The incremental increase in operating expense is based on the operation of trains over 37miles of UP track between Salinas and Gilroy.2. The incremental increase in fare revenue is based on riders paying fares reflecting an averagepassenger trip length of 74.2 miles.3. The ratio of average fare to operating expense is twice that of existing Caltrain service.Insofar are the Express Bus Alternative, the farebox recovery projected for 2010 operations andridership is 38.6 percent, equal to existing Caltrain service. This lower than Caltrain <strong>Extension</strong>Alternative recovery rate is due to the following:1. The incremental increase in operating expense is based on the operation of buses to servicean average passenger grip length of 74.2 miles.2. The incremental increase in fare revenue is based on riders paying fares reflecting an averagetrip length of 74.2 miles3. The Express Bus Alternative ratio of average fare to operating expense is 1.0, equal to that ofexisting Caltrain service.Population ServedThe Caltrain <strong>Extension</strong> and Express Bus <strong>Alternatives</strong> will serve commuters traveling to jobs in SiliconValley; students attending colleges and universities in the San Francisco Bay Area; business andrecreational travelers using the San Jose and San Francisco airports; and residents accessing healthcare facilities, sports venues, recreational destinations and shopping attractions in the San FranciscoBay Area.As of 2000, more than 233,000 residents of Monterey County and southern Santa Cruz County livedwithin 4.5 miles of one of the three Caltrain <strong>Extension</strong> Alternative commuter rail stations. By 2025,more than 330,000 residents of these counties will be served by these three stations. Additionalresidents in Marina and Seaside would be served by the Marina/CSUMB (California State University–Monterey Bay) Transit Center and park-and-ride facility proposed for the Express Bus Alternative.Figure 8-3 illustrates the station access buffers for the three Caltrain <strong>Extension</strong> Alternative stationslocated in Pajaro/Watsonville, Castroville and Salinas. Household population statistics for the threestations are reported in Table 8-38.Racial and Ethnic Population ServedMonterey CountyThe communities of Pajaro and Castroville are unincorporated areas of Monterey County. Accordingto the findings of the 2000 U.S. Census, approximately 47 percent of Monterey County’s population(unincorporated and incorporated areas) was identified as being of Hispanic/Latino background. Ofthe total 401,762 persons reported in the 2000 U.S. Census data for Monterey County, 187,969identified themselves as of Hispanic/Latino background and the remaining 213,793 persons wereidentified as non-Hispanic/Latino (Monterey County, 2003).parsons CHAPTER 8: EVALUATION OF ALTERNATIVES 202
CALTRAIN EXTENSION TO MONTEREY COUNTYALTERNATIVES ANALYSISFigure 8-3Monterey County Station Locations and Access Buffers645188AA-032parsons CHAPTER 8: EVALUATION OF ALTERNATIVES 203
CALTRAIN EXTENSION TO MONTEREY COUNTYALTERNATIVES ANALYSISTable 8-38Socio-Economic Data with Buffer Information around StationsStations/BuffersCastrovillePajaroSalinasHouseholdPopulation2000 2010 2020 2025PercentShareHouseholdPopulationPercentShareHouseholdPopulationPercentShareHouseholdPopulation0.5-mile buffer 7,682 8,003 8,196 8,5102.5-mile buffer 4,920 5,424 5,850 6,1554.5-mile buffer 3,917 8,516 12,986 15,125PercentShareSubtotal 16,519 7% 21,943 8% 27,032 9% 29,790 9%0.5-mile buffer 5,296 5,485 5,587 5,6432.5-mile buffer 39,407 43,405 47,081 48,9884.5-mile buffer 33,065 36,529 39,733 41,430Subtotal 77,768 33% 85,419 31% 92,401 30% 96,061 29%0.5-mile buffer 13,256 14,742 16,001 16,1192.5-mile buffer 99,493 114,641 127,929 145,7954.5-mile buffer 25,970 35,050 43,566 42,969Subtotal 138,719 60% 164,433 60% 187,496 61% 204,883 62%Total 233,006 100% 271,795 100% 306,929 100% 330,734 100%Source: Parsons 645188-033SalinasBased on the 2000 U.S. Census, the city’s population is 64 percent Hispanic, 45 percent Caucasian,6 percent Asian, 3 percent African-American, and 1 percent Native American.Figure 8-4 illustrates the distribution of population and race by census block group relative to theCaltrain <strong>Extension</strong> Alternative and Express Bus Alternative station sites. The graphic illustratesrelatively high concentrations of racial and ethnic populations that would be served by the proposedinvestments.Income Levels of Population ServedMonterey CountyThe 2000 U.S. Census data reports median income for the calendar year 1999. According to thatdata, the median household income for Monterey County was $48,305 annually. The informationbelow compares Monterey County’s median household income with that of neighboring counties andthe state (Monterey County, 2003).Geographic Area 1999 Median Household IncomeMonterey County $48,305Santa Cruz County $53,998San Luis Obispo County $42,428Santa Clara County $74,335State of California $47,493Source: U.S. Census, 2000645188AA-096parsons CHAPTER 8: EVALUATION OF ALTERNATIVES 204
CALTRAIN EXTENSION TO MONTEREY COUNTYALTERNATIVES ANALYSISFigure 8-4Monterey Bay Area Population and Race645188AA-063parsons CHAPTER 8: EVALUATION OF ALTERNATIVES 205
CALTRAIN EXTENSION TO MONTEREY COUNTYALTERNATIVES ANALYSISAt the time that the Monterey County Housing Element was prepared (2003), the 2000 U.S. Censusdata regarding household income according to the income categories of lower, moderate and abovemoderate was not yet available. Based on 1990 U.S. Census Data for the County of Monterey (unincorporatedand incorporated areas), approximately 22 percent of all households could be consideredvery low income and another 19 percent of households as low income.The State of California, Department of Finance, has estimated that there were 34,762 households asof January 1, 2002 in the unincorporated areas of Monterey County. The chart below demonstratesthe estimated number of households by income category using the 1990 household incomepercentage distributions as applied to the 2002 Department of Finance household estimates.HouseholdIncome:VeryLowLowModerateAboveModerateUnincorporatedArea TotalNumber of Households 7,648 6,605 8,690 11,819 34,762(Percentage of Total) 22% 19% 25% 34% 100%645188AA-097Information provided in the Housing Element (Monterey County, 2003) indicates that the two majorindustries in Monterey County are tourism and agriculture. The average annual wage in the“agricultural industry cluster” in Monterey County is approximately $18,608, which is considered verylow income for households of two persons or more. Tourism related jobs also pay very low wages.Households with members who rely on employment in either or both of these fields could beexpected to qualify as either very low or low income, depending on household size.SalinasThe 1990 U.S. Census indicates that 49.85 percent of Salinas’ population is of low and moderateincome. The city of Salinas’ economy is predominantly agriculturally oriented, with relatively lowskilled,low-paying jobs (City of Salinas, 2002).Figure 8-5 illustrates the distribution of population by block group above and below income povertylevels according to the 2000 census. The graphic illustrates concentrations of lower income familieswhich would be served by the proposed transit investment.Similar to the assessment of household population served by the Caltrain <strong>Extension</strong> <strong>Alternatives</strong>tations located in Monterey County, a tabulation of jobs within easy access of existing Caltrainstations was undertaken. Buffers of 0.5-mile, 1-mile, and 2-mile radii were drawn around each of theCaltrain stations located within Santa Clara County. Data from surveys of Caltrain and Altamont<strong>Commuter</strong> Express (ACE) riders indicate that existing riders of commuter rail travel to jobs wellbeyond the 0.5-mile radius typically assumed by Federal Transit Administration (FTA) for its “NewStarts” mobility criteria. In Santa Clara County, the presence of shuttle bus service provided by majoremployers and the VTA greatly increases the accessibility of these commuter rail stations to jobs.Figures 8-6 and 8-7 illustrate the commuter rail station locations and accessibility buffers within SantaClara County. Figure 8-6 includes an ACE station at the Great America theme park within the city ofSanta Clara for reference.Table 8-39 presents a tabulation of jobs accessible to Caltrain stations. Caltrain provides transitaccess to 572,737 jobs within Santa Clara County as of Year 2000 estimates. Jobs in San Mateo andSan Francisco counties would be in addition. Please note that the tabulation of jobs served by thestations excludes double counting due to overlaps of the buffers.parsons CHAPTER 8: EVALUATION OF ALTERNATIVES 206
CALTRAIN EXTENSION TO MONTEREY COUNTYALTERNATIVES ANALYSISFigure 8-5Monterey Bay Area Population by Poverty Level645188AA-064parsons CHAPTER 8: EVALUATION OF ALTERNATIVES 207
CALTRAIN EXTENSION TO MONTEREY COUNTYALTERNATIVES ANALYSISFigure 8-6Santa Clara County Station Locations and Access Buffers—North CountyTotal Jobs for 2000 and 2025 for Selected Distances from <strong>Rail</strong> StationsStation0.5 Mile Buffer 1.0 Mile Buffer 2.0 Mile BufferID No. Jobs 2000 Jobs 2025 Jobs 2000 Jobs 2025 Jobs 2000 Jobs 20251 4,457 4,597 10,453 11,811 19,868 26,4222 163 97 511 545 1,286 3,3713 1,029 1,713 4,251 7,438 9,132 23,6754 6,340 8,134 17,038 21,569 34,852 44,1015 1,422 1,725 4,155 5,108 12,018 14,5816 2,430 2,990 9,488 11,294 24,527 29,0907 7,736 10,401 38,030 52,196 75,682 104,0418 8,201 10,300 22,350 28,102 99,643 117,4269 2,710 3,069 19,207 23,276 63,905 78,27510 8,224 10,093 32,258 41,327 72,673 84,98111 6,550 7,683 22,393 27,670 51,926 66,48212 8,276 9,813 19,705 23,532 39,483 47,23213 5,007 5,714 18,118 21,588 45,441 53,88214 4,292 4,741 16,156 17,515 43,678 46,76915 12,967 13,693 32,341 34,194 42,528 44,926645188AA-10645188AA-034parsons CHAPTER 8: EVALUATION OF ALTERNATIVES 208
CALTRAIN EXTENSION TO MONTEREY COUNTYALTERNATIVES ANALYSISFigure 8-7Santa Clara County Station Locations and Access Buffers—South CountyTotal Jobs for 2000 and 2025 for Selected Distances from <strong>Rail</strong> StationsStation 0.5 Mile Buffer 1.0 Mile Buffer 2.0 Mile BufferID No. Jobs 2000 Jobs 2025 Jobs 2000 Jobs 2025 Jobs 2000 Jobs 20251 4,457 4,597 10,453 11,811 19,868 26,4222 163 97 511 545 1,286 3,3713 1,029 1,713 4,251 7,438 9,132 23,6754 6,340 8,134 17,038 21,569 34,852 44,1015 1,422 1,725 4,155 5,108 12,018 14,5816 2,430 2,990 9,488 11,294 24,527 29,0907 7,736 10,401 38,030 52,196 75,682 104,0418 8,201 10,300 22,350 28,102 99,643 117,4269 2,710 3,069 19,207 23,276 63,905 78,27510 8,224 10,093 32,258 41,327 72,673 84,98111 6,550 7,683 22,393 27,670 51,926 66,48212 8,276 9,813 19,705 23,532 39,483 47,23213 5,007 5,714 18,118 21,588 45,441 53,88214 4,292 4,741 16,156 17,515 43,678 46,76915 12,967 13,693 32,341 34,194 42,528 44,926645188AA-035parsons CHAPTER 8: EVALUATION OF ALTERNATIVES 209
CALTRAIN EXTENSION TO MONTEREY COUNTYALTERNATIVES ANALYSISTable 8-39<strong>Commuter</strong> <strong>Rail</strong> Access to Employment in Santa Clara CountyID No.Range 0.5 Mile 1.0 Mile 2.0 MilesStation 2000 2025 2000 2025 2000 202515 Palo Alto 12,967 13,693 32,341 34,194 42,528 44,29614 California 4,292 4,741 16,156 17,515 43,678 46,76913 San Antonio 5,007 5,714 18,118 21,588 45,441 53,88212 Mountain View 8,276 9,813 19,705 23,532 39,483 47,23211 Sunnyvale 6,550 7,683 22,393 27,670 51,926 66,48210 Lawrence 8,224 10,093 35,258 41,327 72,673 84,9818 Santa Clara 8,201 10,300 22,350 28,102 99,643 117,4267 San Jose 7,736 10,401 38,030 52,196 75,682 104,0416 Tamien 2,430 2,990 9,488 11,294 24,527 29,0905 Capitol Expressway 1,422 1,725 4,155 5,108 12,018 14,5814 Blossom Hill 6,340 8,134 17,038 21,569 34,852 44,1013 Morgan Hill 1,029 1,713 4,251 7,438 9,132 23,6752 San Martin 163 97 511 545 1,286 3,3711 Gilroy 4,457 4,597 10,453 11,811 19,868 26,422Station buffer totals 77,094 91,694 250,247 303,889 572,737 706,349Countywide 1,362,948 1,724,585 1,362,948 1,724,585 1,362,948 1,724,585Percent of county totals 5.7% 5.3% 18.4% 17.6% 42.0% 41.0%Source: Parsons645188AA-099As noted in Table 8-6, access to higher paying jobs in Santa Clara County is important for MontereyCounty residents. The average wage of all private workers in Santa Clara County is nearly twice thatof jobs located in Monterey County. The average wage of high tech workers in Santa Clara County is238% higher than the average wage paid by Monterey County employers.Growth Inducement/Economic Development PotentialGrowth inducement is defined by the California Environmental Quality Act (CEQA) Guidelines as thefostering of economic or population growth, or the construction of new housing. Growth inducementmay result from direct employment, population, or housing growth; secondary or indirect growth; orprovision of new infrastructure that removes obstacles to population growth.The project is located in both urban and rural areas, surrounded by commercial development orfarmland and county parcels. With the development of the proposed station facilities, construction ofa new commuter rail or express bus passenger transportation infrastructure would directly fostereconomic and population growth. The project could help to accommodate the population projected inthe City of Salinas and Monterey County General Plan, who reside in these areas but workelsewhere, by providing efficient public transportation options.The proposed project could have an indirect affect on the local population near the proposed stations.Beneficial impacts to community cohesion and quality of life would also occur for residents andbusinesses near the proposed rail stations or park-and-ride facilities. Residential property valuescould potentially increase slightly near transit stations. Higher density housing and mixed usedevelopments would most likely occur near rail stations, which could provide additional affordablehousing units to the communities.parsons CHAPTER 8: EVALUATION OF ALTERNATIVES 210
CALTRAIN EXTENSION TO MONTEREY COUNTYALTERNATIVES ANALYSISEmployment growth at the proposed station sites would result mostly from a redistribution of existingemployment. Access to regional jobs and educational and entertainment opportunities would increasefor residents living near proposed stations, including environmental justice populations. As notedabove, under employment served, the proposed project will provide access to higher paying jobs inSanta Clara County/Silicon Valley, as well as jobs located in San Mateo and San Francisco counties.Currently, there is no reasonably priced public transportation between Monterey County and the SanFrancisco Bay Area. In addition to jobs, educational opportunities which provide entry level access tothese higher paying jobs will be accessible by the proposed Caltrain <strong>Extension</strong> and Express Busalternatives.Higher wages earned by Monterey County residents in the San Francisco Bay Area will likely createsecondary employment opportunities located within the Monterey Bay region.FUNDING AVAILABILITYTAMC is the local agency that distributes state and federal money for local and regional transportationprojects in Monterey County. TAMC is responsible for administering specific funding programscreated under the Intermodal Surface <strong>Transportation</strong> Efficiency Act (ISTEA) of 1991. These fundingprograms have been continued under the <strong>Transportation</strong> Equity Act of the 21st Century and the SafeAccountable Flexible Efficient <strong>Transportation</strong> Equity Act (SAFETEA of 2003: A Legacy for Users).TAMC is responsible for distributing money for public transit, rail, local and street and road maintenance,highway, bicycle and pedestrian facilities.Table 8-40 lists the proposed capital budget for the Caltrain <strong>Extension</strong> to Monterey County project.The total estimated project cost is $99.5 million, expressed in year-of-expenditure dollars, divided as$10.4 million for the Salinas MST bus facility and $89.0 million for the rail project, including a layoverfacility and commuter parking in Salinas, a platform and parking in Castroville, a platform and parkingin Pajaro, and main line UPRR track upgrades in Gilroy and between Gilroy and Salinas. This budgetamount does not include an allowance for the purchase of Caltrain rolling stock, as sufficientpassenger capacity exists to implement both the two train and four train scenarios without need foradditional passenger coaches.Funding for the Caltrain <strong>Extension</strong> project includes the state Traffic Congestion Relief Program, theProposition 116 rail bond funds, State <strong>Transportation</strong> Improvement Program–Public <strong>Transportation</strong>Account funds, Regional Surface <strong>Transportation</strong> Program-Interest, a federal earmark, CongestionMitigation and Air Quality Improvement funding, and contributions by local partner agencies. Aproposed application for Federal Transit Administration New Starts funding in the amount of $45million fills the gap between the available funding and the estimated total project cost.These fund sources and amounts are preliminary and are subject to change.Insofar as funds required to meet net public operating costs (i.e., subsidize transit operations andmaintenance expense), three sources of funding are anticipated. These are Local <strong>Transportation</strong>Funds, State Transit Assistance funds, and local sales tax funds. 1616A local transportation sales tax is proposed as a November 2008 ballot initiative.parsons CHAPTER 8: EVALUATION OF ALTERNATIVES 211
CALTRAIN EXTENSION TO MONTEREY COUNTYALTERNATIVES ANALYSISTable 8-40Proposed Capital Budget for Caltrain <strong>Extension</strong> to Monterey County ProjectTasksPrior Work & CurrentPhase: EnvironmentalReview, <strong>Alternatives</strong><strong>Analysis</strong>, New Starts,Conceptual DesignPreliminary engineering,PS&E/final design, UPRRsupport, force accountFiscalYears Phase Costs Funding SourcesIdentified FundsAvailable Secured Proposed Cumulative CostFederal Earmark $990,644 $990,644 $0P116 $352,187 $352,187 $0RSTPI $285,000 $285,000 $0TCRP $1,000,000 $1,000,000 $0Local $665,000 $665,000 $02003-07 $3,292,831 Total $3,292,831 $3,292,831 $0 $3,292,831Caltrain <strong>Extension</strong> – Next PhasesCMAQ $975,000 $975,000 $0P116 $580,000 $580,000 $0STIP $4,520,000 $4,520,000 $0TCRP $4,258,000 $4,258,000 $02007-08 $10,333,000 Total $10,333,000 $10,333,000 $0 $13,625,831ROWConstruction, constructionengineering &managementTCRP (Salinas station/platform/parking & layover facil $14,742,000 $14,742,000 $0Federal New Starts (Salinas bus; Castroville) $4,967,000 $0 $4,967,000RSTPI $30,000 $30,000 $02007-09 $19,739,000 Total $19,739,000 $14,772,000 $4,967,000 $33,364,831P116 $2,067,813 $2,067,813 $0Fed Bus Earmark $7,528,800 $0 $7,528,800Fed Bus local match $1,882,200 $0 $1,882,200Other Local Match $5,700,000 $0 $5,700,000SCCRTC/Watsonville (Pajaro) $10,000,000 $0 $10,000,000County (Castroville Undercrossing) $500,000 $500,000 $0Federal New Starts $40,033,200 $0 $40,033,2002008-10 $67,712,013 Total $67,712,013 $2,567,813 $65,144,200 $101,076,844TOTAL $101,076,844 $30,965,644 $70,111,200 $101,076,844Funding SourcesIdentified FundsAvailable Secured Proposed Grand TotalRSTPI $315,000 $315,000 $0 $315,000FED Earmark $990,644 $990,644 $0 $990,644CMAQ $975,000 $975,000 $0 $975,000Prop 116 $3,000,000 $3,000,000 $0 $3,000,000STIP $4,520,000 $4,520,000 $0 $4,520,000TCRP $20,000,000 $20,000,000 $0 $20,000,000Local contributions $16,865,000 $1,165,000 $15,700,000 $16,865,000* Budget numbers and timelines subject to change.MST Fed grant/local match $9,411,000 $0 $9,411,000 $9,411,000Federal New Starts $45,000,200 $0 $45,000,200 $45,000,200TOTAL REVENUES $101,076,844 $30,965,644 $70,111,200 $101,076,844The Final 2005 Monterey County Regional <strong>Transportation</strong> Plan (RTP) identifies the Caltraincommuterrail extension to Salinas as part of its planned new passenger rail services. The RTPstates, "TAMC plans to extend the existing Caltrain commuter rail service (between San Franciscoand Gilroy) south to Salinas. The extension will include three new station stops: Pajaro, Castroville,and Salinas. At its inception, the service would consist of two round trips per day running from Salinasto San Francisco and will be increased to four or more round trips as demand warrants, probablywithin 10 years from start of service."The RTP includes elements of the project in its overall Constrained Project List (Appendix D of the2005 Final RTP). Elements applicable to the proposed project are shown in Table 8-41.parsons CHAPTER 8: EVALUATION OF ALTERNATIVES 212
CALTRAIN EXTENSION TO MONTEREY COUNTYALTERNATIVES ANALYSISTable 8-41Regional <strong>Transportation</strong> Program Constrained Projects ListRTP ID Agency Title/DescriptionConstrainedFunding 1 (2005$)MYC018 County Castroville Boulevard Bike Path Connection under <strong>Rail</strong>road $ 750,000MST042 MST Salinas Intermodal Center—Construct New ITC $ 8,138,000TAM006 TAMC Castroville <strong>Rail</strong> Station $11,150,000 2TAM007 TAMC <strong>Commuter</strong> <strong>Rail</strong> Operations (operating costs to run two round trips per day, to increase to $64,900,000 3four trips within 10 yearsTAM009 TAMC <strong>Commuter</strong> <strong>Rail</strong> Track Access/Track Improvements between Gilroy and Salinas $ 5,000,000TAM012 TAMC Gilroy Yard Improvements $ 3,170,000TAM016 TAMC Pajaro <strong>Rail</strong> Station $ 6,565,000TAM024 TAMC Salinas Station $31,577,000Source: <strong>Transportation</strong> Agency for Monterey County, Appendix D of the Monterey County Regional <strong>Transportation</strong> Plan, 2005b (Final)1 Funding occurs in present–2010 unless otherwise noted2 $5,250,000 in present–2010; $5,900,000 in 2011–20203 $5,900,000 in present–2010; $29,500,000 in 2011–2020; $29,500,000 in 2021–2030SELECTION OF THE LOCALLY PREFERRED ALTERNATIVEBased on the array of technical information, evaluation findings and public input, a key outcome ofthe detailed <strong>Alternatives</strong> <strong>Analysis</strong> is the selection of a preferred long-term strategy for the corridor.The long-term strategy is defined as investments required to address the 2030 planning horizon. As asubcomponent of the locally preferred alternative, a reduced scope alternative is defined to addressnear term, opening year needs. This reduced scope alternative is known as the “minimum operatingsegment.”The minimum operating segment must address the purpose and need for the project within thecontext of near-term demographic and travel conditions. For the purpose of this study, the near-termminimum operating segment is defined for 2010 conditions.For the purpose of evaluating project worthiness, the Federal Transit Administration requires thatproject applicants for federal “New Starts” discretionary funding also provide comparative informationon a TSM or “best bus” alternative. For this reason, performance characteristics of a “baseline” alternativehave been included in this study along with those of the Caltrain <strong>Extension</strong> Alternative and theminimum operating segment of the Caltrain <strong>Extension</strong> Alternative.The results of this <strong>Alternatives</strong> <strong>Analysis</strong> study, ongoing from 2002 through 2007, indicate that theCaltrain <strong>Extension</strong> to Monterey County is the most cost effective alternative for serving intercountycommuters to Silicon Valley and providing access to educational and health careresources in the San Francisco Bay Area. Selection of this option will meet the purpose and needof the proposed investment by providing additional transportation capacity in the U.S. 101 travelcorridor. Further, selection of the Caltrain <strong>Extension</strong> modal option can increase capacity over andabove that defined for the Caltrain <strong>Extension</strong> Alternative by increasing the length of the trains (addingmore cars) and/or increasing the number of trains operated.There is strong local support for the proposed service extension due to the projected populationgrowth in the Monterey Bay Area and the increasing numbers of San Francisco Bay Area workerswho are making their homes in San Benito, Santa Cruz, and Monterey counties. A multi-agency taskforce comprised of the Santa Clara Valley <strong>Transportation</strong> Authority, <strong>Transportation</strong> Agency forparsons CHAPTER 8: EVALUATION OF ALTERNATIVES 213
CALTRAIN EXTENSION TO MONTEREY COUNTYALTERNATIVES ANALYSISMonterey County, Association of Monterey Bay Area Governments, MST, Caltrans, Santa CruzCounty Regional <strong>Transportation</strong> Commission, San Benito County, and the cities of Salinas andWatsonville has been meeting to discuss and plan the initial steps to creating this train serviceextension. This project is an outgrowth of their multi-agency coordination.Local and regional agencies representing the study area or portions thereof have conducted studiesthat serve as precursors or complements to this selection of a locally preferred alternative. Theproject has been coordinated with the Union Pacific <strong>Rail</strong>road, the Peninsula Corridor Joint PowersBoard, Caltrans, the Santa Clara Valley <strong>Transportation</strong> Authority, the City of Salinas, the RedevelopmentAgency of Monterey County, Monterey–Salinas Transit, the City of Watsonville, the Santa CruzCounty Regional <strong>Transportation</strong> Commission, and the Santa Cruz Metropolitan Transit District.In 1992, Passenger <strong>Rail</strong> Feasibility Study No. 05D423 was prepared for Caltrans to address the feasibilityof passenger rail service between San Francisco, Monterey, Salinas, and Hollister. The studyindicated that commuter rail could feasibly serve the existing market for work trips between Salinasand the Silicon Valley.A locally preferred alternative was adopted in the 1994 Monterey County Regional <strong>Transportation</strong>Plan. This included the extension of one Caltrain commute train. The 2002 and 2005 Regional <strong>Transportation</strong>Plans cite growing traffic congestion between Monterey County and the San Francisco BayArea and the demand for commuter rail services in the U.S. 101 Corridor. The 2005 Regional <strong>Transportation</strong>Plan includes the extension of Caltrain to Salinas in its list of planned projects.In 1997, the City of Watsonville prepared a Draft Pajaro Valley Station Project Study Report, in cooperationwith Monterey County, TAMC and the Santa Cruz County Regional <strong>Transportation</strong> Commission.While not finalized, this Draft project study report identified a potential site location and set ofprogram requirements for this station.Between 1998 and 2000, these program requirements and opportunities for adjacent site developmentwere further refined and explored by the Monterey County sponsored Pajaro <strong>Rail</strong>yards AreaFeasibility Study. This study, as well as the draft project study report, sited the Pajaro Valley stationadjacent to the former Southern Pacific Passenger Depot which is accessed from Salinas Road.In 2000, TAMC sponsored the preparation of the <strong>Extension</strong> of Caltrain <strong>Commuter</strong> Service toMonterey County Business Plan. The business plan considered, but did not thoroughly evaluate,alternative sites for stations at Pajaro and Castroville and a layover yard in Salinas.Caltrans’ <strong>Transportation</strong> Concept Report for U.S. 101 in Caltrans District 5 (2001) recommends thatdemand be reduced on U.S. 101 in Monterey and San Benito counties by encouraging and improvingalternative modes such as passenger rail, including the extension of Caltrain service from Gilroy toSalinas.With funding supplied by TAMC, Santa Clara Valley <strong>Transportation</strong> Authority, and others, UPRR hasundertaken a train simulation “capacity study” of potential freight and passenger rail operations innorthern California. Based on the results of this study, UPRR has identified track, switch, andsignaling improvements that may be required to implement additional passenger rail service toMonterey County. These have been documented by a "Term Sheet," dated June 26, 2003. Additionaltrack and signaling improvements have been identified in the California Passenger <strong>Rail</strong> System Five-Year Improvement Plan.parsons CHAPTER 8: EVALUATION OF ALTERNATIVES 214
CALTRAIN EXTENSION TO MONTEREY COUNTYALTERNATIVES ANALYSISThe Peninsula Corridor Joint Powers Board includes the Caltrain extension to Salinas in the Caltrain2004–2023 Strategic Plan along with route extensions to downtown San Francisco and across theDumbarton Bridge to the East Bay. Each of these extensions are currently undergoing design and/orenvironmental study. Additionally, a project development team of Monterey and Santa Cruz Countylocal government representatives has been meeting since September 2000 to refine station programand transportation requirements and resolve station site issues.The Monterey County General Bikeways Plan (2001) includes a proposed Class I Bikeway alongCastroville Boulevard and underneath the UPRR rail line in the vicinity of the proposed Castrovillestation. This trail will provide connectivity between the Castroville central business district, the highschool to the east, and the station area.The City of Salinas has been actively working since 1996 to develop the Intermodal <strong>Transportation</strong>Center on the site of the Amtrak passenger station. In 1999, the city’s Redevelopment Agencyacquired 3.5 acres of land housing the station from UPRR. Beginning in June 1996, the city consideredvarious land acquisition strategies and conceptual plans for transportation center development.In June 1998, a site plan was finalized. The city subsequently constructed the Amtrak facility thatexists today.Specific ongoing efforts include the City of Salinas’ plans for intensified transit-oriented developmentnear the Salinas station site, Caltrans’ plans for upgrading SR 156 east of Castroville Boulevard, theCastroville Community Plan, the Pajaro Community Plan, UPRR’s short- and long-term plans forfreight and yard operations, and the California Passenger <strong>Rail</strong> System Five-Year Improvement Plan.Formal cooperation agreements have been established between TAMC, the Monterey County RedevelopmentAgency and the City of Salinas (<strong>Rail</strong> Planning Funds Cooperation Agreement, dated February7, 2002, amended September 13, 2002) and between TAMC and MST (Agreement for FundingStudy of the Relocation of the Salinas Transit Center to the Salinas Intermodal Center as a Part ofthe Caltrain <strong>Extension</strong> Project, dated December 12, 2002).Negotiations are ongoing between TAMC and the Peninsula Corridor Joint Powers Board regardingrevenue and cost sharing. In addition, a purchase-of-service agreement will stipulate TAMC/PeninsulaCorridor Joint Powers Board rights and powers, financial commitments, service parameters, anddetails of administrative procedures.Discussions between TAMC and UPRR are also ongoing regarding main line track and signalingimprovements. TAMC has met with UPRR to develop a trackage rights agreement for the extensionof Caltrain from Gilroy to Salinas. On June 26, 2003 UPRR presented TAMC with a draft “Term SheetConditions for Salinas-Gilroy Passenger Service.” This term sheet outlines operating parameters,capacity/track improvements, compensation, liability/insurance, and other terms for the minimumoperating segment, subject to further discussions and negotiations during project delivery.Based on a detailed definition of the Caltrain <strong>Extension</strong> Alternative contained in the Caltrain<strong>Extension</strong> to Monterey County Project Study Report, dated February 21, 2006, a draft CaliforniaEnvironmental Quality Act Environmental Impact Report was prepared and circulated for publiccomment on April 26, 2006. The public review period for the Draft Environmental Impact Reportended on June 16, 2006, and a Final Environmental Impact Report was subsequently published onJuly 26, 2006. The TAMC Board of Directors certified the Final Environmental Impact Report onAugust 23, 2006.parsons CHAPTER 8: EVALUATION OF ALTERNATIVES 215
CALTRAIN EXTENSION TO MONTEREY COUNTYALTERNATIVES ANALYSISAs noted above, the minimum operating segment is the service and facilities defined in this <strong>Alternatives</strong><strong>Analysis</strong> for the 2010 timeframe. Three stations would initially be constructed as proposed forthe full Caltrain <strong>Extension</strong> Alternative. Parking supplies would be reduced, however, commensuratewith ridership expectations for the 2010–2015 initial five years of service operation. Other aspects ofthe minimum operating segment would be as defined for the full Caltrain <strong>Extension</strong> Alternative.parsons CHAPTER 8: EVALUATION OF ALTERNATIVES 216
CALTRAIN EXTENSION TO MONTEREY COUNTYALTERNATIVES ANALYSISCHAPTER 9: SUMMARYAn <strong>Alternatives</strong> <strong>Analysis</strong> study evaluates appropriate modal and alignment options for addressingmobility options in a given corridor. The study provides information to local officials on the benefits,costs, and impcats of alternative transportation investments developed to address the purpose andneed for an improvement in a corridor. An <strong>Alternatives</strong> <strong>Analysis</strong> study is required for a project toqualify for federal Section 5309 New Starts capital funding. The study is complete when a locallypreferred alternative (LPA) is selected by local and regional decision makers.PURPOSE AND NEEDThe U.S. 101 Corridor is heavily congested in the San Francisco Bay Area and portions of MontereyCounty. Caltrain commuter rail service currently extends from San Francisco in the north to Gilroy inthe south. The proposed Caltrain <strong>Extension</strong> to Monterey County project would extend Caltraincommuter rail service from its existing terminus in Gilroy to Monterey County, including stations inPajaro, Castroville, and Salinas. Figure 9-1 illustrates the Caltrain <strong>Extension</strong> to Monterey Countyproject area along with the proposed station locations.The proposed extension of Caltrain to Salinas would provide an alternative means of travel betweenthese counties, significantly reducing congestion along U.S. 101 into Santa Clara, San Mateo, andSan Francisco counties, and improving regional air quality. In addition, the proposed rail service is acost effective alternative to widening U.S. 101.In addition to lowering congestion on the roadways, the commuter rail extension would bring asignificant increase in ridership to the existing Caltrain and the connecting Capitol Corridor services.Other benefits to this new service include an increase in job opportunities, more transportationalternatives for senior citizens and those with physical disabilities, and increased access toeducational and health care resources in the San Francisco Bay Area.Currently, job distribution and worker housing distribution patterns do not match in the MontereyCounty and San Francisco Bay areas. The northern counties of San Francisco and Santa Clara havelarge job surpluses, requiring approximately 117,000 non-San Francisco Bay Area residents to fill theavailable positions as of 2000 (Metropolitan <strong>Transportation</strong> Commission). This pull of workersgenerates a large volume of inter-regional commuter traffic, leading to highway congestion and poorair quality in the basin.The U.S. Census for 2000 estimates that 18,073 persons living in Monterey County work in anothercounty. Of this number, more than 30 percent are employed within Santa Clara County or other BayArea counties. Available public transportation choices between Monterey County and Santa ClaraCounty are limited to three northbound bus trips during the AM commute period and two southboundbus trips during the afternoon commute period. These buses are subject to traffic delays on U.S. 101and SR 156.parsons CHAPTER 9: SUMMARY 217
CALTRAIN EXTENSION TO MONTEREY COUNTYALTERNATIVES ANALYSISFigure 9-1Caltrain <strong>Extension</strong> to Monterey County Project Study Areaparsons CHAPTER 9: SUMMARY 218
CALTRAIN EXTENSION TO MONTEREY COUNTYALTERNATIVES ANALYSISALTERNATIVES ANALYSIS STUDY PROCESSThe proposed project is the outgrowth of a detailed analysis of alternatives conducted over a periodof five years (2002–2007). The process followed by the alternatives analysis is consistent withguidance provided by the Federal Transit Administration and is shown graphically below. This studyidentified unmet intra-county travel needs within Monterey County and inter-county travel needsbetween Monterey and southern Santa Cruz counties and the San Francisco Bay Area. To addressthese travel markets, eight alternatives were identified as depicted in Figure 9-3. These alternativeswere conceptually defined as insofar as fixed guideway alignments, station locations, servicecharacteristics and capital costs.Figure 9-2Locally Preferred Alternative Selection ProcessUniverse of <strong>Alternatives</strong>Initial ScreeningConceptual <strong>Alternatives</strong>Secondary EvaluationDetailed <strong>Alternatives</strong>Detailed <strong>Analysis</strong>FinalAlternative (locally preferredalternative)EVALUATION OF CONCEPTUAL ALTERNATIVESAs a result of the public involvement and policy review process, four alternatives emerged for furtherrefinement and testing. These four alternatives, labeled A through D, are listed below:A. Caltrain to Salinas <strong>Rail</strong> Service (four roundtrips on weekdays) and Intracounty BRT (busrapid transit) Service (Monterey to Castroville and Marina to Salinas).B. Intracounty BRT/LRT (light rail transit) Service (BRT from Monterey to north Marina andMarina to Salinas, LRT from Monterey to Castroville), Monterey Peninsula to San FranciscoIntercity <strong>Rail</strong> Service (Monterey to San Francisco) and Caltrain to Salinas <strong>Rail</strong> Service(<strong>Commuter</strong> <strong>Rail</strong>).C. Intracounty LRT Service (local LRT from Monterey to north Marina, LRT extension fromNorth Marina to Castroville and Castroville to Salinas), Monterey Peninsula to San FranciscoIntercity <strong>Rail</strong> Service (passenger rail from Monterey to San Francisco) and Caltrain toSalinas <strong>Rail</strong> Service.D. Express Bus Service to San Francisco Peninsula (between Monterey County Transit Centersand Santa Clara, San Mateo and San Francisco County Caltrain Station Sets) and EnhancedLocal Bus Service (Monterey to Marina and Marina to Salinas).parsons CHAPTER 9: SUMMARY 219
CALTRAIN EXTENSION TO MONTEREY COUNTYALTERNATIVES ANALYSISFigure 9-3Preliminary <strong>Alternatives</strong>• Caltrain• Intercity <strong>Rail</strong>• Regional Express Bus• Caltrain• Intercity <strong>Rail</strong>• Local LRT• Local BRT• Enhanced Local Bus• Regional Express Bus• Caltrain• Local LRT• Regional Express Bus• Local BRT• Enhanced Busparsons CHAPTER 9: SUMMARY 220
CALTRAIN EXTENSION TO MONTEREY COUNTYALTERNATIVES ANALYSISCommon to all Build <strong>Alternatives</strong> (A–C) was the extension of Caltrain service to MontereyCounty. This commonality reflects the conscious decision on the part of the <strong>Transportation</strong>Agency for Monterey County (TAMC) <strong>Rail</strong> Policy Committee to exclude from further considerationany Build Alternative which did not include the extension of Caltrain service to Salinas.DETAILED DEFINITION OF ALTERNATIVESFollowing the shortlisting of conceptual alternatives for further refinement and evaluation, the <strong>Alternatives</strong><strong>Analysis</strong> study was divided into two projects; one serving intra-county needs and one servinginter-county (Monterey to San Francisco Bay Area) needs. This <strong>Alternatives</strong> <strong>Analysis</strong> documentaddresses the inter-county commute market alternatives.Two alternatives were defined to address this travel market. These are labeled the Caltrain <strong>Extension</strong>to Salinas Alternative (the build alternative) and Express Bus Alternative (<strong>Transportation</strong> SystemManagement (TSM) alternative).In addition to the Caltrain <strong>Extension</strong> Alternative and the Express Bus Alternative, five additionalalternatives were considered, but rejected for the U.S. 101 Corridor. These included:• Shuttle bus service to Gilroy• Limited stop bus service to San Jose• Shuttle train service to Gilroy• Independent train service to San Francisco• Bus rapid transit serviceThese alternatives were rejected as not being sufficiently attractive to capture ridership or not beingcost effective.Caltrain <strong>Extension</strong> AlternativeThe proposed project consists of four elements: commuter rail station construction at the communitiesof Pajaro and Castroville; renovations/expansions of an existing passenger rail station andconstruction of a new parking facility at Salinas; and construction of a commuter rail layover facility atSalinas. Improvements to the Union Pacific <strong>Rail</strong>road (UPRR) Coast main line between Gilroy andSalinas and institutional arrangements required for construction and operation of commuter railservice between Gilroy and Salinas are also part of the Caltrain <strong>Extension</strong> Alternative.Under the Caltrain <strong>Extension</strong> Alternative, existing Caltrain service to Gilroy would be extended toSalinas. Initially, two round trip trains would be operated on weekdays. As ridership warrants, servicewould be expanded to three round trips. As Caltrain service is restored to Gilroy (four round trips) andeventually expanded, service would be extended to Salinas as demand warrants. Trainsets would layover in Salinas in lieu of Gilroy. A Salinas layover yard would be constructed with capacity for fourtrainsets, but would be designed to expand to accommodate six trainsets.Weekday boardings at Monterey County Stations (AM northbound) are forecast at 1,028 riders perday, based on Year 2000 commuting patterns. In the afternoon, an equal number of riders wouldparsons CHAPTER 9: SUMMARY 221
CALTRAIN EXTENSION TO MONTEREY COUNTYALTERNATIVES ANALYSISboard at San Francisco Bay Area stations and ride south to Monterey County. These commutingpatterns appear to hold true as of 2005/2006, and are assumed for 2010 opening year conditions.Year 2030 boardings are forecast as 2,056 riders per day traveling in each direction (4,000passenger trips).The physical components of the Caltrain <strong>Extension</strong> Alternative are described and detailed in theCaltrain <strong>Extension</strong> to Monterey County Project Study Report, dated February 21, 2006. The projectstudy report is a “Project Initiation Document” which provides sufficient project detail and costestimates to allow a project to be included in the State <strong>Transportation</strong> Improvement Program at thediscretion of the California <strong>Transportation</strong> Commission. The Caltrain <strong>Extension</strong> to MontereyCounty Project Study Report is included with this <strong>Alternatives</strong> <strong>Analysis</strong> by reference as thephysical definition of the Caltrain <strong>Extension</strong> Alternative. See Table 9-1 for the Caltrain <strong>Extension</strong>Alternative capital cost estimates expressed in FY 2007 and year of expenditure (YOE) dollars.Table 9-1 identifies a cost allowance of $8.8 million for vehicles. This rolling stock is not required toaccommodate peak passenger loads, and is included as a risk element for comparison with theExpress Bus Alternative. This potential cost is not reflected in the year of expenditure funding plan.Table 9-1Caltrain <strong>Extension</strong> Alternative Capital Cost Estimate ($1,000 FY 2007)Work DescriptionUPRRMainLineGilroyYardPajaroStationCastrovilleStationSalinasStationSalinasBusSalinasYard2007TotalsYOETotalsParking and access — — $ 1,805 $ 2,085 $ 2,244 $1,526 — $7,660 $8,426Pedestrian structures — — — 900 — — — 900 990Platform and station— — 1,602 1,953 2,555 1,298 — 7,408 8,149amenitiesTrack and signal5,000 2,088 3,937 3,251 1,103 — 3,718 19,097 20,099improvementsSpecialty items — — 179 — 227 — 202 608 669Mobilization — 209 753 729 613 282 392 2,978 3,276Contingencies — 804 2,897 3,122 2,360 1,087 1,509 11,779 12,957Construction Total $5,000 $3,101 $11,173 $12,040 $ 9,102 $4,193 $5,821 $50,430 $54,566Soft cost — 1,023 3,687 3,973 3,004 1,384 1,921 14,992 15,756Right-of-way — — 2,170 430 7,750 4,250 4,000 18,600 19,346Subtotal $5,000 $4,124 $17,030 $16,443 $19,856 $9,827 $11,742 $84,022 $89,668Vehicles (risk element) — — — — — — — 8,800 9,616Unallocated contingency 9,282 9,871Total $5,000 $4,124 $17,030 $16,443 $19,856 $9,827 $11,742 $102,104 $109,155Express Bus AlternativeIn the Caltrain <strong>Extension</strong> to Monterey County project, the Express Bus Alternative entails express busservice from Salinas to the San Francisco Bay Area. This alternative would attempt to provideequivalent travel time savings, comfort and convenience for transit users as compared with theCaltrain <strong>Extension</strong> Alternative. Monterey–Salinas Transit (MST) express bus service would beparsons CHAPTER 9: SUMMARY 222
CALTRAIN EXTENSION TO MONTEREY COUNTYALTERNATIVES ANALYSISestablished as part of this alternative and would operate from four Monterey County Transit Centersto the San Francisco Bay Area. An MST Transit Center/Park-n-Ride facility would be constructed atEighth Street in Marina as part of the University Villages redevelopment of Fort Ord. Additional transitcenters with park-and-ride facilities would be located in Salinas, Castroville, and Pajaro with expressbus service operating via existing surface roadways to Santa Clara and San Mateo counties,including non-stop service to selected stations.The Express Bus Alternative also includes the construction of park-and-ride facilities to supportexpress bus operations at comparable Caltrain <strong>Extension</strong> Alternative rail station locations. These willinclude Salinas, Castroville, Pajaro/Watsonville, and Marina (Fort Ord). High-speed transmission,over the road, 40-foot coaches would be acquired for this service with a capacity of 45 to 49passengers per vehicle. Twenty-five vehicles (plus five spares) would be required to operate theservice in the near term—carrying 1,028 commuters to the San Francisco Bay Area each weekday.Of these, 21 vehicles would operate to/from Santa Clara County and four vehicles would operateto/from San Mateo and San Francisco counties. This is equivalent to two Caltrain trips extended fromGilroy to Salinas. Longer term, a fleet of 60 motor coaches (50 vehicles in revenue service plus 10spares) would be required to accommodate the four Caltrain each way ridership scenario. The samefare structure as proposed for the Caltrain <strong>Extension</strong> Alternative is assumed for the Express BusAlternative. All fare revenues will be used to offset operating and maintenance expenses. Table 9-2outlines the Express Bus Alternative capital cost estimates.Table 9-2Express Bus Alternative Capital Cost Estimate ($1,000 FY 2007)Work DescriptionPajaroPark-and-RideCastrovilleParkand-RideSalinasStationSalinasBusSalinasPark-and-RideMarinaBusMarinaParkand-Ride2007TotalsYOETotalsParking and access $2,227 $1,426 — $1,215 $ 8,888 $ 485 $1,390 $15,631 $17,194Pedestrian structures — 900 — — — — — 900 990Platform and station amenities 576 453 2,301 1,298 — 1,204 — 5,832 6,415Track and signal improvements — 605 316 — — — — 921 1,013Specialty items 50 100 75 50 — — — 275 303Mobilization 285 349 269 256 889 169 139 2,356 2,592Contingencies 1,098 1,341 1,036 987 1,955 650 535 7,602 8,362Construction Total $4,236 $5,174 $3,997 $3,806 $11,732 $2,508 $2,064 $33,517 36,271Soft cost 1,398 1,707 1,319 1,256 4,106 702 681 11,169 11,741Right-of-way 2,170 409 — 4,250 1,650 74 2,622 11,175 11,593Subtotal $7,804 $7,290 $5,316 $9,312 $17,488 $3,284 $5,367 $55,861 59,605Vehicles — — — — — — — 30,000 36,383Maintenance facility — — — — — — — 6,000 6,493Unallocated contingency — — — — — — — 4,593 4,866Total $7,804 $7,290 $5,316 $9,312 $17,488 $3,284 $5,367 $96,454 $107,347parsons CHAPTER 9: SUMMARY 223
CALTRAIN EXTENSION TO MONTEREY COUNTYALTERNATIVES ANALYSISDETAILED EVALUATION OF ALTERNATIVESThe <strong>Alternatives</strong> <strong>Analysis</strong> study prepared a detailed evaluation of how well each alternative/alignmentoption can meet the goals and objectives established for the project:• Improve mobility• Improve the environment• Optimize transit operating efficiencies• Provide a cost-effective solution• Support local land use plans and respond to growthThe evaluation methodology was designed to ensure that both local priorities and Federal TransitAdministration criteria are met. Table 9-3 shows some of the key results of the evaluation. Theseresults compare the Caltrain <strong>Extension</strong> Alternative and the Express Bus Alternative for the selectedevaluation criteria, including cost and various user benefits. The benefits monetized in Table 3 areexpressed as positive dollars, while costs are expressed as (negative) dollars. Table 9-3demonstrates that the benefits of the Caltrain <strong>Extension</strong> Alternative exceed the benefits of theExpress Bus Alternative in both 2010 and 2030.Table 9-3Summary of Caltrain <strong>Extension</strong> and Express Bus Alternative Benefits2010 2030Benefit Type Caltrain Express Bus Caltrain Express BusUser BenefitsIn-vehicle travel time (Method 3) $ 252,032 $ 252,032 $ 6,985,931 $ 4,160,454Fuel costs 4,499,622 4,499,622 8,631,039 8,631,039Non-fuel operating savings 1,925,316 1,925,316 3,693,083 3,693,083Transit user fees (3,310,612) (3,310,612) (6,320,790) (6,320,790)Internal accident costs or savings—Highway 3,144,040 3,144,040 6,027,934 6,027,934Transit (150,545) (893,907) (304,004) (1,698,612)Revenue Transfers (fuel taxes) (893,915) (893,915) (1,714,681) (1,714,681)Reduction in External CostsEmissions 14,361 (105,368) (136,415) (381,210)Highway accidents 554,830 554,830 1,063,753 1,063,753Transit accidents (14,406) (148,306) (28,744) (284,432)Net Public Operating Costs (1,175,068) (5,256,095) (2,393,619) (10,812,623)Total $4,845,655 ($232,363) $15,503,487 $2,363,915The evaluation of the Caltrain <strong>Extension</strong> and Express Bus alternatives assumed equal ridership forboth the commuter rail and express bus modes. For this reason, most of the user benefits identifiedabove are equal between the Caltrain and Express bus options. By the Year 2030, in-vehicle traveltime for the Express Bus Alternative will be longer due to increased roadway congestion; however, forthe most part benefits are the same or similar between the two modal options. One significantdifference is “Net Public Operating Costs,” which is the difference between total operations and maintenanceexpense and fare revenues (transit user fees) paid to ride the service. Operation of a largebus fleet with limited seating capacity between Monterey County and San Francisco Peninsulastations is far more expensive than the incremental cost of extending Caltrain service 37 miles fromGilroy to Salinas.parsons CHAPTER 9: SUMMARY 224
CALTRAIN EXTENSION TO MONTEREY COUNTYALTERNATIVES ANALYSISThis analysis includes estimates of user benefits including travel time savings, reductions in out-ofpockettravel expenses, and reduced accident costs. Estimates of revenue transfers (reduced publictax revenue collections) are included in the analysis. The economic analysis also measures externalcosts such as the health cost of motor vehicle emissions and accident costs which are not perceivedby users.The Caltrain <strong>Extension</strong> and Express Bus alternatives are assumed to be implemented by 2010, withthe initiation of service occurring in 2011. An analysis of life-cycle benefits and costs indicates thatthe Caltrain <strong>Extension</strong> Alternative will have a higher benefit-cost ratio than the Express Bus Alternativeover a 20-year, 2011 to 2030 payback period, as indicated in Table 9-4. Higher operating costsand the need to replace express bus vehicles more frequently result in less favorable performance forthe Express Bus Alternative compared to the Caltrain <strong>Extension</strong> Alternative. The payback period isthe amount of time measured in years to recover the life cycle investments (capital and net publicoperating costs). The table shows that public investment in the Express Bus Alternative will never bepaid back.Table 9-4Summary of Benefit Cost <strong>Analysis</strong> ResultsCaltrain <strong>Extension</strong>Express BusLife cycle benefits/total costs ratio $203 M/$102 M = 1.99 $21 M/$116 M = 0.18Net present value of benefits/costs at 7% discount rate $77 M/$88 M = 0.88 $7 M/$84 M = 0.08Payback period at 7% discount rate 23.5 years Not paid back*The payback period is the amount of time measured in years to recover the life cycle investments (capital and net public operatingcosts). The table shows that public investment in the Express Bus Alternative will never be paid back.Selection of a locally preferred alternative is seldom based on cost/benefit information alone. For thisreason, social or societal performance indicators have been included to address key issues of projectfeasibility.FREQUENTLY ASKED QUESTIONS1. Will the fixed guideway investment attract sufficient ridership to be worthy of theinvestment?The Caltrain <strong>Extension</strong> Alternative and Express Bus Alternative are forecast to attract approximately1,028 riders each direction (2,056 riders per day) as of 2010, and twice this number by2030. Spread over a two-hour commute window, this ridership would be equivalent to approximatelyone-quarter of one freeway lane times 74.2 miles (equal to 18.5 lane miles) in 2010,and one-half of one freeway lane times 74.2 miles (equal to 37 lane miles) in 2030. Bothtransit alternatives would be capable of carrying additional riders as demand warrants, and couldtherefore provide additional freeway equivalent capacity to the U.S. 101 Corridor over and abovethese levels. When compared to the cost of constructing equivalent freeway capacity (at $5million per lane mile for freeway construction), the proposed transit fixed guidewayinvestment will pay for itself in one year.When compared to other transit investments, the Monterey County Caltrain <strong>Extension</strong>/ExpressBus <strong>Alternatives</strong> perform very well from a passenger miles traveled perspective. Table 9-5indicates that Monterey County’s 2,056 daily riders (2010 ridership), for example, is equivalent tomore than 12,000 BART (Bay Area Rapid Transit) riders.parsons CHAPTER 9: SUMMARY 225
CALTRAIN EXTENSION TO MONTEREY COUNTYALTERNATIVES ANALYSISTable 9-5Daily Caltrain <strong>Extension</strong> Transit Rider Equivalents Based on Trip Length (2004)Average Trip Trip Length Daily RiderMode/ServiceLength (miles) Ratio* Equivalent†Monterey County Caltrain <strong>Extension</strong>/Express Bus (2010) 74.2 1 2,056National<strong>Commuter</strong> rail 23.5 3.16 6,497Heavy rail 5.2 14.27 29,339Light rail 4.5 16.49 33,903Bus 3.7 20.05 41,223San Francisco Bay AreaCaltrain Peninsula Corridor Joint Powers Board (JPB) 20.07 3.70 7,607Altamont <strong>Commuter</strong> Express (ACE) 47.92 1.55 3,187Bay Area Rapid Transit (BART) 12.59 5.89 12,110Santa Clara Valley <strong>Transportation</strong> Authority (VTA) 4.42 16.79 34,520Source: 2004 National Transit Database, Parsons*Trip Length Ratio = Monterey County Average Trip Length ÷ Average Trip Length†Daily Rider Equivalent = Trip Length Ratio × Monterey County Daily Rider Equivalent2. Is the proposed fixed guideway investment cost effective?The benefit-cost analysis summarized above indicates that the Caltrain <strong>Extension</strong> Alternative iscost effective and yields life cycle benefits which nearly equal costs. The Express Bus Alternativeis one-tenth as cost effective. Table 9-6 compares ridership with annualized capital costs,operations and maintenance costs, and net public (subsidy) costs. Relative to other (national)transit fixed guideway investments, both the Caltrain <strong>Extension</strong> and Express Bus alternativesare cost effective ($10.29 to $24.03 of public investment per rider).Table 9-6Capital and Operating Costs per Rider and per Passenger MileCaltrain <strong>Extension</strong> AlternativeExpress Bus AlternativeParameter 2010 2030 2010 2030Annual ridership 524,280 1,001,130 524,280 1,001,130Annual passenger miles 38,903,565 74,642,682 38,903,565 74,642,682Annualized capital cost ($ 2007) $7,150,000 $7,905,137 $7,337,476 $9,226,006Annualized capital cost per rider $13.64 $7.90 $14.00 $9.22Annualized capital cost per passenger mile $0.184 $0.106 $0.189 $0.124Annual O&M cost ($ 2007) $4,485,680 $8,714,409 $8,566,7071 $17,133,413O&M cost per rider $8.56 $8.70 $16.34 $17.11O&M cost per passenger mile $0.115 $0.117 $0.220 $0.230Annual fare revenue $3,310,612 $6,320,790 $3,310,612 $6,320,790Annual net public operating cost $1,175,068 $2,393,619 $5,256,095 $10,812,623Net public operating cost per rider $2.24 $2.39 $10.03 $10.80Net public operating cost per passenger mile $0.030 $0.032 $0.135 $0.1453. Will the proposed fixed guideway investment equitably serve Monterey County residents?The proposed Caltrain <strong>Extension</strong> and the Express Bus alternatives will provide Monterey Countyresidents with public transportation access to relatively high paying jobs, colleges and universi-parsons CHAPTER 9: SUMMARY 226
CALTRAIN EXTENSION TO MONTEREY COUNTYALTERNATIVES ANALYSISties, health care facilities, sports venues, national/international airports, recreational destinationsand shopping attractions in the San Francisco Bay Area.As of 2000, more than 233,000 residents of Monterey County and southern Santa Cruz Countylived within 4.5 miles of one of the three Caltrain <strong>Extension</strong> Alternative commuter rail stations.Based on the findings of the 2000 census, more than 50 percent of the population served is likelyto be of Hispanic/Latino background and nearly 50 percent of the population served is classifiedas being of low or moderate income. The average wage of all private workers in Santa ClaraCounty is nearly twice the average wage in Monterey County; while the average wage of hightech workers in Santa Clara County is nearly three and one-half times the average wage paid byMonterey County employers. Both the Caltrain <strong>Extension</strong> and Express Bus alternatives willprovide travel time competitive, affordable transit access to these higher paying jobs.4. Will the proposed fixed guideway investment generate economic benefits for MontereyCounty?Population and housing growth is forecast for the communities and neighborhoods surroundingthe proposed fixed guideway stations. Both the Caltrain <strong>Extension</strong> and Express Bus alternativescould help to accommodate this growth by providing efficient public transportation options.Beneficial impacts to community cohesion and quality of life would also occur for residents andbusinesses near the proposed rail stations or park-and-ride facilities. Residential property valuesare expected to increase slightly near transit stations. Higher density housing and mixed usedevelopments would most likely occur near rail stations, which could provide additional affordablehousing units to the communities. (See the response to question number 5 for more on transitorienteddevelopment.)Employment growth at the proposed station sites would result mostly from a redistribution ofexisting employment. Access to regional jobs and educational and entertainment opportunitieswould increase for residents living near proposed stations, including environmental justicepopulations. As noted above, the proposed project will provide access to higher paying jobs inSanta Clara County/Silicon Valley, as well as jobs in San Mateo and San Francisco counties.Currently, there is no reasonably priced public transportation between Monterey County and theSan Francisco Bay Area. In addition to jobs, educational opportunities which provide entry levelaccess to these higher paying jobs will be accessible by the proposed Caltrain <strong>Extension</strong> andExpress Bus alternatives.Higher wages earned by Monterey County residents working in the San Francisco Bay Area willlikely create secondary employment opportunities located within the Monterey Bay region.5. Will the proposed transit centers promote localized transit-oriented development?The <strong>Transportation</strong> Agency for Monterey County has adopted a set of guidelines for communitydevelopment that encourage the siting of higher density housing and mixed-use developmentsaround transit centers. Higher density housing near rail stations could provide additionalaffordable or workforce housing. The Agency will partner with jurisdictions to promote transitorienteddevelopment around transit centers. The <strong>Transportation</strong> Agency also administers the<strong>Transportation</strong> for Livable Communities Transit-Oriented Development incentive grant program,which rewards jurisdictions who approve such developments with funds for transportationprojects. Encouraging this kind of growth around transit maximizes the investment in thetransportation networks by promoting transit use and infill development in walkable areas, therebyincreasing living and transportation choices while reducing reliance on automobiles.parsons CHAPTER 9: SUMMARY 227
CALTRAIN EXTENSION TO MONTEREY COUNTYALTERNATIVES ANALYSISGeneral and local community plans show higher density housing and mixed-use developments inproximity to the three proposed rail stations. The draft Castroville Community Plan proposeshousing and mixed-use developments proximate to the rail station. The City of Salinas’ GeneralPlan and Downtown Rebound Plan both call for redevelopment around the intermodaltransportation center. In Pajaro, the County Redevelopment and Housing office is planning for ajob-training center next to the rail station. All three plans actively support the transit centers asfocal points for redevelopment and infill development.6. Is funding available to implement the proposed transit service?Table 9-7 lists the proposed capital budget for the Caltrain <strong>Extension</strong> to Monterey County project.The total estimated project cost is $99.5 million expressed in year-of-expenditure dollars, dividedas $10.4 million for the Salinas MST bus facility and $89.0 million for the rail project, including alayover facility, bus transfer center and commuter parking in Salinas, a platform and parking inCastroville, a platform and parking in Pajaro, and main line UPRR track upgrades in Gilroy andbetween Gilroy and Salinas. This budget amount does not include an allowance for the purchaseof Caltrain rolling stock as sufficient passenger capacity exists to implement both the two-trainand four-train scenarios without need for additional passenger coaches.Funding for the Caltrain <strong>Extension</strong> project includes the State Traffic Congestion Relief Program,the Proposition 116 rail bond funds, State <strong>Transportation</strong> Improvement Program–Public <strong>Transportation</strong>Account funds, Regional Surface <strong>Transportation</strong> Program-Interest, a federal earmark,Congestion Mitigation and Air Quality Improvement funding, and contributions from local partneragencies. A proposed application for Federal Transit Administration New Starts funding in theamount of $45 million fills the gap between the available funding and the estimated total projectcost. These fund sources and amounts are preliminary and are subject to change.Three sources of funds required to meet net public operating costs (i.e., subsidize transitoperations and maintenance expense), are anticipated: local transportation funds, state transitassistance funds, and local sales tax funds. 16Table 9-7Caltrain <strong>Extension</strong> to Monterey County Capital Budget—Funding Element(year of expenditure dollars)Funding SourcesIdentified FundsAvailable Secured Proposed Grand TotalRegional Surface <strong>Transportation</strong> Program–Interest $ 315,000 $ 315,000 $ 0 $ 315,000Federal earmark $ 990,644 $ 990,644 $ 0 $ 990,644Congestion Mitigation and Air Quality Improvement $ 975,000 $ 975,000 $ 0 $ 975,000Proposition 116 rail bond funds $ 3,000,000 $ 3,000,000 $ 0 $ 3,000,000State <strong>Transportation</strong> Improvement Program $ 4,520,000 $ 4,520,000 $ 0 $ 4,520,000Traffic Congestion Relief Program $ 20,000,000 $20,000,000 $ 0 $ 20,000,000Local contributions $ 16,865,000 $ 1,165,000 $15,700,000 $ 16,865,000Monterey–Salinas Transit Federal grant/local match $ 9,411,000 $ 0 $ 9,411,000 $ 9,411,000Federal New Starts $ 45,000,200 $ 0 $45,000,200 $ 45,000,200Total Revenues $101,076,844 $30,965,644 $70,111,200 $101,076,844Source: TAMC—subject to change16A local transportation sales tax is proposed as a November 2008 ballot initiative.parsons CHAPTER 9: SUMMARY 228
CALTRAIN EXTENSION TO MONTEREY COUNTYALTERNATIVES ANALYSISSELECTION OF THE LOCALLY PREFERRED ALTERNATIVEBased on the array of technical information, evaluation findings and public input, a key outcome ofthe detailed <strong>Alternatives</strong> <strong>Analysis</strong> is the selection of a preferred long-term strategy for the corridor.The long-term strategy is defined as investments required to address the 2030 planning horizon. As asubcomponent of the locally preferred alternative, a reduced scope alternative is defined to addressnear term, opening year needs. This reduced scope alternative is known as the “minimum operatingsegment.” The minimum operating segment must address the purpose and need for the project withinthe context of near-term demographic and travel conditions. For the purpose of this study, the neartermminimum operating segment is defined for 2010 conditions.For the purpose of evaluating project worthiness, the Federal Transit Administration requires that projectapplicants for federal “New Starts” discretionary funding also provide comparative information ona transportation system management or “best bus” alternative. For this reason, performance characteristicsof a “baseline” alternative have been included in this study along with those of the Caltrain<strong>Extension</strong> Alternative and the minimum operating segment of the Caltrain <strong>Extension</strong> Alternative.The results of this <strong>Alternatives</strong> <strong>Analysis</strong> study, ongoing from 2002 through 2007, indicate that theCaltrain <strong>Extension</strong> to Monterey County is the most cost effective alternative for serving intercountycommuters to Silicon Valley and providing access to educational and health careresources in the San Francisco Bay Area. Selection of this option will meet the purpose and needof the proposed investment by providing additional transportation capacity in the U.S. 101 travelcorridor. Further, selection of the Caltrain <strong>Extension</strong> modal option can increase capacity over andabove that defined for the Caltrain <strong>Extension</strong> Alternative by increasing the length of the trains (addingmore cars) and/or increasing the number of trains operated. The Caltrain <strong>Extension</strong> Alternative is alsosuperior to the Express Bus Alternative for stimulating the local economy and supporting transitorienteddevelopment.The Caltrain <strong>Extension</strong> Alternative proposes to extend existing Caltrain service from Gilroy to Salinasto relieve congestion and add transportation capacity during commute hours to the U.S. 101 corridorbetween Monterey County and the San Francisco Bay Area. This service would initially consist of tworound trips per day as the minimum operating segment, and would later be expanded to four roundtrips per day. This project would require rights to greater track access; right-of-way acquisition;construction of parking, station tracks, platforms, access improvements, mainline track and signalingimprovements; and a Caltrain layover facility. These improvements would be implemented over timebetween the minimum operating segment and the full Caltrain <strong>Extension</strong> Alternative.PARTNERSHIPS AND COLLABORATIONThere is strong local support for the proposed service extension due to the projected populationgrowth in the Monterey Bay Area and the increasing numbers of San Francisco Bay Area workerswho are making their homes in San Benito, Santa Cruz, and Monterey counties. A multi-agency taskforce comprised of the Santa Clara Valley <strong>Transportation</strong> Authority, <strong>Transportation</strong> Agency forMonterey County, Association of Monterey Bay Area Governments, MST, Caltrans, Santa CruzCounty Regional <strong>Transportation</strong> Commission, San Benito County, and the cities of Salinas andWatsonville has been meeting to discuss and plan the initial steps to creating this train serviceextension. This project is an outgrowth of their multi-agency coordination.Local and regional agencies representing the study area or portions thereof have conducted manystudies that serve as precursors or complements to this selection of a locally preferred alternative.parsons CHAPTER 9: SUMMARY 229
CALTRAIN EXTENSION TO MONTEREY COUNTYALTERNATIVES ANALYSISThe project has been coordinated with the Union Pacific <strong>Rail</strong>road, the Peninsula Corridor JointPowers Board, Caltrans, the Santa Clara Valley <strong>Transportation</strong> Authority, the City of Salinas, theRedevelopment Agency of Monterey County, Monterey–Salinas Transit, the City of Watsonville, theSanta Cruz County Regional <strong>Transportation</strong> Commission, and the Santa Cruz Metropolitan TransitDistrict.In 1992, Passenger <strong>Rail</strong> Feasibility Study No. 05D423 was prepared for Caltrans to address the feasibilityof passenger rail service between San Francisco, Monterey, Salinas, and Hollister. The studyindicated that commuter rail could feasibly serve the existing market for work trips between Salinasand the Silicon Valley.A locally preferred alternative was adopted in the 1994 Monterey County Regional <strong>Transportation</strong>Plan. This included the extension of one Caltrain commute train. The 2002 and 2005 Regional <strong>Transportation</strong>Plans cite growing traffic congestion between Monterey County and the San Francisco BayArea and the demand for commuter rail services in the U.S. 101 Corridor. The 2005 Regional <strong>Transportation</strong>Plan includes the extension of Caltrain to Salinas in its list of planned projects.In 1997, the City of Watsonville prepared a Draft Pajaro Valley Station Project Study Report, in cooperationwith Monterey County, TAMC and the Santa Cruz County Regional <strong>Transportation</strong> Commission.While not finalized, this Draft project study report identified a potential site location and set ofprogram requirements for this station.Between 1998 and 2000, these program requirements and opportunities for adjacent site developmentwere further refined and explored by the Monterey County sponsored Pajaro <strong>Rail</strong>yards AreaFeasibility Study. This study, as well as the draft project study report, sited the Pajaro Valley stationadjacent to the former Southern Pacific Passenger Depot which is accessed from Salinas Road.In 2000, TAMC sponsored the preparation of the <strong>Extension</strong> of Caltrain <strong>Commuter</strong> Service toMonterey County Business Plan. The business plan considered, but did not thoroughly evaluate,alternative sites for stations at Pajaro and Castroville and a layover yard in Salinas.Caltrans’ <strong>Transportation</strong> Concept Report for U.S. 101 in Caltrans District 5 (2001) recommends thatdemand be reduced on U.S. 101 in Monterey and San Benito counties by encouraging and improvingalternative modes such as passenger rail, including the extension of Caltrain service from Gilroy toSalinas.With funding supplied by TAMC, Santa Clara Valley <strong>Transportation</strong> Authority, and others, UPRR hasundertaken a train simulation “capacity study” of potential freight and passenger rail operations innorthern California. Based on the results of this study, UPRR has identified track, switch, andsignaling improvements that may be required to implement additional passenger rail service toMonterey County. These have been documented by a "Term Sheet," dated June 26, 2003. Additionaltrack and signaling improvements have been identified in the California Passenger <strong>Rail</strong> System Five-Year Improvement Plan.The Peninsula Corridor Joint Powers Board includes the Caltrain extension to Salinas in the Caltrain2004–2023 Strategic Plan along with route extensions to downtown San Francisco and across theDumbarton Bridge to the East Bay. Each of these extensions are currently undergoing design and/orenvironmental study. Additionally, a project development team of Monterey and Santa Cruz Countylocal government representatives has been meeting since September 2000 to refine station programand transportation requirements and resolve station site issues.parsons CHAPTER 9: SUMMARY 230
CALTRAIN EXTENSION TO MONTEREY COUNTYALTERNATIVES ANALYSISThe Monterey County General Bikeways Plan (2001) includes a proposed Class I Bikeway alongCastroville Boulevard and underneath the UPRR rail line in the vicinity of the proposed Castrovillestation. This trail will provide connectivity between the Castroville central business district, the highschool to the east, and the station area.The City of Salinas has been actively working since 1996 to develop the Intermodal <strong>Transportation</strong>Center on the site of the Amtrak passenger station. In 1999, the city’s Redevelopment Agencyacquired 3.5 acres of land housing the station from UPRR. Beginning in June 1996, the city consideredvarious land acquisition strategies and conceptual plans for transportation center development.In June 1998, a site plan was finalized. The city subsequently constructed the Amtrak facility thatexists today.Specific ongoing efforts include the City of Salinas’ plans for intensified transit-oriented developmentnear the Salinas station site, Caltrans’ plans for upgrading SR 156 east of Castroville Boulevard, theCastroville Community Plan, the Pajaro Community Plan, UPRR’s short- and long-term plans forfreight and yard operations, and the California Passenger <strong>Rail</strong> System Five-Year Improvement Plan.Formal cooperation agreements have been established between TAMC, the Monterey County RedevelopmentAgency and the City of Salinas (<strong>Rail</strong> Planning Funds Cooperation Agreement, dated February7, 2002, amended September 13, 2002) and between TAMC and MST (Agreement for FundingStudy of the Relocation of the Salinas Transit Center to the Salinas Intermodal Center as a Part ofthe Caltrain <strong>Extension</strong> Project, dated December 12, 2002).Negotiations are ongoing between TAMC and the Peninsula Corridor Joint Powers Board regardingrevenue and cost sharing. In addition, a purchase-of-service agreement will stipulate TAMC/PeninsulaCorridor Joint Powers Board rights and powers, financial commitments, service parameters, anddetails of administrative procedures.Discussions between TAMC and UPRR are also ongoing regarding main line track and signalingimprovements. TAMC has met with UPRR to develop a trackage rights agreement for the extensionof Caltrain from Gilroy to Salinas. On June 26, 2003 UPRR presented TAMC with a draft “Term SheetConditions for Salinas-Gilroy Passenger Service.” This term sheet outlines operating parameters,capacity/track improvements, compensation, liability/insurance, and other terms for the minimumoperating segment, subject to further discussions and negotiations during project delivery.Based on a detailed definition of the Caltrain <strong>Extension</strong> Alternative contained in the Caltrain<strong>Extension</strong> to Monterey County Project Study Report, dated February 21, 2006, a Draft CaliforniaEnvironmental Quality Act Environmental Impact Report was prepared and circulated for publiccomment on April 26, 2006. The public review period for the Draft Environmental Impact Reportended on June 16, 2006, and a Final Environmental Impact Report was subsequently published onJuly 26, 2006. The TAMC Board of Directors certified the Final Environmental Impact Report onAugust 23, 2006.As noted above, the minimum operating segment is the service and facilities defined in this <strong>Alternatives</strong><strong>Analysis</strong> for the 2010 timeframe. Three stations would initially be constructed as proposed forthe full Caltrain <strong>Extension</strong> Alternative. Parking supplies would be reduced, however, commensuratewith ridership expectations for the 2010–2015 initial five years of service operation. Other aspects ofthe minimum operating segment would be as defined for the full Caltrain <strong>Extension</strong> Alternative.parsons CHAPTER 9: SUMMARY 231
CALTRAIN EXTENSION TO MONTEREY COUNTYALTERNATIVES ANALYSISThis page intentionally left blank.parsons CHAPTER 9: SUMMARY 232