The Art of Evaluating Laboratory Fixed Bed Catalytic Cracking Data
The Art of Evaluating Laboratory Fixed Bed Catalytic Cracking Data
The Art of Evaluating Laboratory Fixed Bed Catalytic Cracking Data

Create successful ePaper yourself
Turn your PDF publications into a flip-book with our unique Google optimized e-Paper software.
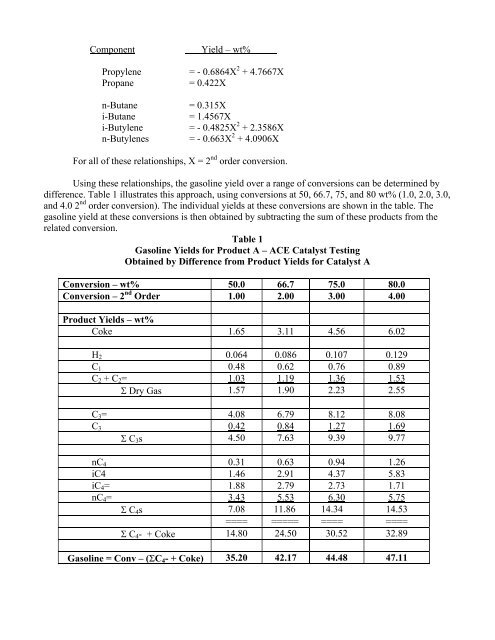
Component Yield – wt%Propylene = - 0.6864X 2 + 4.7667XPropane = 0.422Xn-Butane = 0.315Xi-Butane = 1.4567Xi-Butylene = - 0.4825X 2 + 2.3586Xn-Butylenes = - 0.663X 2 + 4.0906XFor all <strong>of</strong> these relationships, X = 2 nd order conversion.Using these relationships, the gasoline yield over a range <strong>of</strong> conversions can be determined bydifference. Table 1 illustrates this approach, using conversions at 50, 66.7, 75, and 80 wt% (1.0, 2.0, 3.0,and 4.0 2 nd order conversion). <strong>The</strong> individual yields at these conversions are shown in the table. <strong>The</strong>gasoline yield at these conversions is then obtained by subtracting the sum <strong>of</strong> these products from therelated conversion.Table 1Gasoline Yields for Product A – ACE Catalyst TestingObtained by Difference from Product Yields for Catalyst AConversion – wt% 50.0 66.7 75.0 80.0Conversion – 2 nd Order 1.00 2.00 3.00 4.00Product Yields – wt%Coke 1.65 3.11 4.56 6.02H 2 0.064 0.086 0.107 0.129C 1 0.48 0.62 0.76 0.89C 2 + C 2 = 1.03 1.19 1.36 1.53Σ Dry Gas 1.57 1.90 2.23 2.55C 3 = 4.08 6.79 8.12 8.08C 3 0.42 0.84 1.27 1.69Σ C 3 s 4.50 7.63 9.39 9.77nC 4 0.31 0.63 0.94 1.26iC4 1.46 2.91 4.37 5.83iC 4 = 1.88 2.79 2.73 1.71nC 4 = 3.43 5.53 6.30 5.75Σ C 4 s 7.08 11.86 14.34 14.53==== ===== ==== ====Σ C 4 - + Coke 14.80 24.50 30.52 32.89Gasoline = Conv – (ΣC 4 - + Coke) 35.20 42.17 44.48 47.11