The Art of Evaluating Laboratory Fixed Bed Catalytic Cracking Data
The Art of Evaluating Laboratory Fixed Bed Catalytic Cracking Data
The Art of Evaluating Laboratory Fixed Bed Catalytic Cracking Data

You also want an ePaper? Increase the reach of your titles
YUMPU automatically turns print PDFs into web optimized ePapers that Google loves.
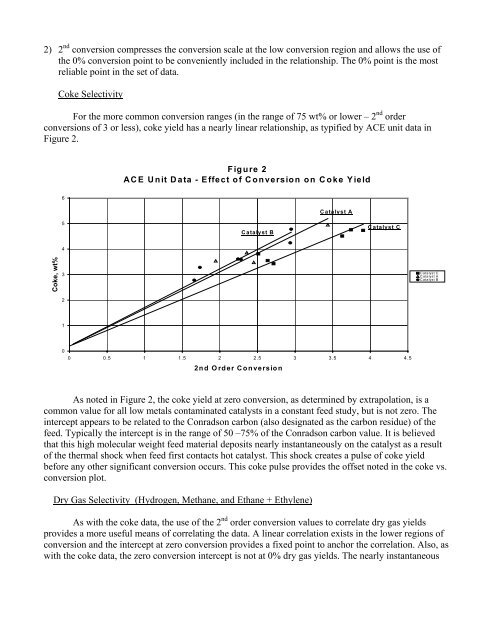
2) 2 nd conversion compresses the conversion scale at the low conversion region and allows the use <strong>of</strong>the 0% conversion point to be conveniently included in the relationship. <strong>The</strong> 0% point is the mostreliable point in the set <strong>of</strong> data.Coke SelectivityFor the more common conversion ranges (in the range <strong>of</strong> 75 wt% or lower – 2 nd orderconversions <strong>of</strong> 3 or less), coke yield has a nearly linear relationship, as typified by ACE unit data inFigure 2.Figure 2ACE Unit <strong>Data</strong> - Effect <strong>of</strong> Conversion on Coke Yield6Catalyst A5Catalyst BCatalyst C4Coke, wt%32Catalyst CCatalyst ACatalyst B100 0.5 1 1.5 2 2.5 3 3.5 4 4.52nd Order ConversionAs noted in Figure 2, the coke yield at zero conversion, as determined by extrapolation, is acommon value for all low metals contaminated catalysts in a constant feed study, but is not zero. <strong>The</strong>intercept appears to be related to the Conradson carbon (also designated as the carbon residue) <strong>of</strong> thefeed. Typically the intercept is in the range <strong>of</strong> 50 –75% <strong>of</strong> the Conradson carbon value. It is believedthat this high molecular weight feed material deposits nearly instantaneously on the catalyst as a result<strong>of</strong> the thermal shock when feed first contacts hot catalyst. This shock creates a pulse <strong>of</strong> coke yieldbefore any other significant conversion occurs. This coke pulse provides the <strong>of</strong>fset noted in the coke vs.conversion plot.Dry Gas Selectivity (Hydrogen, Methane, and Ethane + Ethylene)As with the coke data, the use <strong>of</strong> the 2 nd order conversion values to correlate dry gas yieldsprovides a more useful means <strong>of</strong> correlating the data. A linear correlation exists in the lower regions <strong>of</strong>conversion and the intercept at zero conversion provides a fixed point to anchor the correlation. Also, aswith the coke data, the zero conversion intercept is not at 0% dry gas yields. <strong>The</strong> nearly instantaneous