Study the Photodegradation of Aniline Blue dye in aqueous Phase ...
Study the Photodegradation of Aniline Blue dye in aqueous Phase ...
Study the Photodegradation of Aniline Blue dye in aqueous Phase ...

Create successful ePaper yourself
Turn your PDF publications into a flip-book with our unique Google optimized e-Paper software.
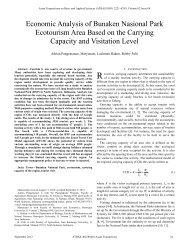
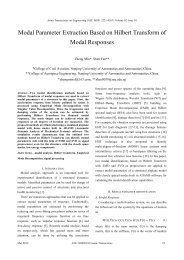
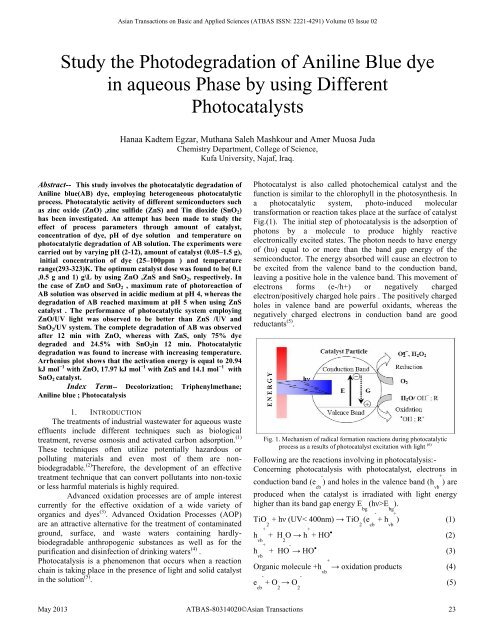
Asian Transactions on Basic and Applied Sciences (ATBAS ISSN: 2221-4291) Volume 03 Issue 02<strong>Study</strong> <strong>the</strong> <strong>Photodegradation</strong> <strong>of</strong> <strong>Anil<strong>in</strong>e</strong> <strong>Blue</strong> <strong>dye</strong><strong>in</strong> <strong>aqueous</strong> <strong>Phase</strong> by us<strong>in</strong>g DifferentPhotocatalystsHanaa Kadtem Egzar, Muthana Saleh Mashkour and Amer Muosa JudaChemistry Department, College <strong>of</strong> Science,Kufa University, Najaf, Iraq.Abstract-- This study <strong>in</strong>volves <strong>the</strong> photocatalytic degradation <strong>of</strong><strong>Anil<strong>in</strong>e</strong> blue(AB) <strong>dye</strong>, employ<strong>in</strong>g heterogeneous photocatalyticprocess. Photocatalytic activity <strong>of</strong> different semiconductors suchas z<strong>in</strong>c oxide (ZnO) ,z<strong>in</strong>c sulfide (ZnS) and T<strong>in</strong> dioxide (SnO 2 )has been <strong>in</strong>vestigated. An attempt has been made to study <strong>the</strong>effect <strong>of</strong> process parameters through amount <strong>of</strong> catalyst,concentration <strong>of</strong> <strong>dye</strong>, pH <strong>of</strong> <strong>dye</strong> solution and temperature onphotocatalytic degradation <strong>of</strong> AB solution. The experiments werecarried out by vary<strong>in</strong>g pH (2-12), amount <strong>of</strong> catalyst (0.05–1.5 g),<strong>in</strong>itial concentration <strong>of</strong> <strong>dye</strong> (25–100ppm ) and temperaturerange(293-323)K. The optimum catalyst dose was found to be( 0.1,0.5 g and 1) g\L by us<strong>in</strong>g ZnO ,ZnS and SnO 2 , respectively. In<strong>the</strong> case <strong>of</strong> ZnO and SnO 2 , maximum rate <strong>of</strong> photoreaction <strong>of</strong>AB solution was observed <strong>in</strong> acidic medium at pH 4, whereas <strong>the</strong>degradation <strong>of</strong> AB reached maximum at pH 5 when us<strong>in</strong>g ZnScatalyst . The performance <strong>of</strong> photocatalytic system employ<strong>in</strong>gZnO/UV light was observed to be better than ZnS /UV andSnO 2 /UV system. The complete degradation <strong>of</strong> AB was observedafter 12 m<strong>in</strong> with ZnO, whereas with ZnS, only 75% <strong>dye</strong>degraded and 24.5% with SnO 2 <strong>in</strong> 12 m<strong>in</strong>. Photocatalyticdegradation was found to <strong>in</strong>crease with <strong>in</strong>creas<strong>in</strong>g temperature.Arrhenius plot shows that <strong>the</strong> activation energy is equal to 20.94kJ mol −1 with ZnO, 17.97 kJ mol −1 with ZnS and 14.1 mol −1 withSnO 2 catalyst.Index Term-- Decolorization; Triphenylmethane;<strong>Anil<strong>in</strong>e</strong> blue ; Photocatalysis1. INTRODUCTIONThe treatments <strong>of</strong> <strong>in</strong>dustrial wastewater for <strong>aqueous</strong> wasteeffluents <strong>in</strong>clude different techniques such as biologicaltreatment, reverse osmosis and activated carbon adsorption. (1)These techniques <strong>of</strong>ten utilize potentially hazardous orpollut<strong>in</strong>g materials and even most <strong>of</strong> <strong>the</strong>m are nonbiodegradable.(2) Therefore, <strong>the</strong> development <strong>of</strong> an effectivetreatment technique that can convert pollutants <strong>in</strong>to non-toxicor less harmful materials is highly required.Advanced oxidation processes are <strong>of</strong> ample <strong>in</strong>terestcurrently for <strong>the</strong> effective oxidation <strong>of</strong> a wide variety <strong>of</strong>organics and <strong>dye</strong>s (3) . Advanced Oxidation Processes (AOP)are an attractive alternative for <strong>the</strong> treatment <strong>of</strong> contam<strong>in</strong>atedground, surface, and waste waters conta<strong>in</strong><strong>in</strong>g hardlybiodegradableanthropogenic substances as well as for <strong>the</strong>purification and dis<strong>in</strong>fection <strong>of</strong> dr<strong>in</strong>k<strong>in</strong>g waters (4) .Photocatalysis is a phenomenon that occurs when a reactioncha<strong>in</strong> is tak<strong>in</strong>g place <strong>in</strong> <strong>the</strong> presence <strong>of</strong> light and solid catalyst<strong>in</strong> <strong>the</strong> solution (5) .Photocatalyst is also called photochemical catalyst and <strong>the</strong>function is similar to <strong>the</strong> chlorophyll <strong>in</strong> <strong>the</strong> photosyn<strong>the</strong>sis. Ina photocatalytic system, photo-<strong>in</strong>duced moleculartransformation or reaction takes place at <strong>the</strong> surface <strong>of</strong> catalystFig.(1). The <strong>in</strong>itial step <strong>of</strong> photocatalysis is <strong>the</strong> adsorption <strong>of</strong>photons by a molecule to produce highly reactiveelectronically excited states. The photon needs to have energy<strong>of</strong> (hυ) equal to or more than <strong>the</strong> band gap energy <strong>of</strong> <strong>the</strong>semiconductor. The energy absorbed will cause an electron tobe excited from <strong>the</strong> valence band to <strong>the</strong> conduction band,leav<strong>in</strong>g a positive hole <strong>in</strong> <strong>the</strong> valence band. This movement <strong>of</strong>electrons forms (e-/h+) or negatively chargedelectron/positively charged hole pairs . The positively chargedholes <strong>in</strong> valence band are powerful oxidants, whereas <strong>the</strong>negatively charged electrons <strong>in</strong> conduction band are goodreductants (5) .Fig. 1. Mechanism <strong>of</strong> radical formation reactions dur<strong>in</strong>g photocatalyticprocess as a results <strong>of</strong> photocatalyst excitation with light (6)Follow<strong>in</strong>g are <strong>the</strong> reactions <strong>in</strong>volv<strong>in</strong>g <strong>in</strong> photocatalysis:-Concern<strong>in</strong>g photocatalysis with photocatalyst, electrons <strong>in</strong>conduction band (ecb-) and holes <strong>in</strong> <strong>the</strong> valence band (hvb+) areproduced when <strong>the</strong> catalyst is irradiated with light energyhigher than its band gap energy Ebg(hν>Ebg).TiO2+ hν (UV< 400nm) → TiO2(ecb-+ hvb+) (1)hvb++ H2 O → h + + HO (2)hvb++ HO-→ HOOrganic molecule +hvb+→ oxidation products (4)ecb-+ O2 → O2-(3)(5)May 2013 ATBAS-80314020©Asian Transactions 23
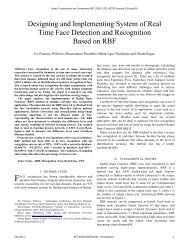
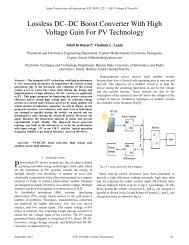
Asian Transactions on Basic and Applied Sciences (ATBAS ISSN: 2221-4291) Volume 03 Issue 02O2-+ h+→ HO2Organic molecule +ecb-reduction products (7)HO , HO2 + organic compounds → degradation products (8)Semiconductor compounds have drawn much attention dur<strong>in</strong>g<strong>the</strong> last few years because <strong>of</strong> <strong>the</strong>ir novel optical and transportproperties which have great potential for many optoelectronicapplications. (7)Among <strong>the</strong> listed semiconductors, TiO 2 has proven to be <strong>the</strong>most suitable for widespread environmental applications. ZnOalso seems to be a suitable photocatalyst but it dissolves <strong>in</strong>acidic solutions it is a semiconductor material for variousphotonic and electrical applications. ZnO shows a unique set<strong>of</strong> physical and chemical properties, such as a wide band gap(3.2 eV), large exaction b<strong>in</strong>d<strong>in</strong>g energy (60 meV) at roomtemperature, radiation hardness (8) .T<strong>in</strong> dioxide (SnO 2 ) is a n-type semiconductor with a largeband gap (Eg = 3.9 eV ) which shows promise for a number <strong>of</strong>applications <strong>in</strong>clud<strong>in</strong>g transparent conductors.Z<strong>in</strong>c sulfide (ZnS) is a wide band gap and direct transitionsemiconductor (9) . Z<strong>in</strong>c sulfide is an important semiconductormaterial with a wide direct band gap Eg = 3.68 eV (10) .Dyes are typically organic compounds that absorblight <strong>in</strong> specific areas <strong>of</strong> <strong>the</strong> visible spectrum. <strong>Anil<strong>in</strong>e</strong> <strong>Blue</strong><strong>dye</strong> it is water soluble <strong>dye</strong> (11) , it is used for dy<strong>in</strong>g wool andcotton directly and widely used <strong>in</strong> <strong>dye</strong> <strong>in</strong>dustries <strong>the</strong>refore itspresence <strong>in</strong> <strong>the</strong> <strong>in</strong>dustrial discharge water also contributes toenvironmental pollution (12) . Due to its stability , it has longresidence time <strong>in</strong> water. (13) Molecular structure <strong>of</strong> <strong>Anil<strong>in</strong>e</strong><strong>Blue</strong> has been illustrated <strong>in</strong> Fig. 2. <strong>Anil<strong>in</strong>e</strong> <strong>Blue</strong>, also calledacid blue 22, ch<strong>in</strong>a blue, soluble blue 3M, and Mar<strong>in</strong>e blue. Itis very soluble <strong>in</strong> water,(6)<strong>in</strong>sulated <strong>in</strong> a wooden box to prevent <strong>the</strong> escape <strong>of</strong> harmfulradiation and m<strong>in</strong>imized temperature fluctuations caused bydraughts.Z<strong>in</strong>c oxide with 99% purity were supplied by Fluka-Garantie, Z<strong>in</strong>c sulfide with 99.3% purity supplied byM.B.LTD Dagenham and T<strong>in</strong> dioxide SnO 2 with 99% puritywas supplied by Fluka-Garantie . <strong>Anil<strong>in</strong>e</strong> blue <strong>dye</strong> (analyticalgrade) was purchased from (RDS-Hannover) and used withoutfur<strong>the</strong>r purification. Solutions were prepared us<strong>in</strong>g doubledistilled water. In all experiments, <strong>the</strong> required amount <strong>of</strong> <strong>the</strong>catalyst was suspended <strong>in</strong> 200 cm 3 <strong>of</strong> <strong>aqueous</strong> solutions <strong>of</strong>AB, us<strong>in</strong>g a magnetic stirrer. At predeterm<strong>in</strong>ed times; 5 cm 3 <strong>of</strong>reaction mixture was collected and centrifuged (3000 rpm, 15m<strong>in</strong>utes) <strong>in</strong> centrifuge. The supernatant was carefully removedby a syr<strong>in</strong>ge with a long pliable needle and centrifuged aga<strong>in</strong>at same speed and for <strong>the</strong> same period <strong>of</strong> time. This secondcentrifugation was found necessary to remove f<strong>in</strong>e particles <strong>of</strong>catalysts. After <strong>the</strong> second centrifugation <strong>the</strong> absorbance at(309, 586) nm <strong>of</strong> <strong>the</strong> supernatants was determ<strong>in</strong>ed us<strong>in</strong>gultraviolet-visible spectrophotometer, type UV-1650pc.P.D.E. <strong>of</strong> AB was followed spectrophotometrically by acomparison <strong>of</strong> <strong>the</strong> absorbance, at specified <strong>in</strong>terval times, witha calibration curve accomplished by measur<strong>in</strong>g <strong>the</strong>absorbance, at(λ max 586) nm, with different concentrations <strong>of</strong><strong>the</strong> <strong>dye</strong> solution.%Decolorization = 100 × (C 0 − C)/C 0where C 0 = <strong>in</strong>itial concentration <strong>of</strong> <strong>dye</strong> solution, C =concentration <strong>of</strong> <strong>dye</strong> solution after photoirradiation. In order todeterm<strong>in</strong>e <strong>the</strong> effect <strong>of</strong> catalyst load<strong>in</strong>g, <strong>the</strong> experiments wereperformed by vary<strong>in</strong>g catalyst concentration from 0.05 to 1.5 gfor <strong>dye</strong> solutions <strong>of</strong> 100ppm at natural pH (5.57). Similarexperiments were carried out by vary<strong>in</strong>g <strong>the</strong> pH <strong>of</strong> <strong>the</strong> solution(pH 2–12) and concentration <strong>of</strong> <strong>dye</strong>(25,50,100 )ppm. <strong>the</strong>reaction temperatures amounted to 293,303,313 and 323K.Fig. 2. structure <strong>of</strong> <strong>Anil<strong>in</strong>e</strong> <strong>Blue</strong> <strong>dye</strong> (14) .<strong>Anil<strong>in</strong>e</strong> <strong>Blue</strong> <strong>dye</strong> is a acidic <strong>dye</strong> belongs to triphenylmethane class <strong>of</strong> <strong>dye</strong> (15) Triphenylmethane <strong>dye</strong>s are those <strong>dye</strong>s<strong>in</strong> which a central carbon atom is bonded to two benzene r<strong>in</strong>gsand one p-qu<strong>in</strong>oid group (chromophore) (16) . The auxochromesare - NH 2 , NR 2 and –OH (17) . Triphenylmethane <strong>dye</strong>s are usedextensively <strong>in</strong> <strong>the</strong> textile <strong>in</strong>dustries for <strong>dye</strong><strong>in</strong>g <strong>of</strong> nylon,polyacrylon nitrile, modified nylon, wool, silk and cotton.3. RESULTS AND DISCUSSION3.1. UV–vis spectra <strong>of</strong> <strong>dye</strong>Results <strong>of</strong> <strong>the</strong> present study clearly show that <strong>the</strong>photocatalytic treatment <strong>of</strong> <strong>aqueous</strong> solution <strong>of</strong> anil<strong>in</strong>e blueunder UV light, leads to decolorization and degradation <strong>of</strong><strong>dye</strong>. Figs.3 to 5 shows <strong>the</strong> typical time dependent UV-Visspectrum <strong>of</strong> AB solution dur<strong>in</strong>g photoirradiation with ZnO,ZnS andSnO 2 respectively. The rate <strong>of</strong> degradation wasrecorded with respect to <strong>the</strong> change <strong>in</strong> <strong>the</strong> <strong>in</strong>tensity <strong>of</strong>absorption peak <strong>in</strong> ultraviolet region and visible region. Theprom<strong>in</strong>ent peaks were observed at λ max (309,586) nm whichdecreased gradually and f<strong>in</strong>ally disappeared <strong>in</strong>dicat<strong>in</strong>g (18) that<strong>the</strong> <strong>dye</strong> had been degraded.2. EXPERIMENTALA homemade photoreactor equipped with a Philips 250W,medium pressure mercury lamp as a source for UV radiation,was used to determ<strong>in</strong>e P.D.E. The reactor was consisted <strong>of</strong>graduated 1000 cm 3 Pyrex glass beaker and a magnetic stirr<strong>in</strong>gsetup. The lamp was positioned perpendicularly above <strong>the</strong>beaker. The distance between <strong>the</strong> lamp and <strong>the</strong> graduatedPyrex glass was 15 cm. The whole photocatalytic reactor wasMay 2013 ATBAS-80314020©Asian Transactions 24
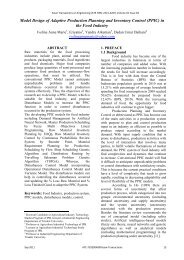
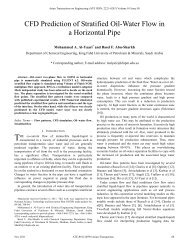
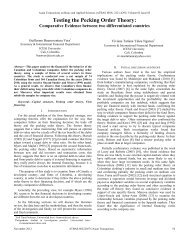
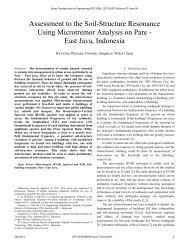
P.D.EAsian Transactions on Basic and Applied Sciences (ATBAS ISSN: 2221-4291) Volume 03 Issue 021009080706050403020100Fig. 3. Time dependent UV-Vis absorption spectra for degradation <strong>of</strong> anil<strong>in</strong>eblue <strong>dye</strong>(100ppm) ,(0.1g) ZnO catalyst, time(m<strong>in</strong>).Fig. 4. Time dependent UV-Vis absorption spectra for degradation <strong>of</strong> anil<strong>in</strong>eblue <strong>dye</strong>(100ppm),(0.5g) ZnS catalyst, time(m<strong>in</strong>).Fig. 5. Time dependent UV-Vis absorption spectra for degradation <strong>of</strong> anil<strong>in</strong>eblue <strong>dye</strong> (100ppm),(1.0g) SnO 2catalyst,time(hours) .3.2 Degradation <strong>of</strong> AB solution Under DifferentExperimental ConditionsDegradation <strong>of</strong> AB solution was <strong>in</strong>vestigated under sevendifferent experimental conditions through UV alone, UV +ZnS, UV + ZnO,UV+ SnO 2 , Dark + ZnS , Dark + ZnO andDark + SnO 2 . Fig.1 depicts <strong>the</strong> photocatalytic degradation <strong>of</strong>AB solution under <strong>the</strong>se experimental conditions. Initiallyblank experiments were performed under UV irradiationwithout addition <strong>of</strong> any catalyst (UV alone) and only 10%degradation was observed after 60m<strong>in</strong>.Fig. 6. Photocatalytic degradation <strong>of</strong> AB <strong>dye</strong> (<strong>dye</strong> <strong>in</strong>itial concentration—100ppm, (0.1g)ZnO,(0.5g)ZnS ,(1g) SnO 2 after 12m<strong>in</strong>.Thereafter <strong>the</strong> adsorption <strong>of</strong> <strong>the</strong> <strong>dye</strong> was observed withboth catalysts, i.e., Dark + ZnS, Dark+ SnO 2 and Dark + ZnO.Only 14.3%, 32% and 7.7respectively adsorption <strong>of</strong> <strong>the</strong> <strong>dye</strong>was seen <strong>in</strong> <strong>the</strong> same time with both catalysts under darkconditions. Then photocatalytic experiments were carried outus<strong>in</strong>g all catalysts at fixed <strong>dye</strong> concentration (100ppm) andcatalyst amount <strong>of</strong> 0.1g <strong>of</strong> ZnO ,0.5g <strong>of</strong> ZnS and1g <strong>of</strong> SnO 2 .When experiments were performed under UV irradiation withZnO as photocatalyst (UV + ZnO), <strong>the</strong> complete degradation<strong>of</strong> <strong>dye</strong> was achieved after 12 m<strong>in</strong>, whereas with ZnS as aphotocatalyst (UV + ZnS), only 75% decolorization <strong>of</strong> ABsolution was observed and only 24.3% byus<strong>in</strong>gSnO 2 <strong>in</strong> <strong>the</strong>same duration. It <strong>in</strong>dicates that ZnO exhibits higherphotocatalytic activity than o<strong>the</strong>r semiconductors for <strong>the</strong>decolorization <strong>of</strong> AB <strong>dye</strong>.3.3Degradation <strong>of</strong> Dye by ZnO, SnO 2 and ZnS asPhotocatalystsThe experiments were carried out to study <strong>the</strong> degradation<strong>of</strong> AB solution employ<strong>in</strong>g ZnO, ZnS , SnO 2 as catalysts underUV light. Various parameters which affect <strong>the</strong> degradationefficiency such as catalyst load<strong>in</strong>g (0.05–1.5 g), pH (2-8),<strong>in</strong>itial concentration <strong>of</strong> <strong>dye</strong> (25–100 ppm), and temperature(293-323)K <strong>of</strong> degradation were assessed under UV light.3.3.1Effect <strong>of</strong> Catalyst weightFigures 7 show <strong>the</strong> effect <strong>of</strong> ZnO, ZnS and SnO 2 catalystamount on <strong>the</strong> degradation <strong>of</strong> AB solution at natural pH. It canbe seen that <strong>in</strong>itial slopes <strong>of</strong> <strong>the</strong> curves <strong>in</strong>crease greatly by<strong>in</strong>creas<strong>in</strong>g catalyst weight from 0.05 to 0.1 g for ZnO , 0.5gfor ZnS, and1g for SnO 2 <strong>the</strong>reafter <strong>the</strong> rate <strong>of</strong> degradationrema<strong>in</strong>s constant or decreases. Fur<strong>the</strong>r <strong>in</strong>crease <strong>in</strong> <strong>the</strong> dose <strong>of</strong>catalyst had no effect on degradation <strong>of</strong> <strong>dye</strong>. Thephotocatalytic destruction <strong>of</strong> o<strong>the</strong>r organic pollutants has alsoexhibited <strong>the</strong> same dependency on catalyst dose . This can beexpla<strong>in</strong>ed on <strong>the</strong> basis that optimum catalyst load<strong>in</strong>g is foundto be dependent on <strong>in</strong>itial solute concentration because with<strong>the</strong> <strong>in</strong>crease <strong>in</strong> catalyst dosage, total active surface area<strong>in</strong>creases, hence availability <strong>of</strong> more active sites on catalystsurface (18) . At <strong>the</strong> same time, due to an <strong>in</strong>crease <strong>in</strong> turbidity <strong>of</strong><strong>the</strong> suspension with high dose <strong>of</strong> photocatalyst, <strong>the</strong>re will bedecrease <strong>in</strong> penetration <strong>of</strong> UV light and hence photoactivatedvolume <strong>of</strong> suspension decreases (19) . Thus it can be concludedMay 2013 ATBAS-80314020©Asian Transactions 25
P.D.EP.D.EAsian Transactions on Basic and Applied Sciences (ATBAS ISSN: 2221-4291) Volume 03 Issue 02that higher dose <strong>of</strong> catalyst may not be useful both <strong>in</strong> view <strong>of</strong>aggregation as well as reduced irradiation field due to lightscatter<strong>in</strong>g (20) .1009080706050403020100ZnOZnS0.05 0.1 0.25 0.5 0.75 1 1.25 1.5weight(Fig. 7. Effect <strong>of</strong> ZnO ,ZnS and SnO 2 dose on degradation efficient <strong>of</strong> AB <strong>dye</strong>(at natural pH(5.57), and <strong>in</strong>itial concentration <strong>of</strong> <strong>dye</strong> 100ppm),after (12m<strong>in</strong>)3.3.2Effect <strong>of</strong> pHWastewater conta<strong>in</strong><strong>in</strong>g <strong>dye</strong>s is discharged at different pH;<strong>the</strong>refore it is important to study <strong>the</strong> role <strong>of</strong> pH on degradation<strong>of</strong> <strong>dye</strong>. In order to study <strong>the</strong> effect <strong>of</strong> pH on <strong>the</strong> degradationefficiency, experiments were carried out at various pH values,rang<strong>in</strong>g from 2 to 12 for constant <strong>dye</strong> concentration (100ppm)and catalyst weight (0.1,0.5 and 1 g, respectively, for ZnO,ZnS and SnO 2 ). Figures 4 show <strong>the</strong> photodegradationefficiency <strong>of</strong> AB solution as a function <strong>of</strong> pH. It has beenobserved that by us<strong>in</strong>g ZnO and SnO 2 , <strong>the</strong> degradationefficiency <strong>in</strong>creases with <strong>in</strong>crease <strong>in</strong> pH exhibit<strong>in</strong>g maximumrate <strong>of</strong> degradation at pH 4. In <strong>the</strong> case <strong>of</strong> ZnS, <strong>the</strong> maximumdegradation was observed at pH 5. Similar behavior has alsobeen reported for <strong>the</strong> photocatalytic efficiency <strong>of</strong> ZnS fordecolorization <strong>of</strong> acid <strong>dye</strong>s. The <strong>in</strong>terpretation <strong>of</strong> pH effectson <strong>the</strong> efficiency <strong>of</strong> <strong>the</strong> photocatalytic degradation process is avery difficult task, because <strong>of</strong> its multiple roles. First, it isrelated to <strong>the</strong> acid base property <strong>of</strong> <strong>the</strong> metal oxide surface andcan be expla<strong>in</strong>ed on <strong>the</strong> basis <strong>of</strong> zero po<strong>in</strong>t charge (21) . Theadsorption <strong>of</strong> water molecules at sacrificial metal sites isfollowed by <strong>the</strong> dissociation <strong>of</strong> OH − charge groups, lead<strong>in</strong>g tocoverage with chemically equivalent metal hydroxyl groups(M-OH) (22) . Due to amphoteric behavior <strong>of</strong> most metalhydroxides, <strong>the</strong> follow<strong>in</strong>g two equilibrium reactions areconsidered (Eqs. 9 and 10).M-OH + H + + M-OH 2(9)M-OH M-O - +H + (10)1008060402002 3 4 5 6 7 8pHFig. 8. Effect <strong>of</strong> pH on degradation rate <strong>of</strong> AB <strong>dye</strong> (ZnO dose—0.1 g, ZnSdose—0.5 g and 1.0gSnO 2 ,<strong>dye</strong> <strong>in</strong>itial concentration100ppm ).The zero po<strong>in</strong>t charge (zpc) for ZnO is 9 and 6.7for ZnS,surface is positively charged below this po<strong>in</strong>t and above thispH, surface is negatively charged by adsorbedOH − ions (23) .photocatalytic activity <strong>of</strong> anionic <strong>dye</strong>s (ma<strong>in</strong>lysulfonated <strong>dye</strong>s) such as AB <strong>dye</strong> reaches a maximum value <strong>in</strong>lower zero po<strong>in</strong>t charge. At pH > zpc, <strong>the</strong> surface is positivelycharged and <strong>the</strong> <strong>dye</strong> is anion (24) . The experimental resultsrevealed that higher degradation <strong>of</strong> AB solution was found tobe <strong>in</strong> acidic conditions. This may be attributed to <strong>the</strong>electrostatic <strong>in</strong>teractions between <strong>the</strong> positive catalyst surfaceand <strong>dye</strong> anions lead<strong>in</strong>g to strong adsorption <strong>of</strong> <strong>the</strong> latter on <strong>the</strong>metal oxide support (25) .3.3.3Effect <strong>of</strong> Concentration <strong>of</strong> DyeAfter optimiz<strong>in</strong>g <strong>the</strong> pH conditions and catalyst dose (pH4 and catalyst dose 0.1 g for ZnO, pH 5 and catalyst dose 0.5 gfor ZnS, pH 4 and catalyst dose 1 g for SnO 2 ), <strong>the</strong>photocatalytic degradation <strong>of</strong> <strong>dye</strong> was carried out by vary<strong>in</strong>g<strong>the</strong> <strong>in</strong>itial concentrations <strong>of</strong> <strong>the</strong> <strong>dye</strong> (25,50, 100) ppm <strong>in</strong> orderto assess <strong>the</strong> appropriate amount <strong>of</strong> catalyst dose. As <strong>the</strong>concentration <strong>of</strong> <strong>the</strong> <strong>dye</strong> was <strong>in</strong>creased, <strong>the</strong> rate <strong>of</strong>photoreaction decreased <strong>in</strong>dicat<strong>in</strong>g for ei<strong>the</strong>r to <strong>in</strong>crease <strong>the</strong>catalyst dose or time span for <strong>the</strong> complete removal. Figure 5depict <strong>the</strong> time-dependent graphs <strong>of</strong> degradation <strong>of</strong> ABsolution at different concentrations <strong>of</strong> <strong>dye</strong> . The possibleexplanation for this behavior is that as <strong>the</strong> <strong>in</strong>itial concentration<strong>of</strong> <strong>the</strong> <strong>dye</strong> <strong>in</strong>creases, <strong>the</strong> path length <strong>of</strong> <strong>the</strong> photons enter<strong>in</strong>g<strong>the</strong> solution decreases and <strong>in</strong> low concentration <strong>the</strong> reverseeffect is observed, <strong>the</strong>reby <strong>in</strong>creas<strong>in</strong>g <strong>the</strong> number <strong>of</strong> photonabsorption by <strong>the</strong> catalyst <strong>in</strong> lower concentration (26,27) .ZnOMay 2013 ATBAS-80314020©Asian Transactions 26
P.D.EAsian Transactions on Basic and Applied Sciences (ATBAS ISSN: 2221-4291) Volume 03 Issue 02100ZnO(0.338232)m<strong>in</strong> -1 , (0.165280)m<strong>in</strong> -1 and (0.017087)m<strong>in</strong> -1 for ZnO, ZnS, and SnO 2 respectively.8060ZnS1412ZnOZnSSnO24020025 50 100Con.(ppFig. 9. Effect <strong>of</strong> <strong>in</strong>itial concentration <strong>of</strong> AB <strong>dye</strong> on photodegradationefficiency when us<strong>in</strong>g (ZnO dose0.1g, pH 4, ZnS dose0.5g and1.0g SnO 2, pH5.57 )3.3.4Effect <strong>of</strong> temperature:The photocatalytic degradation was studied at varioustemperatures <strong>in</strong> <strong>the</strong> range (293–323)K and rate constant, k,was determ<strong>in</strong>ed from <strong>the</strong> first-order plots. An <strong>in</strong>crease <strong>in</strong>temperature helps <strong>the</strong> reaction to compete more efficientlywith e–/H+ recomb<strong>in</strong>ation (28) . The energy <strong>of</strong> activation, Ea,was calculated from <strong>the</strong> Arrhenius plot <strong>of</strong> ln k vs. 1/T (figure10). Arrhenius plot shows that <strong>the</strong> activation energy forphotocatalytic degradation <strong>of</strong> AB solution is equal to 20±1 kJmol-1 ,17±1 and14±1 by us<strong>in</strong>g ZnO ,ZnS and SnO 2respectively. The experimental activation energy wasassociated with <strong>the</strong> energy required to promote photoelectronfrom trapp<strong>in</strong>g centers <strong>in</strong>to t<strong>in</strong> dioxide conduction band. <strong>the</strong>present value probably arises from <strong>the</strong> surface area and <strong>the</strong>purity <strong>of</strong> catalysts (29) .02.9-0.53 3.1 3.2 3.3 3.4 3.5-1-1.5-2-2.5-3-3.5-4-4.5Fig. 10. Arrhenius plot for photocatalytic degradation <strong>of</strong> AB on ZnO , ZnSand SnO 2 catalysts.3.3.5K<strong>in</strong>etic <strong>Study</strong>Figure 11 show <strong>the</strong> k<strong>in</strong>etics <strong>of</strong> disappearance <strong>of</strong> AB foran <strong>in</strong>itial concentration <strong>of</strong> 100ppm under optimizedconditions. The results show that <strong>the</strong> photocatalyticdegradation <strong>of</strong> <strong>dye</strong> <strong>in</strong> <strong>aqueous</strong> ZnO , ZnS and SnO 2 can bedescribed by <strong>the</strong> first-order k<strong>in</strong>etic accord<strong>in</strong>g to <strong>the</strong>Langmuir–H<strong>in</strong>shelwood model (30-32) , ln (C/C 0 ) =- kt, where C 0is <strong>the</strong> <strong>in</strong>itial concentration and C is <strong>the</strong> concentration at anytime, t. The semi-logarithmic plots <strong>of</strong> <strong>the</strong> concentration datagave a straight l<strong>in</strong>e. The rate constants were calculated to beZnOlnCC 010864200 5 10 15 20 25 30Fig. 11. K<strong>in</strong>etics analysis for AB <strong>dye</strong> (<strong>dye</strong> <strong>in</strong>itial concentration100ppm), (0.1gZnO), (0.5g ZnS) , and 1.0gSnO 2.4. CONCLUSIONExperimental results <strong>in</strong>dicated that <strong>the</strong> degradation <strong>of</strong> <strong>dye</strong>is facilitated <strong>in</strong> <strong>the</strong> presence <strong>of</strong> catalyst. Comparison <strong>of</strong>photocatalytic activity <strong>of</strong> different semiconductors has clearly<strong>in</strong>dicated that <strong>the</strong> ZnO is better photocatalyst for degradation<strong>of</strong> AB solution. Besides higher efficiency, <strong>the</strong> o<strong>the</strong>r advantage<strong>of</strong> ZnO is its low cost. The <strong>in</strong>itial rate <strong>of</strong> photodegradation<strong>in</strong>creased with <strong>in</strong>crease <strong>in</strong> catalyst dose up to an optimumload<strong>in</strong>g. Fur<strong>the</strong>r <strong>in</strong>crease <strong>in</strong> catalyst dose showed no effect. As<strong>the</strong> <strong>in</strong>itial concentration <strong>of</strong> <strong>dye</strong>s was <strong>in</strong>creased, <strong>the</strong> rate <strong>of</strong>degradation decreased <strong>in</strong> each semiconductor, Experimentalresults <strong>in</strong>dicated that <strong>the</strong> decolorization <strong>of</strong> <strong>dye</strong>s is facilitated <strong>in</strong><strong>the</strong> presence <strong>of</strong> catalyst and were favorable <strong>in</strong> acidic region,and <strong>the</strong> rate <strong>of</strong> decolorization and degradation <strong>of</strong> anil<strong>in</strong>e bluesolution <strong>in</strong>creases with <strong>the</strong> <strong>in</strong>crease <strong>of</strong> <strong>the</strong> temperature. Thephotocatalytic degradation followed pseudo-first orderk<strong>in</strong>etics.REFERENCE[1] A. S.Erses, , T. T. Onay; 2008.Bioresource Technology;(99):5418,5426[2] J. Lee, E. Kulla , 2008.Physics <strong>of</strong> Fluids; (20): 9[3] B .Boye, M .M .Dieng and E .Brillas , 2002. Env. Sci. & Technol.(36):3030[4] E.Pelizzetti, and M.Schiavello, Eds. 1991.PhotochemicalConversion andStorage <strong>of</strong> Solar Energy. <strong>the</strong>sis, Kluwer AcademicPublishers: Dordrecht.[5] D. Oussi, A. Mokr<strong>in</strong>i, and S. Esplugas, 1997. J. Photochem.Photobiol. A: Chem.; (1):77[6] Karpova, T. and y. Lappeenranta teknill<strong>in</strong>en, 2007. AqueousPhotocatalytic Oxidation <strong>of</strong> Steroid Estrogens. <strong>the</strong>sis,Lappeenranta University <strong>of</strong> Technology.[7] M. Barbeni, , E. Pramauro, E. Pelizzetti, E. Borgarello, N.Serpone; 1985. Chemosphere; ( 14):195,208.[8] D.C. Look, C.Coskun, B.Clafl<strong>in</strong> and G.C. Farlow . 2003. PhysicaB: Condensed Matter.(340):32-38.[9] L. I. Berger, B. P. Pampl<strong>in</strong>, 1993.Properties <strong>of</strong> semiconductors, <strong>in</strong>R. C. Weast (ed.) Handbook <strong>of</strong> Chemistry and Physics, 73rd edn.,CRC Press, Boca Raton, FL, p. 12-78 to 12- 85.[10] K. Sooklal, B.S. Cullumn, S.M. Angel, C.J. Murphy, 1996.J. Phys.Chem.(100):45-51,[11] E.L.Grabowska and Gryglewicz. 2007.Dyes Pigm.;(74):34‐40[12] G.R. Eykholt and D.T. Davenport. 1998.Environ. Sci. Technol.,(32):1482-1487,May 2013 ATBAS-80314020©Asian Transactions 27
Asian Transactions on Basic and Applied Sciences (ATBAS ISSN: 2221-4291) Volume 03 Issue 02[13] B. Pare, A. Soni and V.W. Bhagwat . 2008.Rasayan J. Chem .(1):413-420[14] N. Daneshvar, D. Salari, and A.R. Khataee, J. 2003.Photochem.Photobiol. A.(157):111[15] J. Fabian, H. Hartmann . 1980.Spr<strong>in</strong>ger Verlag, Berl<strong>in</strong>, (12):137.[16] L. M. Canle, A. J. Sataballa, et al. .2005.Journal <strong>of</strong> photochemistryand photobiology A: Chemistry , (175):192-200,[17] I. Sires, E. Guivarch, N. Oturan, and M.A. Oturan. 2008.Chemosphere,(72): 592.[18] S.K. Kansal , M. S<strong>in</strong>gh, and D. Sudc.2006. Studies onphotodegradation <strong>of</strong> two commercial <strong>dye</strong>s <strong>in</strong> <strong>aqueous</strong> phase us<strong>in</strong>gdifferent photocatalysts. Panjab University, Chandigarh, India.[19] S. Lathasree, R. Nageswara, B. Sivasankar, V. Sadasivam, K.Rengaraj.2004.J. Mole. Catal. A: Chem. (223) : 101[20] Nevim San, Arzu Hatipo glu, Gul<strong>in</strong> Koçturk, ZekiyeÇ<strong>in</strong>ar.2001.Journal <strong>of</strong> Photochemistry and Photobiology A:Chemistry (139) : 225–232[21] C.Lizama, J.Freer, J.Baeza, H.D.Mansilla.2002. Catal.Today.,(76):235.[22] A. Akyol, H.C. Yatmaz, M. Bayramoglu.2004. Appl. Catal. B:Environ.,(54):19.[23] S.Sakthivel, B.Neppolian, M.V.Shankar , B.Arab<strong>in</strong>doo,M.Palanichamy, and V.Murugesan.2003. Sol. Energy Mater. Sol.Cells. ,(77):65.[24] W. Stumm, J.J.Morgan .1981. Specific Adsorption <strong>of</strong> Cation onHydrous ɤ-Al 2O 3, Aquatic Chemistry. New York: Wiley.[25] M.A.El Hajj Hassan, L.M.A.Fayoumi, and M.M.El Jamal.2011.journal <strong>of</strong> <strong>the</strong> university <strong>of</strong> chemical technology and melallurgy;(46)4:395-400.[26] R.J. Davis, J.L.Ga<strong>in</strong>er, G.O.Neal, I.W.Wu.1994. Water Environ.Res. ,(66): 50.[27] H. Al-Ekabi, P. De Mayo. 1986. J. Phys. Chem (90) :4075.[28] Mills A and Hunte S L 1977 J. Photochem. & Photobiol. A:Chem.(108): 1[29] F.Husse<strong>in</strong>, M. Obies, & D. Bahnemann.2011.PhotocatalyticDegradation <strong>of</strong> Bismarck Brown R Us<strong>in</strong>g Commercial ZnO andTiO 2, to be published later.[30] Pare B, Jonnalagadda S B, Tomar H., S<strong>in</strong>gh P and Bhagwat V W.2008.Desal<strong>in</strong>ation (232):1-3[31] Sharma S D, Sa<strong>in</strong>i K K, Kant C, Sharma C P and Ja<strong>in</strong> S C. 2008.Applied Catalysis B: Environmental, (84):1- 2.[32] Chiou C, HWu CY and Juang, R S. 2008. Sep Purif Technol., 62:3.May 2013 ATBAS-80314020©Asian Transactions 28