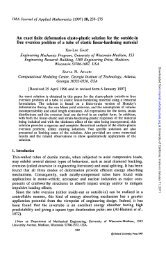
5.1Example 1 ± <strong>Elastic</strong>-plastic stable crack growthThis example is taken from the ®rst veri®cation study(Brust, Nishioka, Nakagaki, and Atluri (1985) and Brust,McGowan, and Atluri (1986)), and illustrates several importantfeatures of T . Consider an A533B steel which ismade into a number of compact tension specimens andtested. <strong>The</strong>se specimens were analyzed using elastic plastic®nite element analysis from the beginning of the test,through crack initiation and growth, through failure. Sincethese were displacement control tests, the analysis inputconsists of the load point displacement versus crackgrowth record and the predictions consist of the loads, theT -integral, and other fracture parameters. Figure 3 illustratesthe behavior of T throughout one of the tests. Thisanalysis was performed using four different mesh re®nementswith near crack tip mesh size (h from Fig. 2; hereh ˆ Da, the crack growth step size) de®nitions. Fig. 3,which is the T resistance curve for this material fore ˆ 0:6 mm (see Fig. 2), shows that T is mesh size independent.Note that the solution using the Da ˆ 0:6 mmmesh re®nement is very coarse, and violates the rule ofthumb discussed in the previous section requiring a bufferzone of two elements for the path de®nition, but still doesFig. 3. T resistance curves for different near-®eld meshre®nementnot deviate much from the converged solutions representedby the Da ˆ 0:1; 0:15 mm solutions in Fig. 3. Alsoobserve from Fig. 3 that T rises up and reaches a saturationvalue at steady state. This is a typical feature of theT resistance curve, and also is observed under creep crackgrowth conditions.Finally, an example illustrating the importance of consideringhistory dependence is presented (Brust,McGowan, and Atluri (1986). An ASTM A508 steel compacttension specimen was loaded beyond crack initiation,then completely unloaded and reloaded. <strong>The</strong> response ofthis specimen was predicted using three different resistancecurves based on J, CTOA, and T . <strong>The</strong> resistancecurves were developed from a generation phase analysis ofanother A508 compact specimen which was not unloaded.<strong>The</strong> J-resistance curve rises continuously, the CTOA resistancecurve starts with a high value and lowers to aconstant value, while the T resistance curve is of the formof Fig. 3, except numerically different since the material isdifferent. <strong>The</strong> unload/reload specimen was analyzed threedifferent times in an application phase prediction to observewhich resistance curve can capture the history dependentdamage caused by the unload/reload cycle. <strong>The</strong>predictions are compared with experimental results in Fig.4. Figure 4 shows that the crack growth reinitiation afterthe unload/reload cycle was accurately predicted using theT methodology since the history of crack growth andunloading is accounted for with T . <strong>The</strong> analyses based onJ or CTOA yielded nonconservative predictions. While thisis a simple example, it was the ®rst which clearly illustratedthe advantages of T compared with the othercurrently accepted fracture parameters. It should bementioned that J and CTOA are still widely used in manyindustries to predict elastic-plastic crack growth. It is timethat T methodology begins to work its way into the applications'arena.5.2Example 2 ± Aircraft fuselage multi-site damage predictions<strong>The</strong> example summarized above represented the ®rst developmentof a practical application procedure and veri-375Fig. 4. Experimental and analytical loadversus crack-growth curves for A508 steel
376®cation of the T -integral methodology. As discussedpreviously, after this work was completed about ten yearsago, there was a lull period of about ®ve years before moreveri®cation work was performed. At present though, alarge amount of work is being performed which is furtherverifying the ability of T to characterize practical fractureproblems where conventional parameters cannot perform.This ongoing work deals with high temperature creepfracture (Brust and co-workers (1994±1995)) and elasticplasticfracture (Atluri and Co-workers (1994±1995)). <strong>The</strong>example discussed in this subsection illustrates one case ofthis veri®cation work for elastic-plastic fracture and residualstrength for a large crack which approaches severalsmaller cracks, while the example in the next subsectionillustrates the performance of T for severe history dependentcreep crack growth. <strong>The</strong> work in this sectionrepresents earlier EPFEAM work using T to predict residualstrength. <strong>The</strong> work presented in the Part III reportuses the new EPFEAM developments to predict residualstrength under MSD conditions. Since this is ongoingwork, we expect a number of additional papers detailingthis in the near future.<strong>The</strong> ®nite element alternating method (FEAM) has seenextensive development and application for both two andthree dimensional single and multiple elastic crack problemsin recent years (see Nishioka and Atluri (1983), Atluri,Harris, Hoggard, Miller, and Sampath (1992) andAtluri, Sampath, and Tong (1991) for some examples). Itcan now be said that FEAM represents the state of the artpractical fracture mechanics analysis methodology sincethe mesh does not have to be modi®ed to directly accountfor the crack. <strong>The</strong> use of the method results in greatlyreduced man hour and computational requirements. <strong>The</strong>method was extended to permit elastic-plastic crackgrowth analyses. <strong>The</strong> original <strong>Elastic</strong> <strong>Plastic</strong> FEAM techniqueis summarized by Pyo, Okada, and Atluri (1994a,1994b), Shenoy, Potyondy, and Atluri (1994), and Singh,Park, and Atluri (1994). <strong>The</strong> new improvements toEPFEAM are discussed in the Part I portion of this reportseries. <strong>The</strong> EPFEAM uses the initial stiffness technique inconjunction with the radial return plasticity algorithm andthe elastic FEAM method to iterate to a solution. <strong>The</strong>method was used to perform the analyses of multisitedamage and to evaluate the effectiveness of the T approach.Multi-site damage is a potential problem in certainmodels of aging commercial and military aircraft. <strong>The</strong>problem consists of a major crack with adjacent smallercracks as illustrated at the top of Figure 5. <strong>The</strong> analysisresults summarized here are for a ¯at panel rather than acurved fuselage. <strong>The</strong> test methodology and results aresummarized in Broek (1993). As illustrated in Fig. 5, six ofthe tests were analyzed; three had single cracks of differentsize (Tests P1 to P3), two (tests P4, P5) had major cracksdifferent size with one adjacent smaller crack at each cracktip (the smaller cracks were of the same size as seen inFig. 5), while test P6 had a major crack with two adjacentequal size cracks at each tip.Only one coarse mesh was developed and used for eachanalysis. This is, of course, one of the major advantages ofthe EPFEAM method. <strong>The</strong> stress-strain relationship wasFig. 5. Crack con®gurations of ¯at panels analyzedmodeled using a Ramberg-Osgood approximation of theproperties of 2024-T3 aluminum alloy. <strong>The</strong> T -Resistancecurve was developed by performing a generation phaseanalysis on specimen P1 which was one of the single crackcases. <strong>The</strong> T -Resistance curve, which is provided by Pyo,Okada, and Atluri (1994), had the characteristic initiationvalue and increase to a saturation value of the type illustratedin Fig. 3. This curve was then used as the resistancecurve for all other ®ve tests in application phase analyses.<strong>The</strong> predicted maximum loads for cases P2 and P3 (seePyo, Okada, and Atluri (1994)) compared very well withthe experimental data. <strong>The</strong> results for cases P4 and P5,which had one MSD crack at each tip, are illustrated inFigs. 6 and 7. It is seen that the predictions compare wellwith the test results for both cases. Again, these predictionsare made using only the T -Resistance curve as thefracture criterion. Finally, the predicted results for the twoMSD cracks adjacent to the main crack (Fig. 8) slightlyover predict the experimental data but are also consideredto be quite good.Again, it is illustrated that T methodology providesgood predictions for the case of MSD cracks. Many othercomparisons of predictions using T theory are made forother multiple crack problems in the cited references andwill appear in pending publications.5.3Example 3 ± History dependent creep crack growthHere we show an example of the behavior of a compacttensionspecimen made of a 9 Cr-1Mo steel which issubjected to a high-temperature (528 °C) load spectrum