AN ALIASING DETECTION ALGORITHM BASED ON SUSPICIOUS ...
AN ALIASING DETECTION ALGORITHM BASED ON SUSPICIOUS ...
AN ALIASING DETECTION ALGORITHM BASED ON SUSPICIOUS ...

You also want an ePaper? Increase the reach of your titles
YUMPU automatically turns print PDFs into web optimized ePapers that Google loves.
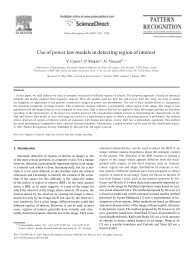
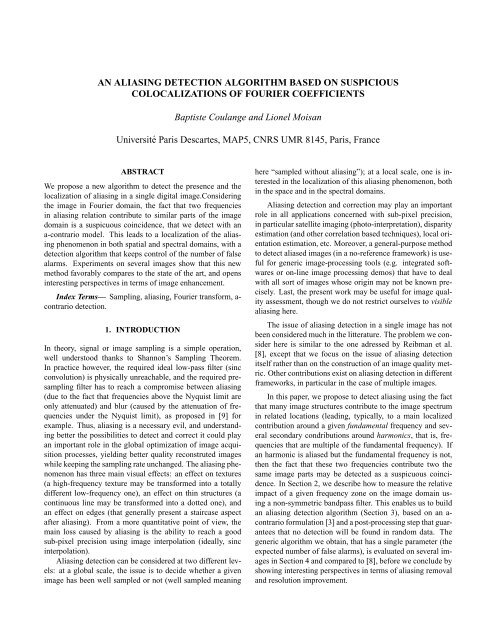
<strong>AN</strong> <strong>ALIASING</strong> <strong>DETECTI<strong>ON</strong></strong> <strong>ALGORITHM</strong> <strong>BASED</strong> <strong>ON</strong> <strong>SUSPICIOUS</strong>COLOCALIZATI<strong>ON</strong>S OF FOURIER COEFFICIENTSBaptiste Coulange and Lionel MoisanUniversité Paris Descartes, MAP5, CNRS UMR 8145, Paris, FranceABSTRACTWe propose a new algorithm to detect the presence and thelocalization of aliasing in a single digital image.Consideringthe image in Fourier domain, the fact that two frequenciesin aliasing relation contribute to similar parts of the imagedomain is a suspicuous coincidence, that we detect with ana-contrario model. This leads to a localization of the aliasingphenomenon in both spatial and spectral domains, with adetection algorithm that keeps control of the number of falsealarms. Experiments on several images show that this newmethod favorably compares to the state of the art, and opensinteresting perspectives in terms of image enhancement.Index Terms— Sampling, aliasing, Fourier transform, a-contrario detection.1. INTRODUCTI<strong>ON</strong>In theory, signal or image sampling is a simple operation,well understood thanks to Shannon’s Sampling Theorem.In practice however, the required ideal low-pass filter (sincconvolution) is physically unreachable, and the required presamplingfilter has to reach a compromise between aliasing(due to the fact that frequencies above the Nyquist limit areonly attenuated) and blur (caused by the attenuation of frequenciesunder the Nyquist limit), as proposed in [9] forexample. Thus, aliasing is a necessary evil, and understandingbetter the possibilities to detect and correct it could playan important role in the global optimization of image acquisitionprocesses, yielding better quality reconstruted imageswhile keeping the sampling rate unchanged. The aliasing phenomenonhas three main visual effects: an effect on textures(a high-frequency texture may be transformed into a totallydifferent low-frequency one), an effect on thin structures (acontinuous line may be transformed into a dotted one), andan effect on edges (that generally present a staircase aspectafter aliasing). From a more quantitative point of view, themain loss caused by aliasing is the ability to reach a goodsub-pixel precision using image interpolation (ideally, sincinterpolation).Aliasing detection can be considered at two different levels:at a global scale, the issue is to decide whether a givenimage has been well sampled or not (well sampled meaninghere “sampled without aliasing”); at a local scale, one is interestedin the localization of this aliasing phenomenon, bothin the space and in the spectral domains.Aliasing detection and correction may play an importantrole in all applications concerned with sub-pixel precision,in particular satellite imaging (photo-interpretation), disparityestimation (and other correlation based techniques), local orientationestimation, etc. Moreover, a general-purpose methodto detect aliased images (in a no-reference framework) is usefulfor generic image-processing tools (e.g. integrated softwaresor on-line image processing demos) that have to dealwith all sort of images whose origin may not be known precisely.Last, the present work may be useful for image qualityassessment, though we do not restrict ourselves to visiblealiasing here.The issue of aliasing detection in a single image has notbeen considered much in the litterature. The problem we considerhere is similar to the one adressed by Reibman et al.[8], except that we focus on the issue of aliasing detectionitself rather than on the construction of an image quality metric.Other contributions exist on aliasing detection in differentframeworks, in particular in the case of multiple images.In this paper, we propose to detect aliasing using the factthat many image structures contribute to the image spectrumin related locations (leading, typically, to a main localizedcontribution around a given fundamental frequency and severalsecondary condributions around harmonics, that is, frequenciesthat are multiple of the fundamental frequency). Ifan harmonic is aliased but the fundamental frequency is not,then the fact that these two frequencies contribute two thesame image parts may be detected as a suspicuous coincidence.In Section 2, we describe how to measure the relativeimpact of a given frequency zone on the image domain usinga non-symmetric bandpass filter. This enables us to buildan aliasing detection algorithm (Section 3), based on an a-contrario formulation [3] and a post-processing step that guaranteesthat no detection will be found in random data. Thegeneric algorithm we obtain, that has a single parameter (theexpected number of false alarms), is evaluated on several imagesin Section 4 and compared to [8], before we conclude byshowing interesting perspectives in terms of aliasing removaland resolution improvement.
2. LOCALIZATI<strong>ON</strong> OF FOURIER COEFFICIENTSLet u : Ω → R be a discrete grey-level image, where Ω ={0, ..., n − 1} 2 is the image domain (we assume that Ω is asquare to simplify notations) and u(x) represents the intensityof a pixel x ∈ Ω. The Discrete Fourier Transform ofu is the complex image û : R → C defined by û(µ) =−2iπ∑x∈Ωu(x) e n where R = Z 2 ∩ [ − n 2 , ) n 22 is thespectral domain. If we want to measure the contribution offrequencies around ξ ∈ R to the reconstruction of u, we canchoose a symmetric localization function g : Z 2 → R andconsider the band-pass filtered imageF g ξ (u)(x) = 1 n 2 ∑µ∈R()g(µ + ξ) + g(µ − ξ) û(µ)e 2iπn ,where we assume that the support of g is small enough toensure that ξ belongs to the setS g = {ξ ∈ R, ∀µ ∈ R, g(µ − ξ) · g(µ + ξ) = 0} .In the following, the functions g we shall use will be indicatorfunctions of squares, centered in 0, but smoother functionscould be used as well. The problem with the imageF g ξ(u) is that by construction, it locally oscillates and cannotbe used directly to measure the importance of the contributionin each pixel. To get rid of this phenomenon, we proposeto use the notion of analytic part, originally introduced forone-dimensional signals by Gabor [4], and then generalizedin several ways to 2D images (e.g. [5]). In the case we consider,this leads to the followingDefinition 1. The analytic part of an image u associated to awindow (ξ, g) isu g ξ (x) = 1 n 2 ∑µ∈Rg(µ + ξ) û(µ) e 2iπn .The interest of considering the analytic part u g ξis that itsreal part is exactly the band-pass filtering (F g ξ (u) = Re(ug ξ )),but its modulus |u g ξ| measures the amplitude of the oscillations,that bounds |F g ξ(u)| from above everywhere. The differenceis illustrated on Fig. 1. Notice by the way that thesquare modulus of the analytic part is expected to be verysmooth, because g has a small support. Indeed, if supp (g) ⊂[−k, k − 1] 2 , then∀ξ ∈ S g , supp ̂|u g ξ |2 ⊂ [−2k, 2k − 1] 2 .3. DETECTING <strong>SUSPICIOUS</strong> COLOCALIZATI<strong>ON</strong>SIn this section, we build an aliasing detection algorithm thatconsists in two steps. To simplify the analysis, we considerthe simplest case of aliasing, with a subsampling factor of 2,Fig. 1. Analytic part. Images a and b have the same Fouriermodulus (represented in c), but image b has random phases.Image d corresponds to image a after a passband filter whosespectral support is localized in squares 1 and 1 ′ . Image e(resp. f) is the modulus of the analytic part of a (resp. b),corresponding to square 1 alone. All Fourier visualizations inthis article are treated by the periodic plus smooth decompositionto avoid periodization artifacts [7].but hypotheses on the initial spectral domain corresponding toQuincunx sampling [6] as in SPOT 5 sattelite. In this configuration,the aliasing phenomenon has the property that eachFourier coefficient of the sampled image can be writtenû(ξ) = ˆv(ξ) + ˆv(H(ξ/2)),where v is the original image (before sampling) and H is theone-to-one function that associates to an observed frequencyξ ∈ R the unique alias of 2ξ in R modulo R (see Fig. 2).Fig. 2. The quincunx hypothesis consists in assuming thatthe original image spectrum is null in the darkest regionabove. After a subsampling by a factor 2, each frequencyof the final spectral domain (in white) is corrupted by a singlealiased frequency coming from the “aliasing source” domain.The first step of aliasing detection consists in findingfrequencies ξ for which the energy of the maps |u g ξ |2 and|u g H(ξ) |2 are localized spatially in similar domains. To thataim, we use the following
Definition 2. Given a 2D shift vector η ∈ Z 2 , We define theanalytic correlation map associated to a frequency window(g, ξ) as the functionη ∈ Z 2 ↦→ C g,ξ (η) = ∑ ∣∣∣u g ∣∣ξ (x) · ug H(ξ) (x − η) 2,x∈Ωwith the convention that all analytic parts are Ω-periodic.Now considerig the smallest shift(s) η 0 (for the |·| ∞ norm)for which the Ω-periodic function η ↦→ C g (ξ, η) attains itsmaximum value, we define r(ξ) = |η 0 | ∞ , and propose to usean a-contrario model [3] to detect small values of r(ξ) againstthe null hypothesis (H 0 ) that all possible n 2 locations of ηare equally likely. In this framework, we detect aliasing as acontradiction of H 0 , with the statistical test NF A(w) ≤ ε,whereNF A(w) = |W | · r(ξ)2n 2 ,w = (ξ, g) is a frequency window (associated to a centralfrequency ξ and a localization function g), and W the set ofall such windows we test (we shall comment on the choice ofW later). This definition ensures that NF A is a number offalse alarms, in the following sense:Proposition 1. If u is a random image such that the probabilityof any considered analytic correlation map is invariantunder periodic translation, then the expectation of the numberof windows w ∈ W such that NF A(w) ≤ ε is less than ε.Note that the hypothesis we make in Proposition 1 appliesin particular to the case when U is a random phase image, thatis, an image whose Fourier transform has a known modulusand random uniform independent phases (up to the symmetryconstraint).The a-contrario model above detects suspicious colocalizationbetween Fourier zones in aliasing relation (in the sensethat they contradict the H 0 hypothesis), but the detection ofsome windows may be caused by something else than aliasing(for example textured zones with a rich and isotropic spectralcontent). In order to get rid of these undesired detections, wehence propose a post-processing step. It consists in selecting,among the windows detected in the first step, only those forwhich the maximum value of the analytic correlation map inthe domain [−r(ξ), r(ξ)] 2 does not increase when consideringother central frequencies ξ ′ that could be in aliasing relationwith H(ξ) for a different sampling rate. It is not difficultto see that the corresponding frequencies all belong to a vertical(or horizontal) line passing through ξ.In the end, the two-steps aliasing detection algorithm wejust presented yields, if the image is detected as aliased, a certainnumber of square windows in Fourier domain. Let us callaliasing zone any connected component of the union of thesewindows. For each aliasing zone, we define a normalized correlationimage (with maximum value equal to 1), that can beused as a mask in spatial domain, both to evaluate the aliasedpart of the image domain, and to try to reverse the aliasingprocess, as shown in Section 4.The algorithm we implemented uses windows defined byindicator functions of squares whose sidelength are of thekind 13 + 6k, k = 0..5. For each window size, we chosewindow locations in order to ensure an overlap of half a windowfor adjacent windows. The detection threshold on theNFA function was, as usually done, set to 1.4. PERFORM<strong>AN</strong>CE RESULTSWe tested the proposed algorithm on several images, in twodifferent situations. On the one hand, we produced “wellsampled”images by reducing the original 512 × 512 imagesto 256 × 256 with a perfect low-pass filter (hard frequencycut-off). On the other hand, we cleared the highest frequencies(dark zone in Fig. 2) of the original 512×512 images, andsampled them by a factor two to produce “quincunx-aliased”images. These two series of images were then analyzed separately,both with the SAM method [8] and ours. The resultsare reported in Table 1.image well-sampled aliasednd SAM nd % S % F SAMpipe 0 25.3 3 16.2 2.9 23.0barbara 1 19.2 10 1.6 5.4 18.4lena 0 16.6 2 7.2 1.3 16.4harbor [8] 0 18.1 8 1.5 5.5 16.1bridge [8] 0 17.1 5 11.2 1.6 15.2boat 0 15.5 7 4.3 10.4 15.1butokai 0 20.5 34 7.1 12.8 14.7Table 1. Results of aliasing detection. The algorithm wepropose is compared to [8] on several images, in the case ofwell-sampled images and in the case of aliased images generatedby subsampling. For the method we propose, “nd” correspondsto the number of detected aliased windows, “%S”is the relative area of the aliased spatial domain, and “%F ” isthe relative area of the aliased spectral domain.These results call for several comments. First, as expected,we did not detect aliasing for well-sampled imagesexcept for the barbara image that present a very special texturemade of two fundamental frequencies in aliasing relation.Moreover, all aliased images we considered were systematicallydetected as such. However, considering the smallnumber of detections for some of them (in particular pipeand lena), one could probably select parts of these images forwhich no aliasing would be detected. The method we proposeoffers several advantages compared to [8]. First, if tries toanswer to the question “Does this image contains aliasing?”,while Reibman et al. give an aliasing metric that is difficultto interpret on an absolute scale (though, as can be noticed inTable 1, their metric systematically decreases when aliasingis introduced). Another advantage of the method we propose
is that it also permits to localize aliasing both in the frequencydomain (Fig. 3) and in the spatial domain (Fig. 4).As another validation test, we also tested the present algorithmon the caps image from the LIVE database [10]. Wedetected aliasing on several places, and in particular on theright border of the up-left cap, exactly in the zone found by acompletely different method [1].In Fig. 5, we used the normalized correlation image definedat the end of Section 3 to enhance two aliased images,by reversing (with a spectral translation) the aliasing processon the analytic parts that were detected as aliased. This imageenhancement algorithm is only a preliminary work that is notable to remove aliasing completely (even in the zone wherealiasing is detected), but it open interesting perspectives forpossible continuations of this work.Fig. 5. Aliasing correction. First row: parts of two aliasedimages, the Nimes CNES image (left) and the butokai image.Second row: image obtained after detecting aliasing andtranslating back aliased frequency components in their estimatedoriginal places.perspectives in terms of aliasing removal and resolution enhancement.6. REFERENCESFig. 3. Spectral aliasing detection. Fourier spectrum of thewell-sampled version (left) and the aliased version (right) ofthe butokai image, superimposed with the detected aliased domains(“A” zone).Fig. 4. The butokai image (left) and the spatial localization ofthe detected aliasing (in black on the right).5. C<strong>ON</strong>CLUSI<strong>ON</strong>We presented a new generic algorithm to detect aliasing in adigital image without access to a reference image. The proposedmethod achieves good detection results on artificiallyaliased images, while generally avoiding false detection onwell sampled ones. It also permits to localize the aliasingphenomenon, both in the spatial and in the spectral domains.The new theoretical approach we introduced to detect suspicuousco-localization of Fourier coefficients brings interesting[1] G. Blanchet, L. Moisan, B. Rougé, “Automatic detectionof well sampled images via a new ringing measure”,preprint MAP5, to appear in proc of ICASSP, 2010.[2] I. Daubechies, “Ten lectures on wavelets’, Society forIndustrial and Applied Mathematics, 1992.[3] A. Desolneux, L. Moisan, J.M. Model “From gesalttheory to image analysis, a probabilistic approach”,Springer, 2008.[4] D. Gabor, “Theory of communication”, Journal ofIEEE,vol. 93, pp. 429- 457, 1946.[5] J.W. Havlicek and A.C. Bovik “The Analytic Image”,Int. Conf. of Image Processing, vol 2 pp.446-449, 1997.[6] C. Latry, B. Rougé, “Super resolution: quincunx samplingand fusion processing”, Int. Geoscience and RemoteSensing Symposium, 2003.[7] L. Moisan, “Periodic plus smooth image decomposition’,preprint MAP5, 2009.[8] A. R. Reibman, S. Suthaharan, “A no-reference spatialaliasing measure for digital image resizing”, IEEE Int.Conf. on Image Processing pp. 1184-1187, 2008.[9] A. Said, “A new class of filters for image interpolationand resizing”, IEEE Int. Conf. on Image processing vol.4 pp. 217-220, 2007.[10] H.R. Sheikh, Z.Wang, L. Cormack, A.C. Bovik,“LIVE image quality assessment database release 2”,http://live.ece.utexas.edu/research/quality.