Tech Mahindra - The Smart Investor
Tech Mahindra - The Smart Investor
Tech Mahindra - The Smart Investor

Create successful ePaper yourself
Turn your PDF publications into a flip-book with our unique Google optimized e-Paper software.
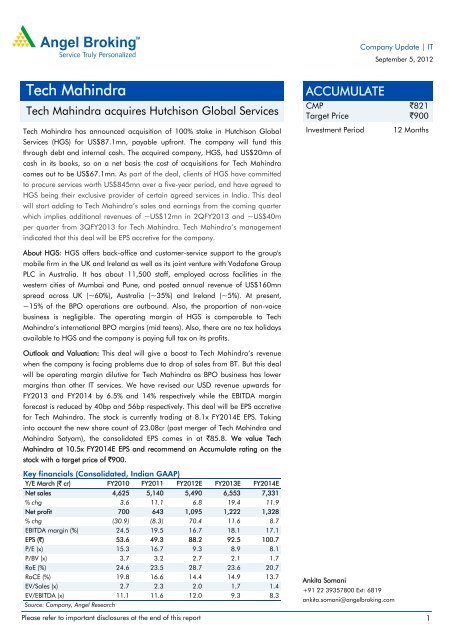
Company Update | ITSeptember 5, 2012<strong>Tech</strong> <strong>Mahindra</strong><strong>Tech</strong> <strong>Mahindra</strong> acquires Hutchison Global Services<strong>Tech</strong> <strong>Mahindra</strong> has announced acquisition of 100% stake in Hutchison GlobalServices (HGS) for US$87.1mn, payable upfront. <strong>The</strong> company will fund thisthrough debt and internal cash. <strong>The</strong> acquired company, HGS, had US$20mn ofcash in its books, so on a net basis the cost of acquisitions for <strong>Tech</strong> <strong>Mahindra</strong>comes out to be US$67.1mn. As part of the deal, clients of HGS have committedto procure services worth US$845mn over a five-year period, and have agreed toHGS being their exclusive provider of certain agreed services in India. This dealwill start adding to <strong>Tech</strong> <strong>Mahindra</strong>’s sales and earnings from the coming quarterwhich implies additional revenues of ~US$12mn in 2QFY2013 and ~US$40mper quarter from 3QFY2013 for <strong>Tech</strong> <strong>Mahindra</strong>. <strong>Tech</strong> <strong>Mahindra</strong>’s managementindicated that this deal will be EPS accretive for the company.About HGS: HGS offers back-office and customer-service support to the group'smobile firm in the UK and Ireland as well as its joint venture with Vodafone GroupPLC in Australia. It has about 11,500 staff, employed across facilities in thewestern cities of Mumbai and Pune, and posted annual revenue of US$160mnspread across UK (~60%), Australia (~35%) and Ireland (~5%). At present,~15% of the BPO operations are outbound. Also, the proportion of non-voicebusiness is negligible. <strong>The</strong> operating margin of HGS is comparable to <strong>Tech</strong><strong>Mahindra</strong>’s international BPO margins (mid teens). Also, there are no tax holidaysavailable to HGS and the company is paying full tax on its profits.ACCUMULATECMPTarget PriceInvestment Period`821`90012 MonthsOutlook and Valuation: This deal will give a boost to <strong>Tech</strong> <strong>Mahindra</strong>’s revenuewhen the company is facing problems due to drop of sales from BT. But this dealwill be operating margin dilutive for <strong>Tech</strong> <strong>Mahindra</strong> as BPO business has lowermargins than other IT services. We have revised our USD revenue upwards forFY2013 and FY2014 by 6.5% and 14% respectively while the EBITDA marginforecast is reduced by 40bp and 56bp respectively. This deal will be EPS accretivefor <strong>Tech</strong> <strong>Mahindra</strong>. <strong>The</strong> stock is currently trading at 8.1x FY2014E EPS. Takinginto account the new share count of 23.08cr (post merger of <strong>Tech</strong> <strong>Mahindra</strong> and<strong>Mahindra</strong> Satyam), the consolidated EPS comes in at `85.8. We value <strong>Tech</strong><strong>Mahindra</strong> at 10.5x FY2014E EPS and recommend an Accumulate rating on thestock with a target price of `900.Key financials (Consolidated, Indian GAAP)Y/E March (` cr) FY2010 FY2011 FY2012E FY2013E FY2014ENet sales 4,625 5,140 5,490 6,553 7,331% chg 3.6 11.1 6.8 19.4 11.9Net profit 700 643 1,095 1,222 1,328% chg (30.9) (8.3) 70.4 11.6 8.7EBITDA margin (%) 24.5 19.5 16.7 18.1 17.1EPS (`) 53.6 49.3 88.2 92.5 100.7P/E (x) 15.3 16.7 9.3 8.9 8.1P/BV (x) 3.7 3.2 2.7 2.1 1.7RoE (%) 24.6 23.5 28.7 23.6 20.7RoCE (%) 19.8 16.6 14.4 14.9 13.7EV/Sales (x) 2.7 2.3 2.0 1.7 1.4EV/EBITDA (x) 11.1 11.6 12.0 9.3 8.3Source: Company, Angel ResearchAnkita Somani+91 22 39357800 Ext: 6819ankita.somani@angelbroking.comPlease refer to important disclosures at the end of this report 1
Company Update | <strong>Tech</strong> <strong>Mahindra</strong>Profit and loss statement (Consolidated, Indian GAAP)Y/E March (` cr) FY2010 FY2011 FY2012 FY2013E FY2014ENet sales 4,625 5,140 5,490 6,553 7,331Cost of revenues 2,871 3,403 3,678 4,357 5,018Gross profit 1,754 1,737 1,811 2,197 2,314% of net sales 37.9 33.8 33.0 33.5 31.6SG&A expenses 622 734 892 1,011 1,063% of net sales 13.4 14.3 16.3 15.4 14.5EBITDA 1,133 1,003 919 1,186 1,251% of net sales 24.5 19.5 16.7 18.1 17.1Dep. and amortization 134 144 161 192 213% of net sales 2.9 2.8 2.9 2.9 2.9EBIT 999 860 758 993 1,038% of net sales 21.6 16.7 13.8 15.2 14.2Interest expense 218 100 103 77 53Other income, net of forex 75 117 98 72 147Profit before tax 856 877 753 988 1,132Provision for tax 144 132 144 241 289% of PBT 16.8 15.0 19.1 24.4 25.5Recurring PAT 712 746 610 747 843Share from associates 44 557 475 485Exceptional item (9) (143) (68) - -Minority interest 3 4 4 - -Profit aft minority interest 700 643 1,095 1,222 1,328Adjusted PAT 709 786 1,163 1,222 1,328Fully diluted EPS (`) 53.6 49.3 88.2 92.5 100.7September 5, 2012 3
Company Update | <strong>Tech</strong> <strong>Mahindra</strong>Balance sheet (Consolidated, Indian GAAP)Y/E March (` cr) FY2010 FY2011 FY2012E FY2013E FY2014EEquity capital 122 126 128 128 128Preference capital - - - - -Share premium 237 233 270 270 270Profit and loss 1,783 2,365 2,998 4,134 5,369Other reserves 744 627 655 655 655Net worth 2,887 3,351 4,051 5,187 6,422Secured loans 750 - - - -Unsecured loans 1,385 1,223 600 841 591Total debt 2,135 1,223 600 841 591Deferred revenue 584 618 621 538Minority interest 14 16 - - -Total capital employed 5,035 5,174 5,269 6,649 7,551Gross block 1,131 1,273 1,514 1,900 2,100Accumulated depreciation (527) (670) (832) (1,024) (1,237)Net block 604 602 683 876 863Capital WIP 321 125 167 217 267Total fixed assets 925 727 850 1,093 1,130Investments 3,015 2,908 3,587 4,169 4,443Deferred tax asset, net 28 64 100 140 170Inventories 1 - 0 - -Sundry debtors 1,042 1,247 1,317 1,472 1,627Cash and cash equivalents 219 267 242 538 920Loans and advances 673 832 823 1,049 1,100Sundry creditors (461) (510) (365) (500) (583)Other liabilities (129) (53) (608) (525) (375)Provision (277) (308) (677) (786) (880)Working capital 1,068 1,474 732 1,247 1,808Total capital deployed 5,035 5,174 5,269 6,649 7,551September 5, 2012 4
Company Update | <strong>Tech</strong> <strong>Mahindra</strong>Cash flow statement (Consolidated, Indian GAAP)Y/E March (` cr)FY2010 FY2011 FY2012E FY2013E FY2014EPre tax profit from operations 780 760 655 916 985Depreciation 134 144 161 192 213Expenses (deferred)/written off/others (9) (99) 557 475 485Pre tax cash from operations 906 804 1,374 1,584 1,682Other income/prior period ad 73 114 95 72 147Net cash from operations 978 918 1,468 1,655 1,830Tax (144) (132) (144) (241) (289)Cash profits 834 786 1,324 1,414 1,541(Inc)/dec inSundry debtors (140) (205) (70) (155) (155)Inventories (0) 1 (0) 0 -Loans and advances (377) (160) 9 (226) (51)Sundry creditors (8) 49 (145) 135 83Others (14) (45) 924 26 (57)Net trade working capital (539) (358) 718 (219) (179)Cashflow from operating activities 295 428 2,042 1,195 1,362(Inc)/dec in fixed assets (407) 54 (284) (436) (250)(Inc)/dec in investments (2,580) 107 (679) (582) (274)(Inc)/dec in deferred tax asset, net (8) (36) (36) (40) (30)Cashflow from investing activities (2,995) 125 (999) (1,057) (554)Inc/(dec) in debt 2,135 (912) (623) 241 (250)Inc/(dec) in deferred revenue 584 34 2 (83)Inc/(dec) in equity/premium 5 (0) 39 - -Inc/(dec) in minority interest 3 2 (16) - -Addition to reserves on amalgamation 288 (117) (420) - -Dividends (50) (61) (82) (86) (93)Cashflow from financing activities 2,381 (504) (1,068) 158 (426)Cash generated/(utilized) (320) 48 (25) 296 382Cash at start of the year 538 219 267 242 538Cash at end of the year 219 267 242 538 920September 5, 2012 5
Company Update | <strong>Tech</strong> <strong>Mahindra</strong>Key Ratios (Consolidated, Indian GAAP)Y/E March FY2010 FY2011 FY2012E FY2013E FY2014EValuation ratio (x)P/E (on FDEPS) 15.3 16.7 9.3 8.9 8.1P/CEPS 12.8 13.6 8.6 7.7 7.0P/BVPS 3.7 3.2 2.7 2.1 1.7Dividend yield (%) 0.4 0.5 0.5 0.5 0.5EV/Sales 2.7 2.3 2.0 1.7 1.4EV/EBITDA 11.1 11.6 12.0 9.3 8.3EV/Total assets 13.6 16.0 13.0 10.1 9.2Per share data (`)EPS (Fully diluted) 53.6 49.3 88.2 92.5 100.7Cash EPS 64.0 60.3 95.3 107.2 116.9Dividend 3.3 4.0 4.0 4.0 4.0Book value 221.4 257.0 307.2 393.4 487.0Dupont analysisTax retention ratio (PAT/PBT) 0.8 0.9 1.5 1.2 1.2Cost of debt (PBT/EBIT) 0.9 1.0 1.0 1.0 1.1EBIT margin (EBIT/Sales) 0.2 0.2 0.1 0.2 0.1Asset turnover ratio (Sales/Assets) 5.0 7.1 6.5 6.0 6.5Leverage ratio (Assets/Equity) 0.3 0.2 0.2 0.2 0.2Operating ROE (%) 24.7 22.3 27.0 23.6 20.7Return ratios (%)RoCE (pre-tax) 19.8 16.6 14.4 14.9 13.7Angel RoIC 22.2 18.0 15.6 16.9 16.3RoE 24.6 23.5 28.7 23.6 20.7Turnover ratios( x)Asset turnover (fixed assets) 5.0 7.1 6.5 6.0 6.5Receivables days 77 81 81 82 81Payable days 49 43 35 34 35September 5, 2012 6
Company Update | <strong>Tech</strong> <strong>Mahindra</strong>Research Team Tel: 022 - 39357800 E-mail: research@angelbroking.com Website: www.angelbroking.comDISCLAIMERThis document is solely for the personal information of the recipient, and must not be singularly used as the basis of any investmentdecision. Nothing in this document should be construed as investment or financial advice. Each recipient of this document should makesuch investigations as they deem necessary to arrive at an independent evaluation of an investment in the securities of the companiesreferred to in this document (including the merits and risks involved), and should consult their own advisors to determine the merits andrisks of such an investment.Angel Broking Limited, its affiliates, directors, its proprietary trading and investment businesses may, from time to time, makeinvestment decisions that are inconsistent with or contradictory to the recommendations expressed herein. <strong>The</strong> views contained in thisdocument are those of the analyst, and the company may or may not subscribe to all the views expressed within.Reports based on technical and derivative analysis center on studying charts of a stock's price movement, outstanding positions andtrading volume, as opposed to focusing on a company's fundamentals and, as such, may not match with a report on a company'sfundamentals.<strong>The</strong> information in this document has been printed on the basis of publicly available information, internal data and other reliablesources believed to be true, but we do not represent that it is accurate or complete and it should not be relied on as such, as thisdocument is for general guidance only. Angel Broking Limited or any of its affiliates/ group companies shall not be in any wayresponsible for any loss or damage that may arise to any person from any inadvertent error in the information contained in this report.Angel Broking Limited has not independently verified all the information contained within this document. Accordingly, we cannot testify,nor make any representation or warranty, express or implied, to the accuracy, contents or data contained within this document. WhileAngel Broking Limited endeavours to update on a reasonable basis the information discussed in this material, there may be regulatory,compliance, or other reasons that prevent us from doing so.This document is being supplied to you solely for your information, and its contents, information or data may not be reproduced,redistributed or passed on, directly or indirectly.Angel Broking Limited and its affiliates may seek to provide or have engaged in providing corporate finance, investment banking orother advisory services in a merger or specific transaction to the companies referred to in this report, as on the date of this report or inthe past.Neither Angel Broking Limited, nor its directors, employees or affiliates shall be liable for any loss or damage that may arise from or inconnection with the use of this information.Note: Please refer to the important `Stock Holding Disclosure' report on the Angel website (Research Section). Also, please refer to thelatest update on respective stocks for the disclosure status in respect of those stocks. Angel Broking Limited and its affiliates may haveinvestment positions in the stocks recommended in this report.Disclosure of Interest Statement<strong>Tech</strong> <strong>Mahindra</strong>1. Analyst ownership of the stock No2. Angel and its Group companies ownership of the stock No3. Angel and its Group companies' Directors ownership of the stock No4. Broking relationship with company covered NoNote: We have not considered any Exposure below ` 1 lakh for Angel, its Group companies and DirectorsRatings (Returns): Buy (> 15%) Accumulate (5% to 15%) Neutral (-5 to 5%)Reduce (-5% to 15%) Sell (< -15%)September 5, 2012 7
Company Update | <strong>Tech</strong> <strong>Mahindra</strong>6 th Floor, Ackruti Star, Central Road, MIDC, Andheri (E), Mumbai- 400 093. Tel: (022) 39357800Research TeamFundamental:Sarabjit Kour Nangra VP-Research, Pharmaceutical sarabjit@angelbroking.comVaibhav Agrawal VP-Research, Banking vaibhav.agrawal@angelbroking.comBhavesh Chauhan Sr. Analyst (Metals & Mining) bhaveshu.chauhan@angelbroking.comSharan Lillaney Analyst (Mid-cap) sharanb.lillaney@angelbroking.comV Srinivasan Analyst (Cement, Power, FMCG) v.srinivasan@angelbroking.comYaresh Kothari Analyst (Automobile) yareshb.kothari@angelbroking.comNitin Arora Analyst (Infra) nitin.arora@angelbroking.comAnkita Somani Analyst (IT, Telecom) ankita.somani@angelbroking.comVarun Varma Analyst (Banking) varun.varma@angelbroking.comSaurabh Taparia Analyst (Banking) sourabh.taparia@angelbroking.comRahul Kaul Analyst (Cap Goods, Real Estate) rahul.kaul@angelbroking.comBhupali Gursale Economist bhupali.gursale@angelbroking.comVinay Rachh Research Associate vinay.rachh@angelbroking.comAmit Patil Research Associate amit.patil@angelbroking.comShareen Batatawala Research Associate shareen.batatawala@angelbroking.comTwinkle Gosar Research Associate gosar.twinkle@angelbroking.comTejashwini Kumari Research Associate tejashwini.kumari@angelbroking.com<strong>Tech</strong>nicals:Shardul Kulkarni Sr. <strong>Tech</strong>nical Analyst shardul.kulkarni@angelbroking.comSameet Chavan <strong>Tech</strong>nical Analyst sameet.chavan@angelbroking.comSacchitanand Uttekar <strong>Tech</strong>nical Analyst sacchitanand.uttekar@angelbroking.comDerivatives:Siddarth Bhamre Head - Derivatives siddarth.bhamre@angelbroking.comInstitutional Sales Team:Mayuresh Joshi VP - Institutional Sales mayuresh.joshi@angelbroking.comHiten Sampat Sr. A.V.P- Institution sales hiten.sampat@angelbroking.comMeenakshi Chavan Dealer meenakshis.chavan@angelbroking.comGaurang Tisani Dealer gaurangp.tisani@angelbroking.comAkshay Shah Sr. Executive akshayr.shah@angelbroking.comProduction Team:Tejas Vahalia Research Editor tejas.vahalia@angelbroking.comDilip Patel Production dilipm.patel@angelbroking.comAngel Broking Ltd: BSE Sebi Regn No : INB 010996539 / CDSL Regn No: IN - DP - CDSL - 234 - 2004 / PMS Regn Code: PM/INP000001546 Angel Securities Ltd:BSE: INB010994639/INF010994639 NSE: INB230994635/INF230994635 Membership numbers: BSE 028/NSE:09946Angel Capital & Debt Market Ltd: INB 231279838 / NSE FNO: INF 231279838 / NSE Member code -12798 Angel Commodities Broking (P) Ltd: MCX Member ID: 12685 / FMC Regn No: MCX / TCM / CORP / 0037 NCDEX : Member ID 00220 / FMC Regn No: NCDEX / TCM / CORP / 0302September 5, 2012 8