Aurobindo Pharma - The Smart Investor
Aurobindo Pharma - The Smart Investor
Aurobindo Pharma - The Smart Investor
You also want an ePaper? Increase the reach of your titles
YUMPU automatically turns print PDFs into web optimized ePapers that Google loves.
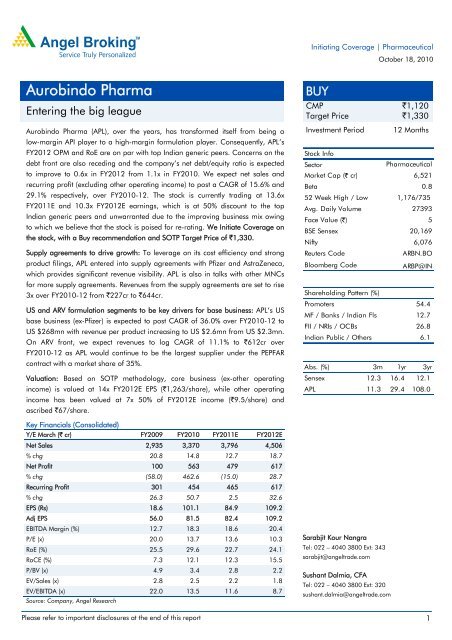
<strong>Aurobindo</strong> <strong>Pharma</strong><br />
Entering the big league<br />
<strong>Aurobindo</strong> <strong>Pharma</strong> (APL), over the years, has transformed itself from being a<br />
low-margin API player to a high-margin formulation player. Consequently, APL’s<br />
FY2012 OPM and RoE are on par with top Indian generic peers. Concerns on the<br />
debt front are also receding and the company’s net debt/equity ratio is expected<br />
to improve to 0.6x in FY2012 from 1.1x in FY2010. We expect net sales and<br />
recurring profit (excluding other operating income) to post a CAGR of 15.6% and<br />
29.1% respectively, over FY2010-12. <strong>The</strong> stock is currently trading at 13.6x<br />
FY2011E and 10.3x FY2012E earnings, which is at 50% discount to the top<br />
Indian generic peers and unwarranted due to the improving business mix owing<br />
to which we believe that the stock is poised for re-rating. We Initiate Coverage on<br />
the stock, with a Buy recommendation and SOTP Target Price of `1,330.<br />
Supply agreements to drive growth: To leverage on its cost efficiency and strong<br />
product filings, APL entered into supply agreements with Pfizer and AstraZeneca,<br />
which provides significant revenue visibility. APL is also in talks with other MNCs<br />
for more supply agreements. Revenues from the supply agreements are set to rise<br />
3x over FY2010-12 from `227cr to `644cr.<br />
US and ARV formulation segments to be key drivers for base business: APL’s US<br />
base business (ex-Pfizer) is expected to post CAGR of 36.0% over FY2010-12 to<br />
US $268mn with revenue per product increasing to US $2.6mn from US $2.3mn.<br />
On ARV front, we expect revenues to log CAGR of 11.1% to `612cr over<br />
FY2010-12 as APL would continue to be the largest supplier under the PEPFAR<br />
contract with a market share of 35%.<br />
Valuation: Based on SOTP methodology, core business (ex-other operating<br />
income) is valued at 14x FY2012E EPS (`1,263/share), while other operating<br />
income has been valued at 7x 50% of FY2012E income (`9.5/share) and<br />
ascribed `67/share.<br />
Key Financials (Consolidated)<br />
Y/E March (` cr) FY2009 FY2010 FY2011E FY2012E<br />
Net Sales 2,935 3,370 3,796 4,506<br />
% chg 20.8 14.8 12.7 18.7<br />
Net Profit 100 563 479 617<br />
% chg (58.0) 462.6 (15.0) 28.7<br />
Recurring Profit 301 454 465 617<br />
% chg 26.3 50.7 2.5 32.6<br />
EPS (Rs) 18.6 101.1 84.9 109.2<br />
Adj EPS 56.0 81.5 82.4 109.2<br />
EBITDA Margin (%) 12.7 18.3 18.6 20.4<br />
P/E (x) 20.0 13.7 13.6 10.3<br />
RoE (%) 25.5 29.6 22.7 24.1<br />
RoCE (%) 7.3 12.1 12.3 15.5<br />
P/BV (x) 4.9 3.4 2.8 2.2<br />
EV/Sales (x) 2.8 2.5 2.2 1.8<br />
EV/EBITDA (x) 22.0 13.5 11.6 8.7<br />
Source: Company, Angel Research<br />
Initiating Coverage | <strong>Pharma</strong>ceutical<br />
October 18, 2010<br />
BUY<br />
CMP `1,120<br />
Target Price `1,330<br />
Investment Period 12 Months<br />
Stock Info<br />
Sector<br />
Market Cap (` cr)<br />
Beta<br />
52 Week High / Low<br />
Avg. Daily Volume<br />
Face Value (`)<br />
BSE Sensex<br />
Nifty<br />
Reuters Code<br />
Bloomberg Code<br />
<strong>Pharma</strong>ceutical<br />
6,521<br />
0.8<br />
1,176/735<br />
27393<br />
5<br />
20,169<br />
6,076<br />
ARBN.BO<br />
ARBP@IN<br />
Shareholding Pattern (%)<br />
Promoters 54.4<br />
MF / Banks / Indian Fls 12.7<br />
FII / NRIs / OCBs 26.8<br />
Indian Public / Others 6.1<br />
Abs. (%) 3m 1yr 3yr<br />
Sensex 12.3 16.4 12.1<br />
APL 11.3 29.4 108.0<br />
Sarabjit Kour Nangra<br />
Tel: 022 – 4040 3800 Ext: 343<br />
sarabjit@angeltrade.com<br />
Sushant Dalmia, CFA<br />
Tel: 022 – 4040 3800 Ext: 320<br />
sushant.dalmia@angeltrade.com<br />
Please refer to important disclosures at the end of this report 1
Exhibit 1: Net Sales, OPM and Recurring PAT (ex other OI) trend<br />
(` cr)<br />
5,000<br />
4,000<br />
3,000<br />
2,000<br />
1,000<br />
0<br />
1,600<br />
271<br />
2,122<br />
694<br />
1,330 1,429 1,431 1,538 1,518 1,523 1,506<br />
Source: Company, Angel Research<br />
2,430<br />
999<br />
2,935<br />
1,397<br />
1,852<br />
<strong>Aurobindo</strong> <strong>Pharma</strong> | Initiating Coverage<br />
Initiate Coverage with a Buy and Target Price of `1,330<br />
Recurring earnings (ex other OI) to post CAGR of 29.1%<br />
Net sales are estimated to log a CAGR of 15.6% to `4,506cr over FY2010-12 on<br />
back of supply agreements, the US (ex-Pfizer) and ARV formulation contracts. We<br />
expect APL’s recurring earnings (excluding other operating income) to post a<br />
CAGR of 29.1% over FY2010-12 to `506cr on the back of sales growth and OPM<br />
expansion. We estimate OPM to increase by 206bp to 20.4% during the<br />
mentioned period.<br />
2,273<br />
3,000<br />
FY2006 FY2007 FY2008 FY2009 FY2010 FY2011E FY2012E<br />
API Formulations<br />
3,370<br />
3,796<br />
4,506<br />
APL aims to clock US $2bn in FY2014<br />
APL expects to clock strong CAGR of 29.4% in top-line to US $2bn by FY2014<br />
from US $713mn in FY2010. <strong>The</strong> company expects contribution from the<br />
formulations segment to ramp up to 75% by FY2014 from current levels of 55%.<br />
Exhibit 2: APL’s revenue target<br />
(US $mn)<br />
2400<br />
2000<br />
1600<br />
1200<br />
800<br />
400<br />
0<br />
Source: Company, Angel Research<br />
Our estimates are lower than company’s long term guidance as we expect growth<br />
to be more back-ended for the company driven by US (injectables and controlled<br />
substances) and supply agreements.<br />
October 18, 2010 2<br />
(` cr)<br />
600<br />
500<br />
400<br />
300<br />
200<br />
100<br />
0<br />
67<br />
189<br />
230<br />
169<br />
304<br />
355<br />
506<br />
FY2006 FY2007 FY2008 FY2009 FY2010 FY2011E FY2012E<br />
Recurring PAT OPM<br />
713<br />
48 15<br />
328<br />
322<br />
CAGR 29.4%<br />
69.9<br />
79.7<br />
27.8<br />
11.6<br />
2,000<br />
125<br />
500<br />
875<br />
500<br />
FY2010 FY2014<br />
API Formulations Supply Agreements Injectable business<br />
25.0<br />
20.0<br />
15.0<br />
10.0<br />
5.0<br />
0.0<br />
(%)
APL stock poised for re-rating<br />
<strong>Aurobindo</strong> <strong>Pharma</strong> | Initiating Coverage<br />
APL has moved up the value chain and transformed from being a<br />
low-margin API player to a high-margin formulations player. Consequently,<br />
contribution from the formulation segment to net sales is expected to increase from<br />
55% in FY2010 to 67% in FY2012. Moreover, APL’s FY2012 OPM and RoE are<br />
in-line with top Indian generic players. <strong>The</strong> debt concerns are also receding with<br />
the company’s net debt/equity ratio expected to improve to 0.6x in FY2012 from<br />
1.1x in FY2010. At current levels the stock is trading at 13.6x FY2011E and 10.3x<br />
FY2012E earnings, which is at 50% discount to the top Indian generic peers and<br />
unwarranted due to the improving business mix owing to which we believe that it is<br />
poised for re-rating.<br />
Exhibit 3: OPM and RoE comparison (FY2012)<br />
Source: Company, Angel Research. Note: Sector includes Cadila, Cipla, DRL, Lupin, Ranbaxy and<br />
Sun <strong>Pharma</strong><br />
Valuation<br />
Exhibit 4: 1-year forward PE and EV/Sales band<br />
(`)<br />
2,200<br />
2,000<br />
1,800<br />
1,600<br />
1,400<br />
1,200<br />
1,000<br />
800<br />
600<br />
400<br />
200<br />
-<br />
Source: Company, Angel Research<br />
30.0<br />
25.0<br />
20.0<br />
15.0<br />
10.0<br />
5.0<br />
0.0<br />
20x<br />
Apr-05<br />
Jul-05<br />
Oct-05<br />
Jan-06<br />
Apr-06<br />
Jul-06<br />
Oct-06<br />
Jan-07<br />
Apr-07<br />
Jul-07<br />
Oct-07<br />
Jan-08<br />
Apr-08<br />
Jul-08<br />
Oct-08<br />
Jan-09<br />
Apr-09<br />
Jul-09<br />
Oct-09<br />
Jan-10<br />
Apr-10<br />
Jul-10<br />
Oct-10<br />
On a PE basis, the stock has traded in the 2-22x one-year forward PE band, and<br />
at an average of 11x in the last five years. On the EV/Sales front, the stock has<br />
been trading in the range of 0.8-2.5x and at an average of 1.7x.<br />
15x<br />
10x<br />
5x<br />
October 18, 2010 3<br />
EV (` cr)<br />
22.0<br />
12,000<br />
10,500<br />
9,000<br />
7,500<br />
6,000<br />
4,500<br />
3,000<br />
1,500<br />
22.9<br />
20.4<br />
Sector APL<br />
OPM RoE<br />
0<br />
24.1<br />
Apr-05<br />
Jul-05<br />
Oct-05<br />
Jan-06<br />
Apr-06<br />
Jul-06<br />
Oct-06<br />
Jan-07<br />
Apr-07<br />
Jul-07<br />
Oct-07<br />
Jan-08<br />
Apr-08<br />
Jul-08<br />
Oct-08<br />
Jan-09<br />
Apr-09<br />
Jul-09<br />
Oct-09<br />
Jan-10<br />
Apr-10<br />
Jul-10<br />
Oct-10<br />
2.5x<br />
2.0x<br />
1.5x<br />
1.0x
Exhibit 6: Comparative Valuation<br />
<strong>Aurobindo</strong> <strong>Pharma</strong> | Initiating Coverage<br />
We have valued APL on a SOTP basis. <strong>The</strong> base business has been valued at 14x<br />
FY2012E core earnings (`90.2/share), which is at 33% discount (on the back of<br />
low presence in the high-margin domestic formulation business) to the top Indian<br />
generic players and fetches `1,263/share. We have assigned a higher multiple to<br />
APL’s core business compared to the multiple assigned by street and its historical<br />
average, as we believe that the concerns about higher contribution of the API<br />
business is unwarranted given that the company’s FY2012 OPM and RoE are on<br />
par with top Indian generic peers and are likely to sustain going forward.<br />
APL has also seen a substantial spurt in other operating income on the back of<br />
dossier income primarily under the Pfizer agreement and sale of dossiers in<br />
Europe. Other operating income constituted nearly 31.9% of PBT in FY2010.<br />
However, we have assigned a lower multiple as there is lack of clarity regarding<br />
the time-line of the recurring nature of the dossier income. We have valued other<br />
operating income at 7x 50% of FY2012E income (`9.5/share) and ascribed<br />
`67/share.<br />
Exhibit 5: SOTP Valuation (FY2012)<br />
Core business (`90.2/share)<br />
Other Op. income at 50% FY2012E income (`9.5/share)<br />
Total<br />
Source: Company, Angel Research<br />
Multiple<br />
(x)<br />
Per share (`)<br />
14 1,263<br />
7 67<br />
October 18, 2010 4<br />
1,330<br />
We Initiate Coverage on the stock with a Buy recommendation and SOTP Target<br />
Price of `1,330, implying an upside of 19% from current levels.<br />
Comparative Mcap (` cr) Sales (` cr) PE (x) EV/Sales (x) EV/EBITDA (x) RoE (%)<br />
FY2011E FY2012E FY2011E FY2012E FY2011E FY2012E FY2011E FY2012E FY2011E FY2012E<br />
Cadila Healthcare 14,147 4,308 5,100 22.5 17.4 3.4 2.8 17.1 13.5 34.8 34.7<br />
Cipla 26,255 5,902 6,797 23.5 19.1 4.3 3.7 21.3 17.3 17.5 18.9<br />
Dr Reddy's 26,924 8,416 9,797 27.0 20.4 3.1 2.6 16.4 13.2 25.0 25.5<br />
Lupin 18,264 5,645 6,579 22.2 17.8 3.3 2.9 17.7 14.7 31.8 31.2<br />
Ranbaxy 24,362 8,162 9,913 15.1 20.1 3.0 2.4 18.6 12.7 31.3 20.2<br />
Sun <strong>Pharma</strong> 42,252 4,830 5,581 28.5 24.1 7.8 6.6 24.0 19.8 17.1 17.7<br />
Average - 6,521 7,305 23.9 20.6 4.7 3.9 19.9 15.9 24.3 22.9<br />
<strong>Aurobindo</strong> 6,521 3,796 4,506 13.6 10.3 2.2 1.8 11.6 8.7 22.7 24.1<br />
Prem /(Disc) % to Avg - - - (43.2) (50.2) (53.7) (54.7) (42.0) (45.0) - -<br />
Source: Company, Angel Research
APL has increased its global filing<br />
dramatically from 313 in FY2008 to<br />
1,171 in FY2010<br />
Exhibit 7: API and Formulations filings<br />
1,600<br />
1,200<br />
800<br />
400<br />
0<br />
895<br />
1,126<br />
122 133 145<br />
Investment Arguments<br />
Supply agreements to drive growth<br />
Source: Company, Angel Research. Note: Other regulated markets include multiple registrations in the EU<br />
<strong>Aurobindo</strong> <strong>Pharma</strong> | Initiating Coverage<br />
On the global filings front (ANDAs and dossiers) APL has increased its filing<br />
dramatically from 313 in FY2008 to 1,171 in FY2010, as it proposes to scale up<br />
from SSP and Cephs to NPNC products. Further, the transformation from being a<br />
pure API supplier to becoming a formidable formulations player has increased its<br />
cost efficiencies, as 90% of its formulation is now backward integrated.<br />
1,412<br />
FY2008 FY2009 FY2010<br />
US Other Regulated markets<br />
In FY2010, under the Pfizer contract<br />
APL scaled up supply to 23 products to<br />
the US and clocked revenues of US<br />
$48mn<br />
185<br />
128 147 169<br />
Thus, to leverage on its cost efficiency and strong product filings, APL entered into<br />
long-term supply agreements with Pfizer (March 2009) and AstraZeneca<br />
(September 2010), which provides significant revenue visibility going ahead. <strong>The</strong><br />
company is also in discussion with other MNCs for more supply agreements.<br />
Under the Pfizer contract, APL would supply more than 100 products post full<br />
commercialisation of the contract and cover various geographies. In FY2010, APL<br />
scaled up supply with 23 products to the US and clocked revenues of US $48mn.<br />
In Europe, the company expects to significantly ramp up in the current fiscal. <strong>The</strong><br />
company proposes commercialisation for the rest of the world (RoW) by FY2012.<br />
Pertinently, APL has received upfront payment under the contract boosting its cash<br />
flow. Going ahead, Pfizer is likely to add more products and cover additional<br />
geographies based on the initial response that it receives from its existing markets.<br />
October 18, 2010 5<br />
1,200<br />
1,000<br />
800<br />
600<br />
400<br />
200<br />
0<br />
838<br />
1,002<br />
FY2008 FY2009 FY2010<br />
US Other Regulated markets
Exhibit 8: Pfizer contract - Number of products<br />
Co-Exclusive<br />
Solid oral products 75<br />
Exclusive<br />
Solid oral products<br />
Sterile injectable products 11<br />
Non-Exclusive<br />
Solid oral products<br />
Sterile injectable products 1 12 12<br />
<strong>Aurobindo</strong> <strong>Pharma</strong> | Initiating Coverage<br />
US France ROEU Aus/NZ Canada RoW<br />
October 18, 2010 6<br />
34<br />
13 77 44 14 55<br />
Total 87 59 89 44 14 60<br />
Source: Company, Angel Research<br />
Under its supply agreement with AstraZeneca, APL would be supplying several<br />
solid dosage and sterile products to the emerging markets covering therapeutic<br />
segments such as anti-infective, CVS and CNS. We expect the AstraZeneca<br />
contract to contribute US $5mn in FY2012. Overall, we expect revenues from the<br />
supply agreements to increase 3x over FY2010-12 from `227cr to `644cr.<br />
Exhibit 9: Sales under supply agreements<br />
(` cr)<br />
800<br />
600<br />
400<br />
200<br />
0<br />
227<br />
Source: Company, Angel Research<br />
367<br />
23<br />
621<br />
FY2010 FY2011E FY2012E<br />
Pfizer AstraZeneca % of Sales<br />
16.0<br />
12.0<br />
8.0<br />
4.0<br />
0.0<br />
5<br />
(%)
APL’s base business (ex Pfizer) logged a<br />
CAGR of 82.3% to US $145mn over<br />
FY2006-10<br />
APL targets day-1 launches in the US<br />
and has commercialised 61 products in<br />
the US<br />
<strong>Aurobindo</strong> <strong>Pharma</strong> | Initiating Coverage<br />
US and ARV formulation segment key drivers for base business<br />
APL’s business, excluding the supply agreements, would primarily be driven by the<br />
US and the ARV segment on the formulation front. <strong>The</strong> API business is expected to<br />
be subdued as the company would be using most of the API for internal<br />
consumption.<br />
Product launches to drive business in US market<br />
APL has particularly been able to scale up its business in the US market through<br />
product introductions and the supply agreement with Pfizer. In the US, the<br />
company has seen a growth in business 16x over FY2006-10 and attained critical<br />
mass. APL’s base business (ex Pfizer) logged a CAGR of 82.3% to US $145mn<br />
over the period. Pertinently, the company scaled up supplies under the Pfizer<br />
contract in FY2010 and clocked revenues of US $48mn. APL offset the lower<br />
revenue per product (US $2.3mn) by widening its product basket (APL-61,<br />
Pfizer-23 products).<br />
Exhibit 10: US market - Performance across players (FY2010)<br />
(US $mn)<br />
400<br />
350<br />
300<br />
250<br />
200<br />
150<br />
100<br />
50<br />
0<br />
374<br />
Source: Company, Angel Research.<br />
APL has commercialised 61 products in the US with the top-10 products<br />
contributing nearly 60% of its revenues in FY2010. <strong>The</strong> company primarily targets<br />
day-1 launches in the US. APL has been able to garner strong market share in<br />
highly competitive generic products such as Citalopram Hydrobromide, Paroxetine<br />
Hydrochloride, Amoxicillin, Metformin Hydrochloride and Simvastatin owing to cost<br />
advantages. APL is also witnessing strong pick up (has garnered 8% market share)<br />
in the recently launched Valacyclovir tablets. Additionally, APL recently also<br />
received approvals for the low-competition Ampicillin injections, which has a<br />
market size of more than US $100mn.<br />
October 18, 2010 7<br />
357<br />
331<br />
233<br />
193<br />
146<br />
Dr Reddy Lupin Ranbaxy Sun <strong>Pharma</strong> <strong>Aurobindo</strong> Cadila
APL expects to file 15-20 ANDAs in<br />
FY2011 and FY2012<br />
Exhibit 12: ANDA filings (FY2010)<br />
180<br />
150<br />
120<br />
90<br />
60<br />
30<br />
0<br />
82<br />
46<br />
Source: Company, Angel Research<br />
19<br />
22<br />
Exhibit 11: APL’s top products in US<br />
<strong>Aurobindo</strong> <strong>Pharma</strong> | Initiating Coverage<br />
Key Products # of players Market share (Rx, %)<br />
Citalopram Hydrobromide >15 15<br />
Paroxetine Hydrochloride >10 11<br />
Amoxicillin >10 9<br />
Metformin Hydrochloride >15 6<br />
Simvastatin >15 5<br />
Source: Industry, Angel Research; Note: Market share is for July 2010<br />
APL has also commercialised its New Jersey (NJ) facility, which it acquired from<br />
Sandoz in 2006. Through this facility APL is targeting the institutional business in<br />
the US. Pertinently, to run the institutional business in the US it is necessary to have<br />
a local production unit. APL has also begun filings of controlled substances from<br />
the unit, which is expected to contribute from FY2013 onwards.<br />
APL has been one of the aggressive filers in the US market with 169 ANDAs filed<br />
with 113 approvals received till FY2010. Among the players, APL is the third<br />
largest ANDA filer. APL has aggressively filed in the last three years and is now<br />
geared to reap benefits, even though most of the filings are for highly competitive<br />
products. APL expects to file 15-20 ANDAs in FY2011 and FY2012.<br />
169<br />
FY2007 FY2008 FY2009 FY2010 Total<br />
We expect the base business<br />
(ex-Pfizer) to grow at a CAGR of 36.0%<br />
over FY2010-12 and contribute US<br />
$268mn with revenue per product<br />
increasing to US $2.6mn<br />
Going ahead, the next three years in the US, with US $70bn going<br />
off-patent, one of the highest in history, we believe that APL is well placed to tap<br />
this opportunity. We expect the company to clock 42.0% CAGR in net sales in the<br />
US over FY2010-12 to US $388mn driven by product launches and the Pfizer<br />
contract. This contract is expected to contribute US $120mn constituting 31% of US<br />
sales. We expect the base business (ex-Pfizer) to post a CAGR of 36.0% over<br />
FY2010-12 and contribute US $268mn by FY2012 with revenue per product<br />
increasing to US $2.6mn from US $2.3mn in FY2010 as the company moves<br />
towards the high revenue generating NPNC and injectable (SSP and Cephs)<br />
products.<br />
October 18, 2010 8<br />
250<br />
200<br />
150<br />
100<br />
50<br />
0<br />
211<br />
204<br />
169 163<br />
130<br />
113<br />
Sun <strong>Pharma</strong> Ranbaxy <strong>Aurobindo</strong> Dr Reddy Lupin Cadila
APL is one of the largest generic<br />
suppliers under the PEPFAR contracts<br />
with 35% market share<br />
Exhibit 13: US sales trend<br />
(US $mn)<br />
Source: Company, Angel Research<br />
ARV business on strong footing<br />
<strong>Aurobindo</strong> <strong>Pharma</strong> | Initiating Coverage<br />
APL derives 15% of its revenues from the ARV segment, which registered 54.9%<br />
CAGR over FY2006-10 to `495cr. This segment derives around 80% of its<br />
revenues from the President's Emergency Plan for AIDS Relief (PEPFAR) program.<br />
<strong>The</strong> US had committed funds to the tune of US $18.8bn for the PEPFAR program<br />
during FY2004-08. In FY2009, the relief was increased to US $6.6bn and<br />
maintained at US $6.7bn in FY2010. Overall expenditure on the ARV drugs<br />
increased from US $117mn in FY2005 to US $203mn in FY2008, registering a<br />
CAGR of 20%. Meanwhile, the amount spent on generic ARV increased from 9.2%<br />
in FY2005 to 76.4% in FY2008.<br />
APL is one of the largest generic suppliers under the ARV contracts with 35%<br />
market share. APL enjoys high market share as it is fully integrated in all its<br />
products apart from having a larger product basket. Overall, we expect the ARV<br />
segment to post CAGR of 11.1% over FY2010-12 to `612cr with the PEPFAR<br />
allocation for generic ARVs expected to increase.<br />
Exhibit 14: ARV sales trend<br />
(` cr)<br />
500<br />
400<br />
300<br />
200<br />
100<br />
0<br />
700<br />
600<br />
500<br />
400<br />
300<br />
200<br />
100<br />
0<br />
13 35 58<br />
Source: Company, Angel Research<br />
October 18, 2010 9<br />
121<br />
145<br />
48<br />
192<br />
76<br />
268<br />
120<br />
FY2006 FY2007 FY2008 FY2009 FY2010 FY2011E FY2012E<br />
86<br />
122<br />
Pfizer Ex-Pfizer % of Sales<br />
404<br />
464<br />
495<br />
549<br />
612<br />
FY2006 FY2007 FY2008 FY2009 FY2010 FY2011E FY2012E<br />
ARV % of Sales<br />
50.0<br />
40.0<br />
30.0<br />
20.0<br />
10.0<br />
0.0<br />
20.0<br />
15.0<br />
10.0<br />
5.0<br />
0.0<br />
(%)<br />
(%)
We expect EU to register CAGR of<br />
around 21.0% over FY2010-12 to<br />
`348cr driven by product launches and<br />
the Pfizer contract<br />
We expect revenues from the RoW to<br />
post a CAGR of 19.1% to `294cr over<br />
FY2010-12 and expect the AstraZeneca<br />
contract to contribute Rs23cr in FY2012<br />
Europe and RoW growing at steady pace<br />
<strong>Aurobindo</strong> <strong>Pharma</strong> | Initiating Coverage<br />
In Europe, APL has been developing its presence through licensing agreements<br />
with the MNC’s and other generic players. In the UK, Netherland and Italy, APL<br />
has a direct presence. <strong>The</strong> company is now targeting newer geographies, viz.<br />
Romania, Spain, Yugoslavia and Bulgaria. During FY2006-10, the company’s EU<br />
business registered CAGR of 51.6% to `237cr.<br />
We expect EU to register CAGR of around 21.0% over FY2010-12 to `348cr<br />
driven by product launches and the Pfizer contract. We expect the Pfizer contract to<br />
scale up significantly from `2cr in FY2010 to `63cr in FY2012. Excluding Pfizer,<br />
we expect overall sales to grow by 10.0% to `285cr in FY2012.<br />
Exhibit 15: EU sales trend<br />
(` cr)<br />
45<br />
Source: Company, Angel Research<br />
Over FY2006-10, RoW registered CAGR of 26.2%. In FY2010, RoW contributed<br />
6.1% to the company’s net sales to `207cr. We expect revenues from the RoW to<br />
post a CAGR of 19.1% to `294cr over FY2010-12 and expect the AstraZeneca<br />
contract to contribute Rs23cr in FY2012.<br />
Exhibit 16: RoW sales trend<br />
(` cr)<br />
400<br />
300<br />
200<br />
100<br />
0<br />
400<br />
300<br />
200<br />
100<br />
0<br />
Source: Company, Angel Research<br />
October 18, 2010 10<br />
128<br />
201 198<br />
235<br />
2<br />
247<br />
18<br />
285<br />
FY2006 FY2007 FY2008 FY2009 FY2010 FY2011E FY2012E<br />
82<br />
288<br />
Pfizer Ex-Pfizer % of Sales<br />
158<br />
198 207 225<br />
63<br />
253<br />
23<br />
18<br />
FY2006 FY2007 FY2008 FY2009 FY2010 FY2011E FY2012E<br />
Pfizer AstraZeneca Ex-Pfizer/Astra % of Sales<br />
9.0<br />
6.0<br />
3.0<br />
0.0<br />
15.0<br />
10.0<br />
5.0<br />
0.0<br />
(%)<br />
(%)
We expect the API segment revenues to<br />
remain flat to `1,575cr over FY2010-12<br />
as the company would use most of the<br />
API for internal consumption<br />
API segment to remain subdued<br />
<strong>Aurobindo</strong> <strong>Pharma</strong> | Initiating Coverage<br />
APL is one of the largest players in the API space, which contributed around 45% to<br />
its FY2010 sales with supply of SSP (oral and sterile), Cephs (oral and sterile) and<br />
other APIs having predominant exposure in its domestic segment.<br />
APL registered a decline of 5.2% in oral (SSP and Cephs) APIs over FY2006-10 due<br />
to price volatility. <strong>The</strong> company’s API segment is vulnerable to Pen-G prices as it is<br />
the basic input for API. Hence, to protect its margins, APL shifted to sterile API<br />
products and is now also using most of the API for internal consumption.<br />
Going ahead, we expect the API segment revenues to remain flat to `1,575cr over<br />
FY2010-12 as the company would use most of the API for internal consumption.<br />
Exhibit 17: API sales break-up<br />
(` cr) FY2006 FY2007 FY2008 FY2009 FY2010 FY2011E FY2012E<br />
SSP (Oral) 586 591 673 550 449 421 391<br />
Growth (%)<br />
1.0 13.8 (18.3) (16.8) (8.0) (7.0)<br />
SSP (Sterile) - - 131 174 158 156 159<br />
Growth (%)<br />
32.2 (9.2) (1.0) 2.0<br />
Cephs (Oral) 484 643 393 422 405 417 413<br />
Growth (%)<br />
32.7 (38.8) 7.3 (4.0) 3.0 (1.0)<br />
Cephs (Sterile) - - 199 212 274 277 287<br />
Growth (%)<br />
6.6 29.5 0.9 3.7<br />
ARV & other high value 355 296 152 271 307 310 325<br />
Growth (%)<br />
(16.5) (48.8) 78.9 13.3 0.9 4.7<br />
Total 1,425 1,530 1,548 1,628 1,593 1,581 1,575<br />
Growth (%)<br />
Source: Company, Angel Research<br />
CRAMS a long term driver<br />
7.4 1.1 5.2 (1.6) (0.8) (0.4)<br />
APL launched its CRAMS division, AuroSource, to cater to the global innovators<br />
and biotech players. <strong>The</strong> division offers services across the entire product life cycle<br />
from pre-clinical to the commercial launch. APL is already in discussion with few<br />
players though we have not factored in any upsides from the business in our<br />
estimates.<br />
October 18, 2010 11
Overall contribution of the formulation<br />
segment increased from 17.0% in 2006<br />
to 55.0% in FY2010<br />
Financials<br />
<strong>Aurobindo</strong> <strong>Pharma</strong> | Initiating Coverage<br />
Top-line to register 15.6% CAGR over FY2010-12E<br />
APL recorded 20.5% CAGR in net sales during FY2006-10 to `3,370cr driven by<br />
the formulation segments. Overall contribution of the formulation segment<br />
increased from 17.0% in 2006 to 55.0% in FY2010 primarily led by the US and<br />
ARV contracts. During FY2006-10, while sales in the US posted a CAGR of 99.2%<br />
to `912cr driven by product launches and commencement of supplies to Pfizer,<br />
ARV formulation sales logged 54.9% CAGR over on the back of the contract wins<br />
under the PEPFAR project. <strong>The</strong> API segment however, recorded sluggish CAGR of<br />
3.0% as the increase in volumes was offset by lower price realisations during the<br />
period.<br />
Exhibit 18: Increasing contribution from formulations<br />
100%<br />
80%<br />
60%<br />
40%<br />
20%<br />
0%<br />
17<br />
83<br />
Source: Company, Angel Research<br />
For FY2011, we expect net sales to grow at a slower pace of 12.7% to `3,796cr<br />
due to capacity constraints (NPNC) - the new facilities at the Unit VII (SEZ) and NJ<br />
are expected to scale up gradually. We expect the formulation segment to clock<br />
22.7% yoy growth to `2,273cr, while the API segment is expected to decline by<br />
1.3% to `1,581cr.<br />
In the US region, the formulation segment is expected to clock 35.3% yoy growth<br />
to `1,234cr driven by the off-take under the Pfizer contract primarily in 2HFY2011<br />
and launch of new products (SSP and Ceph injectable products). In Europe, we<br />
expect net sales to come in at `265cr, up 11.5%, while the RoW is expected to<br />
register 8.7% yoy growth to `225cr on the back of product launches. <strong>The</strong> ARV<br />
segment is expected to clock 10.8% yoy growth to `549cr as contribution from<br />
PEPFAR contract increases.<br />
For FY2012, we expect net sales to clock strong growth of 18.7% to `4,506cr on<br />
the back of increase in capacity utilisation at its new facilities. Formulation sales<br />
are expected to register 32.0% yoy growth to `3,000cr while the API segment is<br />
expected to remain flat at `1,575cr.<br />
October 18, 2010 12<br />
33<br />
67<br />
41<br />
59<br />
48<br />
52<br />
55 60<br />
45 40<br />
FY2006 FY2007 FY2008 FY2009 FY2010 FY2011E FY2012E<br />
API Formulations<br />
67<br />
33
Overall, we expect net sales to post a<br />
CAGR of 15.6% over FY2010-12 to<br />
`4,506cr driven by the supply<br />
agreements, US (ex Pfizer) region and<br />
ARV contracts<br />
Exhibit 19: Sales break-up<br />
<strong>Aurobindo</strong> <strong>Pharma</strong> | Initiating Coverage<br />
In the US, under the Pfizer contract we expect APL to clock sales of `540cr<br />
following the increase in product launches. Further, ex-Pfizer sales in the US is<br />
expected to grow 36.3% yoy to `1,206cr and is likely to witness improvement in<br />
revenue per product. For EU we expect revenues to grow at 31.4% to `348cr,<br />
while RoW is expected to clock net sales of `294cr following commencement of<br />
supplies under the Pfizer and AstraZeneca contracts. On the ARV front, we expect<br />
growth of 11.5% in revenues to `612cr. Overall, we expect net sales to log a<br />
CAGR of 15.6% over FY2010-12 to `4,506cr driven by the supply agreements, US<br />
(ex Pfizer) region and ARV contracts.<br />
(` cr) FY2006 FY2007 FY2008 FY2009 FY2010 FY2011E FY2012E CAGR FY2010-12E<br />
Formulations 271 694 999 1,397 1,852 2,273 3,000 27.3<br />
US 58 156 236 537 912 1,234 1,746 38.3<br />
Pfizer - - - 13 225 349 540 54.9<br />
Ex-Pfizer 58 156 236 524 687 885 1,206 32.5<br />
Europe 45 128 201 198 237 265 348 21.0<br />
Pfizer - - - - 2 18 63 461.2<br />
Ex-Pfizer 45 128 201 198 235 247 285 10.0<br />
RoW 82 288 158 198 207 225 294 19.1<br />
Pfizer - - - - - - 18 -<br />
Astra - - - - - - 23 -<br />
Ex-Pfizer, Astra 82 288 158 198 207 225 253 10.6<br />
ARV 86 122 404 464 495 549 612 11.1<br />
API 1,425 1,531 1,548 1,628 1,593 1,581 1,575 (0.6)<br />
SSP 586 591 804 723 607 577 550 (4.8)<br />
Cephalosporin 484 643 592 634 679 694 700 1.5<br />
ARV & other high value 355 296 152 271 307 310 325 2.8<br />
Gross Sales 1,696 2,224 2,547 3,025 3,446 3,854 4,575 15.2<br />
Less Excise duty 95 102 117 90 76 58 69<br />
Net Sales 1,601 2,122 2,430 2,935 3,370 3,796 4,506 15.6<br />
Growth (%)<br />
Source: Company, Angel Research<br />
APL has been able to expand its OPM<br />
(excluding other OI) from 11.1% in<br />
FY2006 to 18.3% in FY2010<br />
32.6 14.5 20.8 14.8 12.7 18.7<br />
Margin expansion to be driven by increasing contribution from<br />
formulations<br />
APL has been able to expand its OPM (excluding other operating income) from<br />
11.1% in FY2006 to 18.3% in FY2010 and is now on par with the sector average<br />
in spite of higher contribution from the low-margin API segment. <strong>The</strong> company’s<br />
gross margins improved significantly by 12.1% over FY2006-10 to 47.3% on the<br />
back of increasing contribution from the high-margin formulation segment.<br />
However, the increase in gross margins was partly offset by the rise in SG&A and<br />
employee expenses, which restricted the increase in OPM by 7.2% to 18.3% in<br />
FY2010. APL increased its employee strength by 16% in FY2010 with the<br />
commencement of its new facilities and expansion at its API facilities.<br />
October 18, 2010 13
Overall, the transformation to a<br />
formulation player has benefited APL in<br />
dual ways - most of the API is now<br />
utilised for internal consumption making<br />
it cost competitive as well as insulating<br />
the company from the high price<br />
volatility witnessed in the API business<br />
<strong>Aurobindo</strong> <strong>Pharma</strong> | Initiating Coverage<br />
Going ahead, increase in contribution from formulations to 67% in FY2012 from<br />
55% in FY2010 and gradual scale up in capacity utilisation at its new facilities are<br />
likely to increase its OPM to 20.4% in FY2012 from 18.3% in FY2010.<br />
On a comparative basis, APL’s OPM would be on par with the sector average. This<br />
is on back of backward integration on the formulation front. Overall, the<br />
transformation to formulation player has benefited APL in dual ways - most of the<br />
API is now utilized for internal consumption (more than 90% of its formulation is<br />
backward integrated) thereby making it cost competitive in the formulation space<br />
as well as insulating the company from the high price volatility (seen especially<br />
between 2008-09 where gains of the formulation business was offset by price<br />
volatility on the API front) witnessed on the API business. Further, APL does not<br />
have a significant presence in the branded generic segment (including India)<br />
owing to which its expenditure for sales promotion and advertisements are on the<br />
lower side.<br />
Exhibit 20: OPM comparison (FY2012)<br />
(%)<br />
40.0<br />
30.0<br />
20.0<br />
10.0<br />
0.0<br />
33.5<br />
Sun<br />
<strong>Pharma</strong><br />
21.5 21.0 20.4 19.5 19.4<br />
Cipla Cadila<br />
Healthcare<br />
Source: Company, Angel Research. Note: Ranbaxy’s base business OPM considered.<br />
Recurring PAT (ex other OI) to increase by 29.1% CAGR over<br />
FY2010-12<br />
Recurring PAT (ex other OI) registered CAGR of 46.0% to `304cr during FY2006-<br />
10 driven by sales growth and margin expansion.<br />
Going ahead, interest expense is expected to rise as the company raises debt to<br />
repay the FCCBs (including premium) to the tune of `938cr in May 2011. We<br />
estimate interest expense to increase from `73cr to `91cr in FY2012. Depreciation<br />
cost is also expected to increase from `149cr in FY2010 to `208cr in FY2012 due<br />
to the new facilities (Unit VII (SEZ), NJ and Trident).<br />
In the last two years (FY2009 and FY2010), the company clocked other OI of<br />
`142cr and `206cr on the back of sale of dossiers to Europe and under the Pfizer<br />
contract, which has resulted in strong cash flows for the company. On a<br />
conservative basis, we expect the company to clock dossier income of `140cr both<br />
in FY2011 and FY2012 primarily from the supply agreements.<br />
October 18, 2010 14<br />
7.8<br />
APL Lupin Dr Reddy's Ranbaxy
Excluding the dossier income, recurring<br />
PAT is estimated to record strong CAGR<br />
of 29.1% to `506cr in FY2012<br />
Exhibit 21: Other operating income and Recurring PAT (ex other OI)<br />
(` cr)<br />
250<br />
200<br />
150<br />
100<br />
50<br />
0<br />
6.4<br />
3<br />
3.4<br />
13 11<br />
3.6<br />
Source: Company, Angel Research<br />
142<br />
44.2<br />
<strong>Aurobindo</strong> <strong>Pharma</strong> | Initiating Coverage<br />
Overall, we expect recurring PAT to increase by 16.6% to `617cr assuming lower<br />
income from the sale of dossiers. Excluding the dossier income, recurring PAT is<br />
estimated to record strong CAGR of 29.1% to `506cr in FY2012.<br />
31.9<br />
30.0<br />
206<br />
22.6 17.4<br />
20.0<br />
140 140<br />
10.0<br />
FY2006 FY2008 FY2010 FY2012E<br />
Other Op Income % of PBT<br />
APL has been on aggressive capex<br />
spree in the last five years with capex of<br />
`1,721cr<br />
To address capacity constraints on the<br />
NPNC front, APL commercialised Unit<br />
VII (SEZ) in FY2010<br />
50.0<br />
40.0<br />
0.0<br />
(%)<br />
Capex spend to moderate<br />
<strong>The</strong> company has been on an aggressive capex spree in the last five years<br />
incurring capex of `1,721cr (73% of FY2010 fixed assets), which was largely spent<br />
on the formulation segment.<br />
However, capacity utilisation has been subdued especially in tablets/capsules at<br />
46% in FY2010 primarily due to lower utilisation at the Unit VIB (Cephs) and Unit<br />
XII (SSP). However, going ahead, we expect the utilisation to increase at these<br />
facilities on the back of injectable product launches in the US and pick up in<br />
volume under the supply agreements.<br />
Exhibit 22: Formulation facilities<br />
Units Product Capacity Utilisation (%)<br />
Unit VIB Cephs oral & sterile < 25<br />
Unit XII SSP oral and sterile 85<br />
Unit VII (SEZ) NPNC Newly commenced<br />
USA NJ NPNC Newly commenced<br />
Trident Injectables (NPNC) To commence in 2HFY2012<br />
Source: Company, Angel Research<br />
Further, to address the capacity constraint in Unit III (NPNC), APL built a facility<br />
near Hyderabad (Unit VII SEZ) in FY2010. APL spent around `250cr to set up this<br />
facility, which is spread across 10 acres of the total 75 acres land. <strong>The</strong> unit has<br />
the capacity to produce to 1,000mn tablets and 100mn capsules per month, which<br />
has almost doubled the company’s tablets/capsules production. <strong>The</strong> company<br />
expects the unit to meet the increasing demand in the regulated markets and<br />
emerging markets.<br />
October 18, 2010 15<br />
(` cr)<br />
600<br />
400<br />
200<br />
0<br />
67<br />
189<br />
230<br />
169<br />
304<br />
355<br />
506<br />
FY2006 FY2007 FY2008 FY2009 FY2010 FY2011E FY2012E<br />
Recurring PAT
Exhibit 24: Debt levels, FCF and Capex<br />
(` cr)<br />
2,500<br />
2,000<br />
1,500<br />
1,000<br />
500<br />
0<br />
1,373<br />
2,078<br />
1,908<br />
Source: Company, Angel Research<br />
2,333<br />
2,155<br />
2,004<br />
<strong>Aurobindo</strong> <strong>Pharma</strong> | Initiating Coverage<br />
APL has also commercialised its NJ facility, which it acquired from Sandoz in<br />
2006. Through this facility APL is targeting the institutional business in the US. It is<br />
necessary to have a local production unit to run the institutional business. APL has<br />
begun filings of controlled substances from the unit, which is expected to contribute<br />
from FY2013 onwards. Overall, we expect Unit VII SEZ and the NJ facility to scale<br />
up and witness ramp up in capacity utilisation in FY2012 driven by supply<br />
agreements, US and ARV segment leading to an improvement in margins.<br />
Thus, with most of the facilities in place, we expect APL to incur moderate capex of<br />
`568cr over the next two years.<br />
Debt concerns receding<br />
In view of APL’s aggressive capex, its net debt/equity increased to 1.8x in FY2009,<br />
which was much higher than the industry average of 0.4x. However, in FY2010,<br />
with overall improvement in business profitability (OPM expansion), the company’s<br />
net debt/equity improved to 1.1x. Going ahead, in FY2012, we expect net<br />
debt/equity to further improve to 0.6x on the back of debt repayments, decline in<br />
capex and improvement in profitability.<br />
APL has outstanding FCCB of US $139.2mn repayable in May 2011 with the<br />
conversion price at 25-43% premium over the current price. We expect APL to<br />
repay its outstanding FCCBs through internal accruals and debt resulting in outflow<br />
of `938cr.<br />
Exhibit 23: FCCB details<br />
Maturity Date<br />
Issued<br />
(US$ mn)<br />
Converted/<br />
Bought back<br />
O/s US<br />
$mn<br />
October 18, 2010 16<br />
YTM<br />
(%)<br />
Exch Rate<br />
(`/US $)<br />
Amt Payable<br />
(` cr)<br />
Breakeven<br />
price (`)<br />
August 8, 2010 60.0 60.0 - 40.0 - - -<br />
May 10, 2011 150.0 43.8 106.2 46.3 46.0 715 1,615<br />
May 17, 2011 50.0 17.0 33.0 46.9 46.0 223 1,406<br />
Total 260.0 120.8 139.2<br />
Source: Company, Angel Research<br />
1,766<br />
FY2006 FY2008 FY2010 FY2012E<br />
Debt Net Debt Equity<br />
2.0<br />
1.6<br />
1.2<br />
0.8<br />
0.4<br />
0.0<br />
(x)<br />
(` cr)<br />
600<br />
450<br />
300<br />
150<br />
0<br />
(150)<br />
(300)<br />
(450)<br />
(237)<br />
253<br />
(326)<br />
345<br />
(48)<br />
244<br />
(343)<br />
479<br />
29<br />
400<br />
938<br />
288 280<br />
247<br />
198<br />
FY2006 FY2007 FY2008 FY2009 FY2010 FY2011E FY2012E<br />
FCF Capex
Concerns<br />
<strong>Aurobindo</strong> <strong>Pharma</strong> | Initiating Coverage<br />
� Delay in ramp up of supply agreements: APL is expected to receive 14.3% of<br />
its FY2012 revenues from the supply agreements (Pfizer and AstraZeneca).<br />
Hence, any delay in ramp up of the supply agreements would pose a<br />
downside risk to our estimates.<br />
� Forex risks: Exports constitute 61% of the company revenues. <strong>The</strong>refore, any<br />
significant appreciation in the rupee could adversely affect the company's<br />
margins. However, more than 80% of the company’s debt is foreign currency<br />
denominated providing a natural hedge against currency volatility.<br />
� High price volatility in the API business: Higher-than-anticipated price erosion<br />
in the company's generic API business, could impact its profitability. In<br />
FY2008-09, OPMs were flat in spite of higher contribution from the<br />
high-margin formulation business as the gains were offset by the price<br />
volatility in the API business. However, with formulation contribution to net<br />
sales increasing to 67% in FY2012 and reducing dependence on Pen-G<br />
related APIs, which should cushion the company’s margins going ahead.<br />
October 18, 2010 17
Company Background<br />
<strong>Aurobindo</strong> <strong>Pharma</strong> | Initiating Coverage<br />
APL, one of the largest API manufacturers in Asia, was incorporated in 1989 by P V<br />
Ramaprasad Reddy and K Nityananda Reddy. APL is now present across the value<br />
chain from intermediates, API and formulations supported by a strong R&D team.<br />
APL has commercialised over 200 APIs and 300 formulation products till date.<br />
Over the years, the company has developed its presence in key therapeutic areas<br />
such as SSPs, Cephs, Anti-virals, CNS, CVS, gastroenterology, pain management,<br />
etc. Being an integrated player, the company enjoys an edge over competition.<br />
<strong>The</strong> company has 15 manufacturing facilities across the globe approved by the US<br />
FDA and other regulators. APL has presence in more than 100 countries and<br />
derives more than 60% of its revenues from exports.<br />
Exhibit 25: Facilities<br />
Formulations<br />
Unit Products<br />
Unit III Multi-purpose non-Betalactums Oral<br />
Unit VII (SEZ) Non-Betallactums Oral<br />
USA NJ Non-Betallactums Oral<br />
Unit VIB Cephalosporins (Oral & Sterile)<br />
Unit XII Semi-synthetic penicillins (SSP) oral and sterile<br />
API<br />
Units Products<br />
Unit I CVS, CNS, Anti-allergic<br />
Unit IA Cephalosporins (Non-Sterile)<br />
Unit V Semi-synthetic penicillins (sterile and Non sterile)<br />
Unit VIA Cephalosporins (Sterile)<br />
Unit VIII<br />
Gastro enterologicals,<br />
Anti-retroviral<br />
Unit XIB Anti-retroviral<br />
Source: Company, Angel Research<br />
October 18, 2010 18
Profit & Loss Statement (Consolidated)<br />
<strong>Aurobindo</strong> <strong>Pharma</strong> | Initiating Coverage<br />
Y/E March (` cr) FY2007 FY2008 FY2009 FY2010 FY2011E FY2012E<br />
Net Sales 2,122 2,430 2,935 3,370 3,796 4,506<br />
Other operating income 13 11 142 206 140 140<br />
Total operating income 2,135 2,441 3,077 3,575 3,936 4,646<br />
% chg 670.9 14.3 26.1 16.2 10.1 18.0<br />
Total Expenditure 1,821 2,089 2,561 2,752 3,089 3,588<br />
Net Raw Materials 1,300 1,412 1,680 1,777 1,932 2,178<br />
Other Mfg costs 206 267 301 338 406 473<br />
Personnel 150 193 244 327 414 533<br />
Other 164 217 336 310 336 403<br />
EBITDA 301 341 374 617 707 919<br />
% chg 70.2 13.2 9.6 65.1 14.6 29.9<br />
(% of Net Sales) 14.2 14.0 12.7 18.3 18.6 20.4<br />
Depreciation& Amortisation 100 100 128 149 187 208<br />
EBIT 202 241 246 468 520 710<br />
% chg 284.4 19.3 2.3 90.0 11.2 36.5<br />
(% of Net Sales) 9.5 9.9 8.4 13.9 13.7 15.8<br />
Interest & other Charges 86 69 93 73 74 91<br />
Other Income 77 110 27 44 34 43<br />
(% of PBT) 37.5 37.6 - 6.9 5.5 5.3<br />
Share in profit of Associates - 0.0 0.0 - - -<br />
Recurring PBT 206 292 323 645 620 802<br />
% chg 170.7 41.8 10.5 100.0 (3.8) 29.4<br />
Extraordinary Expense/(Inc.) - - 201.0 (109.5) (13.9) -<br />
PBT (reported) 206 292 122 754 634 802<br />
Tax 4.4 53.6 21.4 191.4 155.0 185.7<br />
(% of PBT) 2.1 18.4 17.6 25.4 24.4 23.1<br />
PAT (reported) 201 238 100 563 479 617<br />
Less: Minority interest (MI) 1 (0) - (0) - -<br />
PAT after MI (reported) 200 239 100 563 479 617<br />
ADJ. PAT 200 239 301 454 465 617<br />
% chg 292.7 19.1 26.3 50.7 2.5 32.6<br />
(% of Net Sales) 9.4 9.8 3.4 16.7 12.6 13.7<br />
Basic EPS (`) 37.7 44.4 18.6 101.1 84.9 109.2<br />
Adj Fully Diluted EPS (`) 37.7 44.4 56.0 81.5 82.4 109.2<br />
% chg 409.2 17.8 26.3 45.4 1.1 32.6<br />
October 18, 2010 19
Balance Sheet (Consolidated)<br />
<strong>Aurobindo</strong> <strong>Pharma</strong> | Initiating Coverage<br />
Y/E March (` cr) FY2007 FY2008 FY2009 FY2010 FY2011E FY2012E<br />
SOURCES OF FUNDS<br />
Equity Share Capital 27 27 27 28 28 28<br />
Share Application Money - - - - - -<br />
Reserves& Surplus 859 1,097 1,214 1,801 2,248 2,821<br />
Shareholders’ Funds 886 1,124 1,241 1,829 2,276 2,849<br />
Minority Interest 4 3 3 4 4 4<br />
Total Loans 2,078 1,908 2,333 2,155 2,004 1,766<br />
Deferred Tax Liability 68 73 77 91 116 133<br />
Total Liabilities 3,036 3,109 3,654 4,079 4,400 4,753<br />
APPLICATION OF FUNDS<br />
Gross Block 1,414 1,601 1,869 2,312 2,850 3,280<br />
Less: Acc. Depreciation 316 418 575 697 884 1,092<br />
Net Block 1,099 1,184 1,294 1,615 1,966 2,188<br />
Capital Work-in-Progress 219 278 536 570 320 170<br />
Goodwill 54 53 105 96 96 96<br />
Investments 0 60 0 0 0 0<br />
Current Assets 2,135 2,059 2,289 2,506 2,882 3,384<br />
Cash 582 283 128 73 151 68<br />
Loans & Advances 272 316 394 375 562 640<br />
Other 1,281 1,460 1,767 2,058 2,169 2,676<br />
Current liabilities 471 526 570 708 864 1,085<br />
Net Current Assets 1,664 1,534 1,719 1,798 2,018 2,299<br />
Mis. Exp. not written off - - - - - -<br />
Total Assets 3,036 3,109 3,654 4,079 4,400 4,753<br />
October 18, 2010 20
Cash Flow Statement (Consolidated)<br />
<strong>Aurobindo</strong> <strong>Pharma</strong> | Initiating Coverage<br />
Y/E March (` cr) FY2007 FY2008 FY2009 FY2010 FY2011E FY2012E<br />
Profit before tax 206 292 73 752 620 802<br />
Depreciation 100 100 128 149 187 208<br />
(Inc)/Dec in Working Capital (267) (91) (334) (261) (142) (364)<br />
Less: Other income (83) (49) (180) 44 34 43<br />
Direct taxes paid (23) (46) (30) (153) (130) (169)<br />
Cash Flow from Operations 99 305 16 443 501 435<br />
(Inc.)/Dec. in Fixed Assets (345) (244) (479) (400) (288) (280)<br />
(Inc.)/Dec. in Investments (205) 113 48 (9) - -<br />
Other income (83) (49) (180) 44 34 43<br />
Cash Flow from Investing (633) (181) (611) (365) (254) (237)<br />
Issue of Equity 3 2 - 5 0 -<br />
Inc./(Dec.) in loans 791 (141) 287 (1) (137) (238)<br />
Dividend Paid (Incl. Tax) (9) (16) (39) (29) (33) (43)<br />
Others 130 (268) 193 (109) - -<br />
Cash Flow from Financing 915 (423) 440 (132) (169) (281)<br />
Inc./(Dec.) in Cash 381 (300) (155) (54) 78 (83)<br />
Opening Cash balances 202 582 283 128 73 151<br />
Closing Cash balances 582 283 128 73 151 68<br />
October 18, 2010 21
Key Ratios<br />
<strong>Aurobindo</strong> <strong>Pharma</strong> | Initiating Coverage<br />
Y/E March FY2007 FY2008 FY2009 FY2010 FY2011E FY2012E<br />
Valuation Ratio (x)<br />
P/E (on FDEPS) 29.7 25.2 20.0 13.7 13.6 10.3<br />
P/CEPS 19.9 17.8 26.4 8.8 9.5 7.7<br />
P/BV 6.7 5.4 4.9 3.4 2.8 2.2<br />
Dividend yield (%) 0.2 0.3 0.4 0.4 0.4 0.6<br />
EV/Sales 3.5 3.1 2.8 2.5 2.2 1.8<br />
EV/EBITDA 24.8 22.4 22.0 13.5 11.6 8.7<br />
EV / Total Assets 2.5 2.5 2.3 2.0 1.9 1.7<br />
Per Share Data (`)<br />
EPS (Basic) 37.7 44.4 18.6 101.1 84.9 109.2<br />
EPS (fully diluted) 37.7 44.4 56.0 81.5 82.4 109.2<br />
Cash EPS 56.2 63.0 42.4 127.9 118.0 146.1<br />
DPS 2.5 3.3 4.5 5.0 4.9 6.6<br />
Book Value 166.1 209.1 230.9 328.3 403.1 504.7<br />
Dupont Analysis<br />
EBIT margin 9.5 9.9 8.4 13.9 13.7 15.8<br />
Tax retention ratio 97.9 81.6 82.4 74.6 75.6 76.9<br />
Asset turnover (x) 1.0 0.9 1.0 0.9 1.0 1.0<br />
ROIC (Post-tax) 8.9 7.5 6.7 9.8 9.9 12.6<br />
Cost of Debt (Post Tax) 4.9 2.8 3.6 2.4 2.7 3.7<br />
Leverage (x) 0.9 1.6 1.6 1.5 1.0 0.7<br />
Operating ROE 12.7 14.7 11.7 20.6 16.9 18.9<br />
Returns (%)<br />
ROCE (Pre-tax) 7.7 7.8 7.3 12.1 12.3 15.5<br />
Angel ROIC (Pre-tax) 10.1 10.3 9.2 15.0 14.5 17.2<br />
ROE 23.5 23.7 25.5 29.6 22.7 24.1<br />
Turnover ratios (x)<br />
Asset Turnover (Gross Block) 1.6 1.6 1.8 1.7 1.5 1.5<br />
Inventory / Sales (days) 96 108 99 101 102 98<br />
Receivables (days) 103 97 92 94 94 92<br />
Payables (days) 81 78 70 74 70 67<br />
WC cycle (ex-cash) (days) 203 174 169 169 167 161<br />
Solvency ratios (x)<br />
Net debt to equity 1.7 1.4 1.8 1.1 0.8 0.6<br />
Net debt to EBITDA 5.0 4.8 5.9 3.4 2.6 1.8<br />
Interest Coverage (EBIT / Int.) 2.3 3.5 2.6 6.4 7.0 7.8<br />
October 18, 2010 22
<strong>Aurobindo</strong> <strong>Pharma</strong> | Initiating Coverage<br />
Research Team Tel: 022 - 4040 3800 E-mail: research@angeltrade.com Website: www.angeltrade.com<br />
DISCLAIMER<br />
This document is solely for the personal information of the recipient, and must not be singularly used as the basis of any investment<br />
decision. Nothing in this document should be construed as investment or financial advice. Each recipient of this document should make<br />
such investigations as they deem necessary to arrive at an independent evaluation of an investment in the securities of the companies<br />
referred to in this document (including the merits and risks involved), and should consult their own advisors to determine the merits and<br />
risks of such an investment.<br />
Angel Broking Limited, its affiliates, directors, its proprietary trading and investment businesses may, from time to time, make<br />
investment decisions that are inconsistent with or contradictory to the recommendations expressed herein. <strong>The</strong> views contained in this<br />
document are those of the analyst, and the company may or may not subscribe to all the views expressed within.<br />
Reports based on technical and derivative analysis center on studying charts of a stock's price movement, outstanding positions and<br />
trading volume, as opposed to focusing on a company's fundamentals and, as such, may not match with a report on a company's<br />
fundamentals.<br />
<strong>The</strong> information in this document has been printed on the basis of publicly available information, internal data and other reliable<br />
sources believed to be true, but we do not represent that it is accurate or complete and it should not be relied on as such, as this<br />
document is for general guidance only. Angel Broking Limited or any of its affiliates/ group companies shall not be in any way<br />
responsible for any loss or damage that may arise to any person from any inadvertent error in the information contained in this report.<br />
Angel Broking Limited has not independently verified all the information contained within this document. Accordingly, we cannot testify,<br />
nor make any representation or warranty, express or implied, to the accuracy, contents or data contained within this document. While<br />
Angel Broking Limited endeavours to update on a reasonable basis the information discussed in this material, there may be regulatory,<br />
compliance, or other reasons that prevent us from doing so.<br />
This document is being supplied to you solely for your information, and its contents, information or data may not be reproduced,<br />
redistributed or passed on, directly or indirectly.<br />
Angel Broking Limited and its affiliates may seek to provide or have engaged in providing corporate finance, investment banking or<br />
other advisory services in a merger or specific transaction to the companies referred to in this report, as on the date of this report or in<br />
the past.<br />
Neither Angel Broking Limited, nor its directors, employees or affiliates shall be liable for any loss or damage that may arise from or in<br />
connection with the use of this information.<br />
Note: Please refer to the important `Stock Holding Disclosure' report on the Angel website (Research Section). Also, please<br />
refer to the latest update on respective stocks for the disclosure status in respect of those stocks. Angel Broking Limited and<br />
its affiliates may have investment positions in the stocks recommended in this report.<br />
Disclosure of Interest Statement <strong>Aurobindo</strong> <strong>Pharma</strong><br />
1. Analyst ownership of the stock No<br />
2. Angel and its Group companies ownership of the stock No<br />
3. Angel and its Group companies' Directors ownership of the stock No<br />
4. Broking relationship with company covered No<br />
Note: We have not considered any Exposure below Rs 1 lakh for Angel, its Group companies and Directors.<br />
Ratings (Returns): Buy (> 15%) Accumulate (5% to 15%) Neutral (-5 to 5%)<br />
Reduce (-5% to 15%) Sell (< -15%)<br />
October 18, 2010 23
<strong>Aurobindo</strong> <strong>Pharma</strong> | Initiating Coverage<br />
Address: Acme Plaza, ‘A’ Wing, 3rd Floor, M.V. Road, Opp. Sangam Cinema, Andheri (E), Mumbai - 400 059.<br />
Research Team<br />
Tel: (022) 3952 4568 / 4040 3800<br />
Fundamental:<br />
Sarabjit Kour Nangra VP-Research, <strong>Pharma</strong>ceutical sarabjit@angeltrade.com<br />
Vaibhav Agrawal VP-Research, Banking vaibhav.agrawal@angeltrade.com<br />
Vaishali Jajoo Automobile vaishali.jajoo@angeltrade.com<br />
Shailesh Kanani Infrastructure, Real Estate shailesh.kanani@angeltrade.com<br />
Anand Shah FMCG, Media anand.shah@angeltrade.com<br />
Deepak Pareek Oil & Gas deepak.pareek@angeltrade.com<br />
Sushant Dalmia, CFA <strong>Pharma</strong>ceutical sushant.dalmia@angeltrade.com<br />
Rupesh Sankhe Cement, Power rupeshd.sankhe@angeltrade.com<br />
Param Desai Real Estate, Logistics, Shipping paramv.desai@angeltrade.com<br />
Sageraj Bariya Fertiliser, Mid-cap sageraj.bariya@angeltrade.com<br />
Paresh Jain Metals & Mining pareshn.jain@angeltrade.com<br />
Amit Rane Banking amitn.rane@angeltrade.com<br />
John Perinchery Capital Goods john.perinchery@angeltrade.com<br />
Srishti Anand IT, Telecom srishti.anand@angeltrade.com<br />
Jai Sharda Mid-cap jai.sharda@angeltrade.com<br />
Sharan Lillaney Mid-cap sharanb.lillaney@angeltrade.com<br />
Naitik Mody Mid-cap naitiky.mody@angelbroking.com<br />
Amit Vora Research Associate (Oil & Gas) amit.vora@angeltrade.com<br />
V Srinivasan Research Associate (Cement, Power) v.srinivasan@angeltrade.com<br />
Mihir Salot Research Associate (Logistics, Shipping) mihirr.salot@angeltrade.com<br />
Chitrangda Kapur Research Associate (FMCG, Media) chitrangdar.kapur@angeltrade.com<br />
Vibha Salvi Research Associate (IT, Telecom) vibhas.salvi@angeltrade.com<br />
Pooja Jain Research Associate (Metals & Mining) pooja.j@angeltrade.com<br />
Yaresh Kothari Research Associate (Automobile) yareshb.kothari@angeltrade.com<br />
Shrinivas Bhutda Research Associate (Banking) shrinivas.bhutda@angeltrade.com<br />
Sreekanth P.V.S Research Associate (FMCG, Media) sreekanth.s@angeltrade.com<br />
Hemang Thaker Research Associate (Capital Goods) hemang.thaker@angeltrade.com<br />
Nitin Arora Research Associate (Infra, Real Estate) nitin.arora@angeltrade.com<br />
Technicals:<br />
Shardul Kulkarni Sr. Technical Analyst shardul.kulkarni@angeltrade.com<br />
Mileen Vasudeo<br />
Derivatives:<br />
Technical Analyst vasudeo.kamalakant@angeltrade.com<br />
Siddarth Bhamre Head - Derivatives siddarth.bhamre@angeltrade.com<br />
Jaya Agarwal Derivative Analyst jaya.agarwal@angeltrade.com<br />
Institutional Sales Team:<br />
Mayuresh Joshi VP - Institutional Sales mayuresh.joshi@angeltrade.com<br />
Abhimanyu Sofat AVP - Institutional Sales abhimanyu.sofat@angeltrade.com<br />
Nitesh Jalan Sr. Manager niteshk.jalan@angeltrade.com<br />
Pranav Modi Sr. Manager pranavs.modi@angeltrade.com<br />
Sandeep Jangir Sr. Manager sandeepp.jangir@angeltrade.com<br />
Ganesh Iyer Sr. Manager ganeshb.Iyer@angeltrade.com<br />
Jay Harsora Sr. Dealer jayr.harsora@angeltrade.com<br />
Meenakshi Chavan Dealer meenakshis.chavan@angeltrade.com<br />
Gaurang Tisani Dealer gaurangp.tisani@angeltrade.com<br />
Production Team:<br />
Bharathi Shetty Research Editor bharathi.shetty@angeltrade.com<br />
Simran Kaur Research Editor simran.kaur@angeltrade.com<br />
Bharat Patil Production bharat.patil@angeltrade.com<br />
Dilip Patel Production dilipm.patel@angeltrade.com<br />
Angel Broking Ltd: BSE Sebi Regn No : INB 010996539 / CDSL Regn No: IN - DP - CDSL - 234 - 2004 / PMS Regn Code: PM/INP000001546 Angel Securities Ltd:BSE: INB010994639/INF010994639 NSE: INB230994635/INF230994635 Membership numbers: BSE 028/NSE:09946<br />
Angel Capital & Debt Market Ltd: INB 231279838 / NSE FNO: INF 231279838 / NSE Member code -12798 Angel Commodities Broking (P) Ltd: MCX Member ID: 12685 / FMC Regn No: MCX / TCM / CORP / 0037 NCDEX : Member ID 00220 / FMC Regn No: NCDEX / TCM / CORP / 0302<br />
October 18, 2010 24


