ILLINOIS SCHOOL REPORT CARD - Joliet Public Schools District 86
ILLINOIS SCHOOL REPORT CARD - Joliet Public Schools District 86
ILLINOIS SCHOOL REPORT CARD - Joliet Public Schools District 86

You also want an ePaper? Increase the reach of your titles
YUMPU automatically turns print PDFs into web optimized ePapers that Google loves.
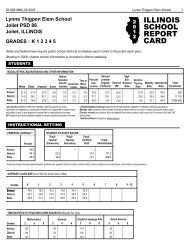
56-099-0<strong>86</strong>0-05-2020Taft Elementary School<strong>Joliet</strong> PSD <strong>86</strong><strong>Joliet</strong>, <strong>ILLINOIS</strong>GRADES : K 1 2 3 4 52012Taft Elementary School 1<strong>ILLINOIS</strong><strong>SCHOOL</strong><strong>REPORT</strong><strong>CARD</strong>State and federal laws require public school districts to release report cards to the public each year.Starting in 2009, charter school information is included in district statistics.STUDENTSRACIAL/ETHNIC BACKGROUND AND OTHER INFORMATIONWhite Black Hispanic AsianNativeHawaiian/Pacific AmericanIslander IndianTwo orMoreRacesPercentLow-IncomePercentLimited-English-ProficientPercentIEPHighSch.DropoutRateChronicTruancyRateMobilityRateAttendanceRateTotalEnrollmentSchool<strong>District</strong>State41.814.951.013.428.118.038.251.123.61.60.64.20.00.00.10.20.20.34.85.12.856.877.149.010.219.19.412.313.213.65.023.58.614.518.513.195.994.594.444011,1032,066,692Low-income students come from families receiving public aid; live ininstitutions for neglected or delinquent children; are supported in foster homeswith public funds; or are eligible to receive free or reduced-price lunches.IEP Students are those students eligible to receive special education services.Limited-English-proficient students are those students eligible for transitional bilingual programs.Mobility rate is based on the number of times students enroll in or leave a school during the school year.Chronic truants are students who are absent from school without valid cause for 9 or more of the last 180school days.Total Enrollment is based on Home School.INSTRUCTIONAL SETTINGPARENTAL CONTACT*PercentSTUDENT-TO-STAFF RATIOSPupil-Pupil-Teacher TeacherElementary SecondaryPupil-CertifiedStaffPupil-AdministratorSchool<strong>District</strong>State100.098.195.3--22.318.9----15.313.7--171.3205.0* Parental contact includes parent-teacher conferences, parental visits to school, school visits to home, telephone conversations, and written correspondence.AVERAGE CLASS SIZE (as of the first school day in May)GradesK1 2 3 4 5 6 7 8 9 - 12School19.3 23.3 17.8<strong>District</strong>22.7 22.0 21.9State20.9 21.2 21.521.021.922.020.822.622.422.323.222.8TIME DEVOTED TO TEACHING CORE SUBJECTS (Minutes Per Day)Mathematics Science English/Language ArtsGrades 3 6 8 3 6 8 3 6 8School 60 30 120<strong>District</strong>69 33 130State61 31 143Social Science3 6 8303330
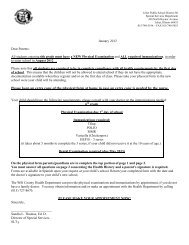
56-099-0<strong>86</strong>0-05-2020Taft Elementary School 2TEACHER INFORMATION (Full-Time Equivalents)<strong>District</strong>StateWhiteBlackHispanicAsianNativeHawaiian/PacificislanderAmericanIndianTwo orMoreRacesUnknownMaleFemaleTotalNumber77.7 10.4 10.5 1.2 0.0 0.0 0.2 0.012.4 87.6 62483.3 7.1 5.3 1.3 0.1 0.2 0.8 2.023.1 76.9 127,830TEACHER INFORMATION ( Continued )AverageTeachingExperience(Years)% ofTeacherswithBachelor'sDegrees% ofTeacherswithMaster's& Above% ofTeachers withEmergency orProvisionalCredentials% ofClasses NotTaught byHighly QualifiedTeachersSchool -- -- --0.0 0.0<strong>District</strong>10.5 59.0 40.6 0.7 0.0State12.9 37.8 61.7 0.6 0.7Some teacher/administrator data are not collected at the school level.<strong>SCHOOL</strong> DISTRICT FINANCESTEACHER/ADMINISTRATOR SALARIES (Full-Time Equivalents)$200,000$160,000$120,000$98,111$110,870Salaries and counts of staff are summedacross a district based on the percentage oftime that each individual is employed as ateacher or an administrator and may or maynot reflect the actual paid salaries for thedistrict.$80,000$56,520$66,614<strong>District</strong>$40,000State$0Average Teacher SalaryAverage Administrator SalaryEXPENDITURE BY FUNCTION 2010-11 (Percentages)60.050.047.0 48.340.030.020.010.00.02.8 3.336.230.713.917.7<strong>District</strong>StateInstructionGeneralAdministrationSupportingServicesOtherExpenditures
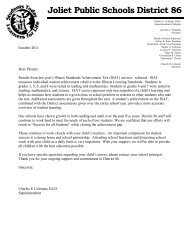
56-099-0<strong>86</strong>0-05-2020Taft Elementary School 3REVENUE BY SOURCE 2010-11<strong>District</strong><strong>District</strong> %State %EXPENDITURE BY FUND 2010-11<strong>District</strong><strong>District</strong> %State %Local Property TaxesOther Local FundingGeneral State AidOther State FundingFederal Funding$35,199,673$2,955,800$49,114,094$33,225,069$19,998,77225.12.135.023.614.258.25.117.19.510.1EducationOperations & MaintenanceTransportationDebt ServiceTortMunicipal Retirement/Social SecurityFire Prevention & SafetyCapital Projects$83,927,261$8,969,956$7,261,014$6,034,409$125,000$2,823,654$240,276$10,262,88970.17.56.15.00.12.40.28.673.75.93.87.41.22.00.85.1TOTAL$140,493,408TOTAL$119,644,459OTHER FINANCIAL INDICATORS2009 EqualizedAssessed Valuationper Pupil<strong>District</strong>State2009 Total SchoolTax Rateper $100$121,325 2.61** **2010-11 InstructionalExpenditureper Pupil$5,453$6,8242010-11 OperatingExpenditureper Pupil$9,746$11,664** Due to the way Illinois school districts are configured, state averages for equalized assessed valuation per pupil and total school tax rate per $100 are not provided.Equalized assessed valuation includes all computed property values upon which a district's local tax rate is calculated.Total school tax rate is a district's total tax rate as it appears on local property tax bills.Instructional expenditure per pupil includes the direct costs of teaching pupils or the interaction between teachers and pupils.Operating expenditure per pupil includes the gross operating cost of a school district excluding summer school, adult education, bond principal retired, and capital expenditures.ACADEMIC PERFORMANCEOVERALL STUDENT PERFORMANCEThese charts present the overall percentages of state test scores categorized as meeting or exceeding the Illinois LearningStandards for your school, district, and the state. They respresent your school's performance in reading, mathematics, andscience.OVERALL PERFORMANCE - ALL STATE TESTS1008079.7<strong>86</strong>.574.6 75.1 76.5 76.760402010-112011-12200School <strong>District</strong> State
56-099-0<strong>86</strong>0-05-2020Taft Elementary School 4OVERALL <strong>ILLINOIS</strong> STANDARDS ACHIEVEMENT TEST (ISAT) PERFORMANCE1008080.087.174.7 75.182.0 82.16040202010-112011-120School <strong>District</strong> State
56-099-0<strong>86</strong>0-05-2020Taft Elementary School 5ISAT PERFORMANCEThese charts provide information on attainment of the Illinois Learning Standards. They show the percents of student scoresmeeting or exceeding Standards for the grades and subjects tested on ISAT.ISAT Grade 3100806089.279.562.7 66.9 74.7 76.188.5 91.9 80.1 83.1 87.3 87.72010-11402011-12200School<strong>District</strong> StateSchool <strong>District</strong> StateReadingMathematicsISAT Grade 410080604072.6 78.9 64.5 66.074.7 76.085.598.682.4 84.087.7 88.177.0 80.3 62.0 61.979.3 79.82010-112011-12200School<strong>District</strong>StateSchool<strong>District</strong>StateSchool<strong>District</strong>StateReadingMathematicsScienceISAT Grade 51008082.173.969.8 68.576.4 77.881.2 87.5 82.1 80.484.0 83.660402010-112011-12200School<strong>District</strong> StateSchool <strong>District</strong>StateReadingMathematics
56-099-0<strong>86</strong>0-05-2020Taft Elementary School 6PERFORMANCE ON STATE ASSESSMENTSFederal law requires that student achievement results for reading, mathematics, and science for schools providing Title Iservices be reported to the general public.The Illinois Standards Achievement Test (ISAT) is administered to students in grades 3 through 8. The Prairie StateAchievement Examination (PSAE) is administered to students in grade 11. The Illinois Alternate Assessment (IAA) isadministered to students with disabilities whose Individualized Education Programs (IEPs) indicate that participation in theISAT or PSAE would not be appropriate.Students with disabilities have an IEP (No Child Left Behind Act). An IEP is a written plan for a child with a disability who iseligible to receive special education services under the Individuals with Disabilities Education Act.Reading and Mathematics are tested in grades 3 through 8 and 11. Science is tested in grades 4, 7, and 11.In order to protect students' identities, test data for groups of fewer than ten students are not reported.PERCENTAGE OF STUDENTS NOT TESTED IN STATE TESTING PROGRAMS FOR READINGGenderRacial/Ethnic BackgroundAllMaleFemaleWhiteBlackHispanicAsianNativeHawaiian/PacificislanderAmericanIndianTwo orMoreRacesLEPMigrantStudentswithDisabilitiesEconomicallyDisadvantagedSchool*EnrollmentReading2060.01070.0990.0820.0250.0870.03009140.00250.01340.0<strong>District</strong>*EnrollmentReading6,9090.23,5630.23,3460.21,0570.32,0280.23,4230.2450.0083480.07830.401,0120.55,5040.2State*EnrollmentReading1,072,3040.4548,6900.5523,3520.3547,9000.3192,9770.7251,4400.445,1880.39770.63,1770.629,9680.475,0310.62612.3146,1130.9531,1570.5* Enrollment as reported during the testing windows for grades 3 - 8 and 11.Number of LEP Students who have attended schools in the U.S. for less than 12 months and are not assessed on the State's reading/language arts test: 0
56-099-0<strong>86</strong>0-05-2020Taft Elementary School 7PERCENTAGE OF STUDENTS NOT TESTED IN STATE TESTING PROGRAMS FOR MATHEMATICSGenderRacial/Ethnic BackgroundSchool*EnrollmentMathematicsAll2060.0Male1070.0Female990.0White820.0Black250.0Hispanic870.0Asian3NativeHawaiian/Pacificislander0AmericanIndianTwo orMoreRaces0 9LEP140.0Migrant0StudentswithDisabilities250.0EconomicallyDisadvantaged1340.0<strong>District</strong>*EnrollmentMathematics6,9160.23,5660.13,3500.21,0570.32,0290.13,4280.1450.0083490.07890.301,0120.45,5120.1State*EnrollmentMathematics1,073,7640.4549,4620.4524,0400.3548,2340.3193,0640.7252,0130.445,6380.29830.53,1800.529,9750.476,5020.32711.1146,1330.9532,2140.5* Enrollment as reported during the testing windows for grades 3 - 8 and 11.PERCENTAGE OF STUDENTS NOT TESTED IN STATE TESTING PROGRAMS FOR SCIENCEGenderRacial/Ethnic BackgroundAllMaleFemaleWhiteBlackHispanicAsianNativeHawaiian/PacificislanderAmericanIndianTwo orMoreRacesLEPMigrantStudentswithDisabilitiesEconomicallyDisadvantagedSchool*EnrollmentScience710.0340.0370.0260.0100.0300.02003402450.0<strong>District</strong>*EnrollmentScience2,2660.71,1640.81,1020.63471.26691.01,1040.4200.0051210.82340.403270.91,8190.6State*EnrollmentScience456,7210.7232,9920.8223,6510.6237,9120.581,7801.4103,5940.719,2110.33931.01,3590.912,2540.725,8590.81070.961,9411.6217,9881.0* Enrollment as reported during the testing windows for grades 4, 7, and 11.<strong>ILLINOIS</strong> STANDARDS ACHIEVEMENT TEST (ISAT)The following tables show the percentages of student scores in each of four performance levels. These levels wereestablished with the help of Illinois educators who teach the grade levels and learning areas tested. Due to rounding, the sumof the percentages in the four performance levels may not always equal 100.Level 1 -- Academic Warning -Level 2 -- Below Standards -Level 3 -- Meets Standards -Level 4 -- Exceeds Standards -Student work demonstrates limited knowledge and skills in the subject. Because of major gaps in learning, students applyknowledge and skills ineffectively.Student work demonstrates basic knowledge and skills in the subject. However, because of gaps in learning, studentsapply knowledge and skills in limited ways.Student work demonstrates proficient knowledge and skills in the subject. Students effectively apply knowledge and skillsto solve problems.Student work demonstrates advanced knowledge and skills in the subject. Students creatively apply knowledge and skillsto solve problems and evaluate the results.
56-099-0<strong>86</strong>0-05-2020Taft Elementary School 8Grade 3Grade 3 - AllReadingMathematicsLevels 1 2 3 4 1 2 3 4School 2.7 8.1 59.5 29.7 0.0 8.1 48.6 43.2<strong>District</strong> 7.6 25.5 48.3 18.6 3.2 13.6 53.8 29.3State 5.2 18.7 46.1 29.9 2.9 9.3 45.2 42.5Grade 3 - GenderMaleFemaleLevelsSchool 2.4 4.9 65.9 26.8 0.0 4.9 43.9 51.2<strong>District</strong> 9.5 28.0 46.6 15.9 3.6 14.2 53.6 28.6State 6.4 20.8 46.1 26.7 3.2 9.3 44.0 43.5School<strong>District</strong>StateReadingMathematics1 2 3 4 1 2 3 43.05.63.912.122.816.651.550.146.233.321.533.30.02.92.612.113.09.454.554.146.633.330.141.4Grade 3 - Racial/Ethnic BackgroundReadingMathematicsLevels 1 2 3 4 1 2 3 4WhiteSchool 3.1 0.0 56.3 40.6 0.0 3.1 28.1 68.8<strong>District</strong> 8.3 15.4 41.4 34.9 0.6 8.9 42.6 47.9State 2.5 11.7 45.9 39.9 1.1 4.6 39.2 55.0BlackSchool<strong>District</strong> 8.8 29.9 47.8 13.5 6.7 19.9 53.7 19.6State 9.3 28.3 46.9 15.4 7.1 17.9 53.8 21.2HispanicSchool 3.4 13.8 62.1 20.7 0.0 10.3 69.0 20.7<strong>District</strong>6.9 27.3 50.1 15.7 2.1 12.0 57.4 28.5State8.3 28.0 47.6 16.1 3.8 13.8 54.7 27.7AsianSchool<strong>District</strong>State2.0 7.4 36.7 53.9 1.0 3.0 25.1 70.8Native Hawaiian/PacificIslanderSchool<strong>District</strong>State3.4 7.4 45.9 43.2 2.0 3.4 37.8 56.8American IndianSchool<strong>District</strong>State 3.9 24.8 45.1 26.2 2.0 12.3 51.0 34.8Two or More RacesSchool<strong>District</strong>State7.43.713.215.051.546.727.934.62.92.08.87.952.944.035.346.1Grade 3 - Economically DisadvantagedLevelsFree/Reduced Price LunchSchool<strong>District</strong>StateNot EligibleSchool<strong>District</strong>StateReadingMathematics1 2 3 4 1 2 3 44.88.78.30.03.61.79.527.827.46.316.49.166.748.248.550.048.843.519.015.315.943.831.245.70.03.64.70.01.60.99.515.414.56.36.83.564.356.654.328.143.235.126.224.426.465.648.460.5
56-099-0<strong>86</strong>0-05-2020Taft Elementary School 9Grade 4Grade 4 - AllReadingLevels 1 2 3 41Mathematics2 34Science1 2 3 4School<strong>District</strong>State0.0 21.1 54.9 23.91.5 32.5 49.7 16.21.0 23.0 47.1 28.90.0 1.4 57.7 40.81.3 14.7 66.3 17.71.2 10.7 57.1 31.01.4 18.3 69.0 11.36.2 31.9 54.1 7.72.6 17.6 59.7 20.1Grade 4 - GenderMaleFemaleLevelsSchool 0.0 17.6 55.9 26.5 0.0 0.0 52.9 47.1 0.0 17.6 67.6<strong>District</strong> 2.3 37.8 47.1 12.8 1.7 16.1 66.3 15.9 6.6 31.9 53.6State 1.3 26.7 46.8 25.2 1.5 11.4 56.0 31.1 2.9 17.4 57.4School<strong>District</strong>StateReading1 2 3 40.0 24.3 54.1 21.60.7 27.3 52.3 19.70.6 19.2 47.4 32.8Mathematics1 2 3 40.0 2.7 62.2 35.11.0 13.3 66.2 19.50.9 9.9 58.4 30.8Science1 2 3 4Grade 4 - Racial/Ethnic BackgroundReadingMathematicsScienceWhiteLevelsSchool10.0219.2350.0430.810.020.0353.8446.210.0211.5373.1415.4<strong>District</strong> 0.5 21.1 52.4 25.9 1.6 9.1 58.6 30.6 3.3 19.0 60.9 16.8State 0.5 14.3 46.9 38.3 0.6 6.0 53.6 39.8 1.0 9.6 61.2 28.22.75.92.318.931.917.970.354.762.014.77.922.38.17.517.8BlackSchool 0.0 40.0 50.0 10.0 0.0 0.0 80.0 20.0 0.0 40.0 50.0 10.0<strong>District</strong> 2.0 40.1 46.2 11.7 2.3 20.6 67.7 9.3 9.4 40.5 46.6 3.5State 2.0 39.0 45.6 13.5 3.0 20.9 61.8 14.3 6.1 33.8 54.1 6.0HispanicAsianNative Hawaiian/PacificIslanderSchool<strong>District</strong>StateAmerican IndianSchoolSchool 0.0 20.0 53.3 26.7 0.0 3.3 53.3 43.3 3.3 20.0 66.7 10.0<strong>District</strong> 1.7 31.1 50.8 16.4 0.5 12.1 68.3 19.1 4.9 31.6 56.0 7.5State 1.3 32.3 50.0 16.4 1.4 14.5 64.7 19.4 3.8 24.6 61.8 9.9School<strong>District</strong> 0.0 27.3 54.5 18.2 9.1 9.1 45.5 36.4 18.2 9.1 54.5 18.2State 0.4 9.1 38.2 52.3 0.6 3.3 35.9 60.2 1.4 7.3 52.6 38.7<strong>District</strong>0.8 14.4 48.8 36.0 0.0 6.3 50.0 43.8 0.8 13.4 58.3 27.6State 1.0 25.5 51.6 22.0 1.4 10.5 64.2 23.9 3.3 21.5 60.4 14.8Two or More RacesSchool<strong>District</strong> 0.0 38.2 50.0 11.8 1.5 22.1 66.2 10.3 7.4 30.9 57.4 4.4State 0.6 19.4 46.7 33.3 0.8 9.1 55.8 34.3 1.9 15.1 58.6 24.4
56-099-0<strong>86</strong>0-05-2020Taft Elementary School 10Grade 4 - Economically DisadvantagedLevelsFree/Reduced Price LunchSchool<strong>District</strong>StateReading1 2 3 40.0 24.4 60.0 15.61.9 36.3 49.2 12.61.6 34.2 49.0 15.21Mathematics2 30.0 2.2 62.2 35.61.5 16.4 68.4 13.72.0 16.5 64.2 17.4412.27.14.3Science2 3 422.235.626.768.951.759.76.75.69.4Not EligibleSchool<strong>District</strong>State0.0 15.4 46.2 38.50.0 16.3 52.0 31.70.3 10.9 45.1 43.70.0 0.0 50.0 50.00.4 7.5 57.5 34.60.4 4.5 49.5 45.60.02.20.811.516.37.969.264.859.719.216.731.6Grade 5Grade 5 - AllLevels1Reading2 341Mathematics2 34School<strong>District</strong>State0.00.10.217.931.422.060.752.347.221.416.330.61.80.70.610.718.915.778.6 8.973.6 6.<strong>86</strong>5.9 17.7Grade 5 - GenderMaleFemaleLevelsSchool 0.0 21.4 57.1 21.4 3.6 7.1 85.7 3.6<strong>District</strong> 0.2 38.8 46.2 14.8 1.2 20.8 70.7 7.3State 0.2 25.5 47.4 26.9 0.8 16.8 64.3 18.1School<strong>District</strong>StateReadingMathematics1 2 3 4 1 2 3 40.00.00.114.323.618.464.358.647.021.417.834.50.00.20.514.316.914.671.476.767.614.36.217.2Grade 5 - Racial/Ethnic BackgroundReadingMathematicsLevels 1 2 3 4 1 2 3 4WhiteSchool 0.0 13.6 63.6 22.7 0.0 9.1 81.8 9.1<strong>District</strong> 0.0 18.0 52.3 29.7 0.0 9.3 76.2 14.5State 0.1 12.7 46.3 41.0 0.3 9.1 66.6 24.0BlackSchool<strong>District</strong> 0.3 41.8 48.2 9.7 1.5 31.0 63.8 3.6State 0.4 38.1 48.0 13.5 1.5 30.3 63.1 5.1HispanicSchool 0.0 24.0 56.0 20.0 4.0 12.0 76.0 8.0<strong>District</strong>StateSchool<strong>District</strong>StateHawaiian/PacificSchool<strong>District</strong>StateIndianSchool0.00.20.10.030.632.59.212.654.949.839.150.514.517.551.736.90.30.80.30.015.621.05.39.177.969.649.569.16.28.644.921.8AsianNativeIslanderAmerican<strong>District</strong>State 0.2 26.3 53.8 19.6 0.5 20.6 67.2 11.7Two or More RacesSchool<strong>District</strong>State0.00.220.416.549.046.930.636.42.00.514.313.179.664.94.121.4
56-099-0<strong>86</strong>0-05-2020Taft Elementary School 11Grade 5 - Students with DisabilitiesReadingMathematicsLevels 1 2 3 4 1 2 3 4IEPSchool0.0 72.7 27.3 0.0 9.1 36.4 45.5 9.1<strong>District</strong>0.7 72.1 24.3 2.9 4.3 47.1 45.0 3.6State0.9 60.2 31.5 7.3 3.2 42.7 49.4 4.7Non-IEPSchool0.0 4.4 68.9 26.7 0.0 4.4 <strong>86</strong>.7 8.9<strong>District</strong>0.0 25.7 56.1 18.1 0.2 15.0 77.6 7.2State0.1 16.5 49.5 34.0 0.3 11.8 68.3 19.6Grade 5 - Economically DisadvantagedLevelsFree/Reduced Price LunchSchool<strong>District</strong>StateNot EligibleSchool<strong>District</strong>StateReadingMathematics1 2 3 4 1 2 3 40.00.10.30.00.00.120.534.333.58.316.710.065.953.449.741.746.444.513.612.116.550.037.045.52.30.71.00.00.50.213.621.324.00.07.37.175.072.467.691.779.764.29.15.67.48.312.528.4
56-099-0<strong>86</strong>0-05-2020Taft Elementary School 122012 ADEQUATE YEARLY PROGRESS (AYP) STATUS <strong>REPORT</strong>Is this school making Adequate Yearly Progress (AYP)?YesHas this school been identified for School Improvement according to theAYP specifications of the federal No Child Left Behind Act?NoIs this school making AYP in Reading?Yes2012-13 Federal Improvement StatusIs this school making AYP in Mathematics?Yes2012-13 State Improvement StatusReadingPercent Tested onState TestsMathematicsPercent Meeting/Exceeding Standards *ReadingMathematicsSafeSafe% Met % Met % Harbor Met % Harbor Met %AYPAYPTarget ** AYPTarget ** AYPAttendance RateOther IndicatorsMetAYP5-YEARGraduation Rate%MetAYPState AYPMinimum Target95.0 95.0 85.0 85.0 91.0 82.0All100.0Yes100.0Yes83.8Yes92.4Yes95.9YesWhite100.0Yes100.0Yes88.3Yes94.8YesBlackHispanic100.0Yes100.0Yes79.5Yes89.7YesAsianNative Hawaiian/Pacific IslanderAmerican IndianTwo or MoreRacesLEPStudents withDisabilitiesEconomicallyDisadvantaged100.0Yes100.0Yes81.0Yes90.5YesFour Conditions Are Required For Making Adequate Yearly Progress (AYP):1. At least 95% tested in reading and mathematics for every student group. If the current year participation rate is less than 95%, this condition maybe met if the average of the current and preceding year rates is at least 95%, or if the average of the current and two preceding years is at least 95%.Only actual participation rates are printed. If the participation rate printed is less than 95% and yet this school makes AYP, it means that the 95%condition was met by averaging.2. At least 85% meeting/exceeding standards in reading and mathematics for every group. For any group with less than 85% meeting/exceedingstandards, a 95% confidence interval was applied. Subgroups may meet this condition through Safe Harbor provisions. ***3. At least 91% attendance rate for non-high schools and at least 82% graduation rate for high schools.* Includes only students enrolled as of 05/01/2011.** Safe Harbor Targets of 85% or above are not printed.*** Subgroups with fewer than 45 students are not reported. Safe Harbor only applies to subgroups of 45 or more. In order for Safe Harbor to apply, asubgroup must decrease by 10% the percentage of scores that did not meet state standards from the previous year plus meet the other indicators(attendance rate for non-high schools and graduation rate for high schools) for the subgroup. For subgroups that do not meet their Safe HarborTargets, a 75% confidence interval is applied. Safe Harbor allows schools an alternate method to meet subgroup minimum targets on achievement.