Crop Harvest Report 2011Fiesta top faba bean in 2010By Andrew Ware, SARDI New VarietyAgronomy, Port LincolnFiesta VF narrowly topped NVTand PBA faba bean trials in SouthAustralia in 2010. Nura followedclosely behind, averaging 1% less thanFiesta across all trials in SA, with 2009 topvariety, Farah, 3% behind Fiesta.The majority of faba bean trials weresown in mid - late May, and establishedwell.Where there was a lack of disease,conditions for faba bean growth in 2010were excellent. faba beans proved betterthan other pulse crops in being able tosurvive waterlogged soils.Average site yields ranged from the2.3 t/ ha at chocolate spot affectedCockaleechie, on Lower Eyre Peninsulato 5.4t/ha at Bool Lagoon, in the SouthEast.Frequent rain events during spring,meant that Chocolate Spot (CS) was thebiggest disease challenge in faba beans in2010. High disease pressure was observedin field trials located at Saddleworth,Tarlee, and Cockaleechie. Most NVT andbreeding trials had foliar fungicide(s)applied to control CS and were veryeffective when applied during earlyflowering.Disease assessments showed many highyielding well-adapted lines developedby the Australian faba bean BreedingProgram, based at the University ofAdelaide, exhibit improved resistance toCS.These lines rated 3.0 compared tocurrent cultivars rated at 5.5 in a highdisease pressure field trial at Saddleworthi n 2 0 1 0 ( r e c e i v e d o n eapplication of fungicide).Severity of cercospora leafspot, ascochtya and chocolateobserved in field trials wasvariable and reflected theinfluence of paddock history,proximity to infested residues,t h e t i m i n g o f f u n g i c i d eapplications and their interactions withlocal weather conditions.Lodging was an issue at several siteswhere excellent growth had occurred(Tarlee, Maitland, and Bool Lagoon).Nura had slightly better standing abilityat these sites compared to Farah andFiesta.Trials that were harvested afterthe significant rainfall events inlate November and early Decemberexperienced high levels of seed stainingand discolouration.At the Tarlee site Fiesta experienced thehighest levels of seed staining, followedby Doza and Farah, with Nura having thelowest levels.Fiesta was the top per formingcommercial variety at six of the 14 fababean evaluation sites in SA in 2010, andwas highest yielding at all three sites inthe South East.Nura <strong>performed</strong> the <strong>best</strong> at five sites,including on the Upper Eyre Peninsula,the Mallee, and three sites in the Mid-North/ Central district. Farah <strong>performed</strong>well at both sites on Yorke Peninsula.Long term averages show that Farahand Fiesta are the most consistentperformers in terms of grain yieldover a number of years across SouthAustralia, with Nura only 1% behind.Andrew WareNotes on newly releasedbroad bean varietyPBA Kareema was selectedAfrom Aquadulce with similaradaptation to this variety butwith larger and more uniformseed, and no “evergreens”.It is well adapted to the veryhigh rainfall, broad bean districts in thelower south-east of SA.It has significantly improved resistanceto ascochyta blight (MR-R) and betterrust resistance (MR) than Aquadulce andis slightly less susceptible to chocolatespot than other faba beans.The yield of PBA Kareema has beensimilar to, or slightly greater than,Aquadulce in trials in the South East ofSA over the past 9 years.It is licensed to PGG Wrightson Seedsand an end point royalty applies.Refer to PBA Kareema variety brochurewww.grdc.com.au/director/events/grdcpublications/pba or www.pulseaus.com.au/pdf/PBA%20Kareema%20Website%20Final.pdfThe contribution of data andinformation for this report fromthe Pulse Breeding Australia fababean Breeding Program by Dr JeffPaull, University of Adelaide, andRohan Kimber, SARDI, is gratefullyacknowledged.More information:Andrew Ware (08) 8688 3417,andrew.ware@sa.gov.au34 > SARDI Crop Harvest Report 2 0 1 1
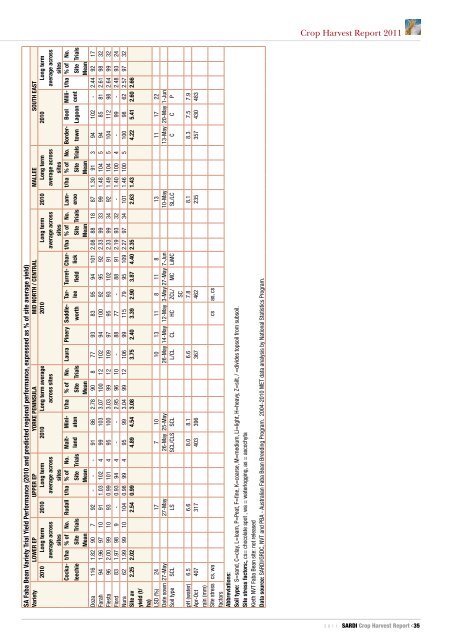
Crop Harvest Report 2011SA Faba Bean Variety Trial Yield Performance (2010 and predicted regional performance, expressed as % of site average yield)Variety LOWER EP UPPER EP YORKE PENINSULA MID NORTH / CENTRAL MALLEE SOUTH EAST2010 Long termaverage acrosssitest/ha % ofSiteMeanNo.Trials2010 Long termaverage acrosssitesRudall t/ha % ofSiteMeanNo.Trials2010 Long term averageacross sitesCockaleechieMaitlandMinlatont/ha % ofSiteMeanNo.Trials2010 Long termaverage acrosssitest/ha % ofSiteMeanNo.Trials2010 Long termaverage acrosssitest/ha % ofSiteMeanNo.Trials2010 Long termaverage acrosssitesDoza 116 1.82 90 7 92 - - - 91 86 2.78 90 8 77 93 83 95 94 101 2.08 88 18 87 1.30 91 3 94 102 - 2.44 92 17Farah 94 1.96 97 10 91 1.03 102 4 99 103 3.07 100 12 102 94 100 92 95 92 2.33 99 33 99 1.48 104 5 94 85 81 2.61 98 32Fiesta 96 2.00 99 10 93 0.99 101 4 95 100 3.03 99 12 109 97 95 93 102 91 2.33 99 34 92 1.49 104 5 104 112 98 2.64 99 32Fiord 83 1.97 98 9 - 0.93 94 4 - - 2.95 96 10 - 88 77 - 88 91 2.19 93 32 - 1.40 100 4 - 99 - 2.48 93 24Nura 62 1.99 99 10 104 0.98 99 4 95 99 3.04 99 12 106 99 115 79 95 109 2.27 97 34 101 1.46 100 5 100 98 62 2.57 97 32Site avyield (t/ha)2.25 2.02 2.54 0.99 4.89 4.54 3.08 3.75 2.40 3.39 2.90 3.87 4.40 2.35 2.63 1.43 4.22 5.41 2.60 2.66LSD (%) 24 17 7 10 10 13 11 8 11 8 13 11 17 22Date sown 27-May 27-May 26-May 25-May 26-May 14-May 12-May 3-May 27-May 7-Jun 10-May 13-May 20-May 1-JunSoil type SCL LS SCL/CLS SCL L/CL CL HC ZCL/ SCMC LiMC SL/LC C C PpH (water) 6.5 6.6 8.0 8.1 6.6 7.8 8.1 8.3 7.5 7.9Apr-Oct 407 317 403 396 367 462 235 357 430 483rain (mm)Site stressfactorscs, wa cs as, csAbbreviations:Soil type: S=sand, C=clay, L=loam, P=Peat, F=fine, K=coarse, M=medium, Li=light, H=heavy, Z=silt, / =divides topsoil from subsoil.Site stress factors:, cs= chocolate spot , wa = waterlogging, as = ascochytaKieth NVT Faba Bean site: not releasedData source: SARDI/GRDC, NVT and PBA - Australian Faba Bean Breeding Program. 2004-2010 MET data analysis by National Statistics Program.BoolLagoonLaura Pinery SaddleworthTarleeTurretfieldCharlickLamerooBordertownMillicentt/ha % ofSiteMeanNo.Trials2 0 1 1 SARDI Crop Harvest Report < 35