On the surface topography of ultrashort laser pulse treated steel ...
On the surface topography of ultrashort laser pulse treated steel ...
On the surface topography of ultrashort laser pulse treated steel ...

Create successful ePaper yourself
Turn your PDF publications into a flip-book with our unique Google optimized e-Paper software.
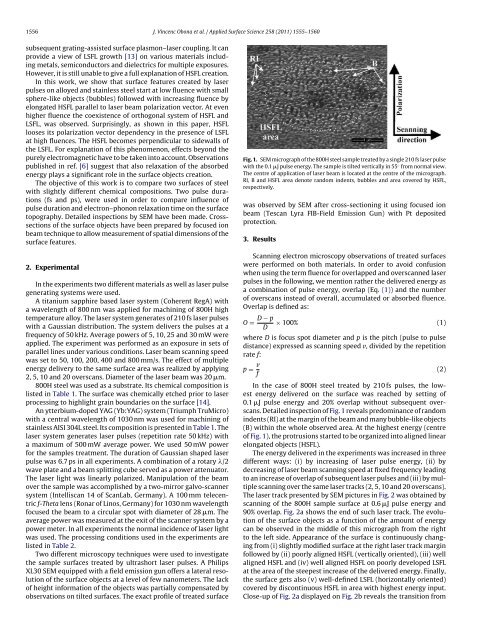
1556 J. Vincenc Obona et al. / Applied Surface Science 258 (2011) 1555–1560subsequent grating-assisted <strong>surface</strong> plasmon–<strong>laser</strong> coupling. It canprovide a view <strong>of</strong> LSFL growth [13] on various materials includingmetals, semiconductors and dielectrics for multiple exposures.However, it is still unable to give a full explanation <strong>of</strong> HSFL creation.In this work, we show that <strong>surface</strong> features created by <strong>laser</strong><strong>pulse</strong>s on alloyed and stainless <strong>steel</strong> start at low fluence with smallsphere-like objects (bubbles) followed with increasing fluence byelongated HSFL parallel to <strong>laser</strong> beam polarization vector. At evenhigher fluence <strong>the</strong> coexistence <strong>of</strong> orthogonal system <strong>of</strong> HSFL andLSFL, was observed. Surprisingly, as shown in this paper, HSFLlooses its polarization vector dependency in <strong>the</strong> presence <strong>of</strong> LSFLat high fluences. The HSFL becomes perpendicular to sidewalls <strong>of</strong><strong>the</strong> LSFL. For explanation <strong>of</strong> this phenomenon, effects beyond <strong>the</strong>purely electromagnetic have to be taken into account. Observationspublished in ref. [6] suggest that also relaxation <strong>of</strong> <strong>the</strong> absorbedenergy plays a significant role in <strong>the</strong> <strong>surface</strong> objects creation.The objective <strong>of</strong> this work is to compare two <strong>surface</strong>s <strong>of</strong> <strong>steel</strong>with slightly different chemical compositions. Two <strong>pulse</strong> durations(fs and ps), were used in order to compare influence <strong>of</strong><strong>pulse</strong> duration and electron–phonon relaxation time on <strong>the</strong> <strong>surface</strong><strong>topography</strong>. Detailed inspections by SEM have been made. Crosssections<strong>of</strong> <strong>the</strong> <strong>surface</strong> objects have been prepared by focused ionbeam technique to allow measurement <strong>of</strong> spatial dimensions <strong>of</strong> <strong>the</strong><strong>surface</strong> features.2. ExperimentalIn <strong>the</strong> experiments two different materials as well as <strong>laser</strong> <strong>pulse</strong>generating systems were used.A titanium sapphire based <strong>laser</strong> system (Coherent RegA) witha wavelength <strong>of</strong> 800 nm was applied for machining <strong>of</strong> 800H hightemperature alloy. The <strong>laser</strong> system generates <strong>of</strong> 210 fs <strong>laser</strong> <strong>pulse</strong>swith a Gaussian distribution. The system delivers <strong>the</strong> <strong>pulse</strong>s at afrequency <strong>of</strong> 50 kHz. Average powers <strong>of</strong> 5, 10, 25 and 30 mW wereapplied. The experiment was performed as an exposure in sets <strong>of</strong>parallel lines under various conditions. Laser beam scanning speedwas set to 50, 100, 200, 400 and 800 mm/s. The effect <strong>of</strong> multipleenergy delivery to <strong>the</strong> same <strong>surface</strong> area was realized by applying2, 5, 10 and 20 overscans. Diameter <strong>of</strong> <strong>the</strong> <strong>laser</strong> beam was 20 m.800H <strong>steel</strong> was used as a substrate. Its chemical composition islisted in Table 1. The <strong>surface</strong> was chemically etched prior to <strong>laser</strong>processing to highlight grain boundaries on <strong>the</strong> <strong>surface</strong> [14].An ytterbium-doped YAG (Yb:YAG) system (Triumph TruMicro)with a central wavelength <strong>of</strong> 1030 nm was used for machining <strong>of</strong>stainless AISI 304L <strong>steel</strong>. Its composition is presented in Table 1. The<strong>laser</strong> system generates <strong>laser</strong> <strong>pulse</strong>s (repetition rate 50 kHz) witha maximum <strong>of</strong> 500 mW average power. We used 50 mW powerfor <strong>the</strong> samples treatment. The duration <strong>of</strong> Gaussian shaped <strong>laser</strong><strong>pulse</strong> was 6.7 ps in all experiments. A combination <strong>of</strong> a rotary /2wave plate and a beam splitting cube served as a power attenuator.The <strong>laser</strong> light was linearly polarized. Manipulation <strong>of</strong> <strong>the</strong> beamover <strong>the</strong> sample was accomplished by a two-mirror galvo-scannersystem (Intelliscan 14 <strong>of</strong> ScanLab, Germany). A 100 mm telecentricf-Theta lens (Ronar <strong>of</strong> Linos, Germany) for 1030 nm wavelengthfocused <strong>the</strong> beam to a circular spot with diameter <strong>of</strong> 28 m. Theaverage power was measured at <strong>the</strong> exit <strong>of</strong> <strong>the</strong> scanner system by apower meter. In all experiments <strong>the</strong> normal incidence <strong>of</strong> <strong>laser</strong> lightwas used. The processing conditions used in <strong>the</strong> experiments arelisted in Table 2.Two different microscopy techniques were used to investigate<strong>the</strong> sample <strong>surface</strong>s <strong>treated</strong> by <strong>ultrashort</strong> <strong>laser</strong> <strong>pulse</strong>s. A PhilipsXL30 SEM equipped with a field emission gun <strong>of</strong>fers a lateral resolution<strong>of</strong> <strong>the</strong> <strong>surface</strong> objects at a level <strong>of</strong> few nanometers. The lack<strong>of</strong> height information <strong>of</strong> <strong>the</strong> objects was partially compensated byobservations on tilted <strong>surface</strong>s. The exact pr<strong>of</strong>ile <strong>of</strong> <strong>treated</strong> <strong>surface</strong>Fig. 1. SEM micrograph <strong>of</strong> <strong>the</strong> 800H <strong>steel</strong> sample <strong>treated</strong> by a single 210 fs <strong>laser</strong> <strong>pulse</strong>with <strong>the</strong> 0.1 J <strong>pulse</strong> energy. The sample is tilted vertically in 55 ◦ from normal view.The centre <strong>of</strong> application <strong>of</strong> <strong>laser</strong> beam is located at <strong>the</strong> centre <strong>of</strong> <strong>the</strong> micrograph.RI, B and HSFL area denote random indents, bubbles and area covered by HSFL,respectively.was observed by SEM after cross-sectioning it using focused ionbeam (Tescan Lyra FIB-Field Emission Gun) with Pt depositedprotection.3. ResultsScanning electron microscopy observations <strong>of</strong> <strong>treated</strong> <strong>surface</strong>swere performed on both materials. In order to avoid confusionwhen using <strong>the</strong> term fluence for overlapped and overscanned <strong>laser</strong><strong>pulse</strong>s in <strong>the</strong> following, we mention ra<strong>the</strong>r <strong>the</strong> delivered energy asa combination <strong>of</strong> <strong>pulse</strong> energy, overlap (Eq. (1)) and <strong>the</strong> number<strong>of</strong> overscans instead <strong>of</strong> overall, accumulated or absorbed fluence.Overlap is defined as:O = D − pD × 100% (1)where D is focus spot diameter and p is <strong>the</strong> pitch (<strong>pulse</strong> to <strong>pulse</strong>distance) expressed as scanning speed v, divided by <strong>the</strong> repetitionrate f:p = v fIn <strong>the</strong> case <strong>of</strong> 800H <strong>steel</strong> <strong>treated</strong> by 210 fs <strong>pulse</strong>s, <strong>the</strong> lowestenergy delivered on <strong>the</strong> <strong>surface</strong> was reached by setting <strong>of</strong>0.1 J <strong>pulse</strong> energy and 20% overlap without subsequent overscans.Detailed inspection <strong>of</strong> Fig. 1 reveals predominance <strong>of</strong> randomindents (RI) at <strong>the</strong> margin <strong>of</strong> <strong>the</strong> beam and many bubble-like objects(B) within <strong>the</strong> whole observed area. At <strong>the</strong> highest energy (centre<strong>of</strong> Fig. 1), <strong>the</strong> protrusions started to be organized into aligned linearelongated objects (HSFL).The energy delivered in <strong>the</strong> experiments was increased in threedifferent ways: (i) by increasing <strong>of</strong> <strong>laser</strong> <strong>pulse</strong> energy, (ii) bydecreasing <strong>of</strong> <strong>laser</strong> beam scanning speed at fixed frequency leadingto an increase <strong>of</strong> overlap <strong>of</strong> subsequent <strong>laser</strong> <strong>pulse</strong>s and (iii) by multiplescanning over <strong>the</strong> same <strong>laser</strong> tracks (2, 5, 10 and 20 overscans).The <strong>laser</strong> track presented by SEM pictures in Fig. 2 was obtained byscanning <strong>of</strong> <strong>the</strong> 800H sample <strong>surface</strong> at 0.6 J <strong>pulse</strong> energy and90% overlap. Fig. 2a shows <strong>the</strong> end <strong>of</strong> such <strong>laser</strong> track. The evolution<strong>of</strong> <strong>the</strong> <strong>surface</strong> objects as a function <strong>of</strong> <strong>the</strong> amount <strong>of</strong> energycan be observed in <strong>the</strong> middle <strong>of</strong> this micrograph from <strong>the</strong> rightto <strong>the</strong> left side. Appearance <strong>of</strong> <strong>the</strong> <strong>surface</strong> is continuously changingfrom (i) slightly modified <strong>surface</strong> at <strong>the</strong> right <strong>laser</strong> track marginfollowed by (ii) poorly aligned HSFL (vertically oriented), (iii) wellaligned HSFL and (iv) well aligned HSFL on poorly developed LSFLat <strong>the</strong> area <strong>of</strong> <strong>the</strong> steepest increase <strong>of</strong> <strong>the</strong> delivered energy. Finally,<strong>the</strong> <strong>surface</strong> gets also (v) well-defined LSFL (horizontally oriented)covered by discontinuous HSFL in area with highest energy input.Close-up <strong>of</strong> Fig. 2a displayed on Fig. 2b reveals <strong>the</strong> transition from(2)