Water Resource Publication Duck Pond Drainage Basin OPP-WRP ...
Water Resource Publication Duck Pond Drainage Basin OPP-WRP ...
Water Resource Publication Duck Pond Drainage Basin OPP-WRP ...

Create successful ePaper yourself
Turn your PDF publications into a flip-book with our unique Google optimized e-Paper software.
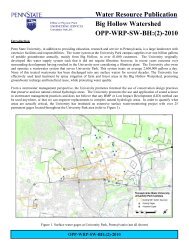
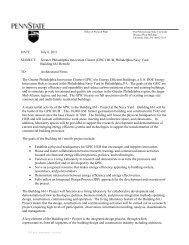
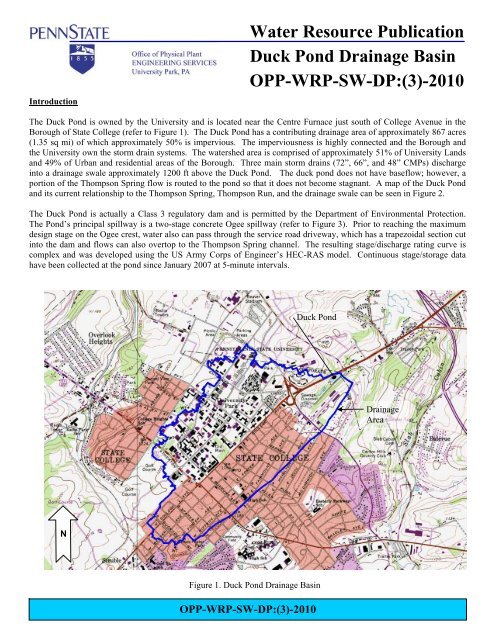
Introduction<strong>Water</strong> <strong>Resource</strong> <strong>Publication</strong><strong>Duck</strong> <strong>Pond</strong> <strong>Drainage</strong> <strong>Basin</strong><strong>OPP</strong>-<strong>WRP</strong>-SW-DP:(3)-2010The <strong>Duck</strong> <strong>Pond</strong> is owned by the University and is located near the Centre Furnace just south of College Avenue in theBorough of State College (refer to Figure 1). The <strong>Duck</strong> <strong>Pond</strong> has a contributing drainage area of approximately 867 acres(1.35 sq mi) of which approximately 50% is impervious. The imperviousness is highly connected and the Borough andthe University own the storm drain systems. The watershed area is comprised of approximately 51% of University Landsand 49% of Urban and residential areas of the Borough. Three main storm drains (72”, 66”, and 48” CMPs) dischargeinto a drainage swale approximately 1200 ft above the <strong>Duck</strong> <strong>Pond</strong>. The duck pond does not have baseflow; however, aportion of the Thompson Spring flow is routed to the pond so that it does not become stagnant. A map of the <strong>Duck</strong> <strong>Pond</strong>and its current relationship to the Thompson Spring, Thompson Run, and the drainage swale can be seen in Figure 2.The <strong>Duck</strong> <strong>Pond</strong> is actually a Class 3 regulatory dam and is permitted by the Department of Environmental Protection.The <strong>Pond</strong>’s principal spillway is a two-stage concrete Ogee spillway (refer to Figure 3). Prior to reaching the maximumdesign stage on the Ogee crest, water also can pass through the service road driveway, which has a trapezoidal section cutinto the dam and flows can also overtop to the Thompson Spring channel. The resulting stage/discharge rating curve iscomplex and was developed using the US Army Corps of Engineer’s HEC-RAS model. Continuous stage/storage datahave been collected at the pond since January 2007 at 5-minute intervals.<strong>Duck</strong> <strong>Pond</strong><strong>Drainage</strong>AreaNFigure 1. <strong>Duck</strong> <strong>Pond</strong> <strong>Drainage</strong> <strong>Basin</strong><strong>OPP</strong>-<strong>WRP</strong>-SW-DP:(3)-2010
Penn State University<strong>Water</strong> <strong>Resource</strong> <strong>Publication</strong>NFigure 2. Relationship of the <strong>Duck</strong> <strong>Pond</strong> to Other <strong>Water</strong> FeaturesFigure 3. Photograph of the <strong>Duck</strong> <strong>Pond</strong>’s Ogee Spillway on September 30, 2010<strong>OPP</strong>-<strong>WRP</strong>-SW-DP:(3)-2010
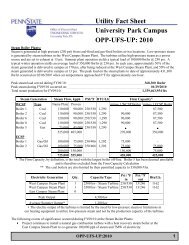
Penn State University<strong>Water</strong> <strong>Resource</strong> <strong>Publication</strong>Soils and GeologyThe majority of the <strong>Duck</strong> <strong>Pond</strong> <strong>Drainage</strong> <strong>Basin</strong> soils are identified as the Hagerstown Series, Opequon-Hagerstowncomplex or Urban soils by the Soil Survey of Centre County. The most significant limitations identified in the soil surveyfor these soils is possible sinkhole formation and ground water pollution hazard if the soil is used for waste disposal.Although all of these soils are traditionally considered to be hydrologic soil group (HSG) C soils by the NRCS, anintensive analysis conducted for the Spring Creek <strong>Drainage</strong> <strong>Basin</strong> (ACT 167 Plan) has shown that the soils morereasonably respond as HSG B soils.The majority of the watershed is underlain by bedrock of the Nittany limestone (On) formation, which is described bydark-gray, finely to coarsely crystalline dolomite. The Nittany formation has good subsurface drainage; sinkholes andcaves are characteristic. The area to the southeast is underlain by bedrock of the Axemann limestone (Oa) formation,which is described by light-gray, fossiliferous, coarsely crystalline; interbedded with silty, fine-grained dolomiticlimestone. The Axemann formation has good subsurface drainage and minor surface drainage.Hydrologic ResponseThis <strong>WRP</strong> covers the four year period of record from January 1 st , 2007 through December 31 st , 2010. Data were collectedat 5-minute intervals and the record is complete. During the 2007, 2008, 2009, and 2010 years 35.9, 41.5, 36.5, and 37.7inches of precipitation fell respectively in the watershed as recorded at the Walker Building Weather Station (38.7 inchaverage for 114 year record). Thirteen events represent NOAA Atlas 14 Intensity-Duration-Frequency events greater thanor equal to a 1-year precipitation event. Because some areas of the drainage basin are highly connected, almost all rainfallevents result in an increased discharge from the pond. The discharges for the four years can be seen in Figure 4.Figure 4. Discharge from the <strong>Duck</strong> <strong>Pond</strong> from 1/1/08 to 12/31/2010<strong>OPP</strong>-<strong>WRP</strong>-SW-DP:(3)-2010
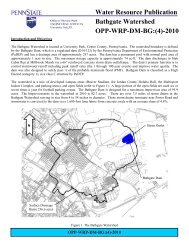
Penn State University<strong>Water</strong> <strong>Resource</strong> <strong>Publication</strong>Because spring flows are diverted to the pond, an annual discharge has not been computed; however, peak runoff ratesand event runoff volumes have been computed for all events over 0.5” of precipitation as seen in Table 1. The event ofAugust 12 th , 2009 resulted in the highest event runoff peak rate (745.3 cfs) for the period of record resulting from 1.9” ofrainfall of which 1.75” fell in one hour. The June 22 nd , 2008 event resulted in the second highest peak runoff rate (675.3cfs) and also had 1.9” of rainfall occur in 2 hours with 1.62” in one hour. The runoff hydrograph for the August 12 th ,2009 event can be seen in Figure 5.Table 1. Event Statistics for Precipitation Events Greater than 0.5 inchesEventEventRainfall Event Event Percent Rainfall Event Event PercentDate (in) Qp (cfs) Q (ac-ft) Q/P (%) Date (in) Qp (cfs) Q (ac-ft) Q/P (%)1/8/2007 0.82 53.4 16.8 28% 12/24/2008 1.21 86.9 43.8 50%3/2/2007 0.53 101.3 21.0 55% 3/9/2009 0.63 40.6 9.3 20%4/2/2007 0.55 27.2 8.7 22% 4/15/2009 1.21 46.2 21.3 24%4/12/2007 0.60 59.3 11.7 27% 5/5/2009 0.68 38.7 12.7 26%4/15/2007 0.67 40.0 11.9 25% 5/29/2009 0.72 196.0 18.2 35%4/26/2007 0.80 59.8 15.1 26% 6/4/2009 0.56 130.3 10.9 27%5/2/2007 0.69 41.2 12.7 26% 6/20/2009 1.42 224.6 36.5 36%6/4/2007 1.01 202.9 19.8 27% 6/29/2009 0.52 248.4 11.2 30%6/20/2007 0.51 47.8 9.5 26% 7/24/2009 1.02 389.7 27.4 37%7/12/2007 1.09 405.6 24.4 31% 7/30/2009 0.50 20.5 7.2 20%7/20/2007 0.51 142.6 10.9 30% 8/1/2009 1.77 322.9 55.7 44%8/8/2007 1.21 371.8 32.4 37% 8/12/2009 1.90 745.3 55.7 41%8/10/2007 0.69 113.6 13.8 28% 8/29/2009 1.01 164.5 21.2 29%8/21/2007 2.18 181.6 53.1 34% 9/12/2009 0.99 155.3 18.2 25%9/11/2007 0.68 295.5 17.7 36% 9/27/2009 0.84 51.0 13.9 23%10/24/2007 0.77 29.0 14.0 25% 10/24/2009 1.63 138.7 31.1 26%10/27/2007 0.69 162.4 14.7 29% 10/28/2009 0.56 33.4 8.5 21%11/15/2007 0.72 50.4 16.4 32% 11/20/2009 0.57 30.8 8.3 20%11/27/2007 0.87 79.9 15.4 25% 12/3/2009 0.50 19.9 8 22%12/24/2007 1.02 268.6 46.0 62% 12/14/2009 0.50 36.5 10.7 30%1/11/2008 0.51 51.2 9.4 26% 1/18/2010 0.75 34.8 12.0 22%2/6/2008 0.50 86.5 13.8 38% 1/25/2010 1.90 326.7 49.7 36%3/5/2008 2.34 249.2 89.0 53% 3/14/2010 1.83 46.1 34.7 26%3/8/2008 0.87 50.2 16.6 26% 3/26/2010 0.55 25.8 8.7 22%3/9/2008 0.69 120.8 15.6 31% 3/29/2010 0.87 111.8 18.0 29%4/21/2008 1.12 156.1 27.1 33% 5/12/2010 1.15 208.7 29.2 35%4/27/2008 1.69 509.7 61.2 50% 5/23/2010 0.60 89.7 10.8 25%5/4/2008 1.07 309.9 29.9 39% 6/10/2010 1.14 147.6 29.1 35%5/12/2008 0.98 103.4 25.5 36% 7/10/2010 2.12 435.9 62.1 41%6/22/2008 1.90 675.3 60.8 44% 7/25/2010 0.53 196.3 14.2 37%8/6/2008 0.68 242.2 16.1 33% 8/22/2010 1.49 229.6 44.5 41%8/29/2008 0.60 30.4 7.7 18% 9/17/2010 0.73 74.2 11.1 21%9/9/2008 1.30 462.7 49.9 53% 9/28/2010 0.72 189.1 14.8 28%9/13/2008 1.07 154.1 26.7 34% 10/1/2010 3.66 356.3 120.2 45%9/27/2008 0.55 51.7 8.4 21% 11/17/2010 0.92 140.2 14.2 21%9/28/2008 1.58 177.9 42.4 37% 11/26/2010 1.05 52.8 21.2 28%10/26/2008 1.17 186.4 40.0 47% 12/1/2010 2.58 303.8 87.1 47%<strong>OPP</strong>-<strong>WRP</strong>-SW-DP:(3)-2010
Penn State University<strong>Water</strong> <strong>Resource</strong> <strong>Publication</strong>Figure 5. Runoff Event of August 13, 2009The data in Table 1 represents 74 precipitation events from 0.5 to 3.66 inches, but does not include snowfall events. Therunoff to rainfall ratios for the data are: average = 32%, maximum = 62%, minimum = 18%, with a standard deviation of9.6% with the more significant precipitation events generally resulting in the higher ratios. An analysis of hydrologicparameters shows that the maximum event 60 minute rainfall intensity is highly correlated (R 2 =0.91) with the peak runoffrate as seen in Figure 6. This would be expected since the watershed time of concentration is approximately 1 hour.Figure 6. Correlation of Peak Runoff Rate to Maximum 60 Minute Precipitation Intensity<strong>OPP</strong>-<strong>WRP</strong>-SW-DP:(3)-2010
Penn State University<strong>Water</strong> <strong>Resource</strong> <strong>Publication</strong>While it is clear that currently uncalibrated hydrologic models of the watershed generally produce significantly higherpeak runoff rates than observed, the use of synthetic 24-hour design storms also appears to be problematic in thewatershed. The University’s Office of Physical Plant currently collects extensive hydrologic data and is currently in theprocess of further analyzing the watershed.Miscellaneous Information<strong>Drainage</strong> <strong>Basin</strong>s: Thompson Run/Slab Cabin Run/Spring Creek/Bald Eagle Creek/West Branch Susquehanna RiverPA Title 25, Chapter 93 <strong>Water</strong> Quality Classification: High Quality Cold <strong>Water</strong> Fishery (HQ-CWF)USGS Quadrangle: State CollegeHydrologic Unit Code: 02050204 (Thompson Run Unt 23037)Latitude/Longitude: 40° 47’ 45” / 77° 50’ 35”<strong>Basin</strong> Municipalities: State College Borough, College TownshipMunicipal Separate Storm Sewer System (MS4) Permit: PAI-134807<strong>Basin</strong> Stormwater Management Plan: Spring Creek Act 167, Adopted August 6, 2002Bathgate Dam Permit: D14-92Publisher: Penn State University, Office of Physical Plant, Energy and Engineering Division, Engineering ServicesEditor: Larry Fennessey, <strong>OPP</strong> Stormwater Engineer, Ph: (814) 863-8743, email: laf8@psu.edu<strong>OPP</strong>-<strong>WRP</strong>-SW-DP:(3)-2010