Unit 2 Statistics Booklet - Newbattle Community High School
Unit 2 Statistics Booklet - Newbattle Community High School
Unit 2 Statistics Booklet - Newbattle Community High School

You also want an ePaper? Increase the reach of your titles
YUMPU automatically turns print PDFs into web optimized ePapers that Google loves.
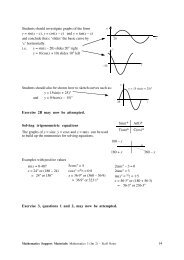
The Pie ChartExercise 31. Mr. Johnston’s Maths class has 28 pupils in it.They were persuaded to vote for their favouritemaths topic.The pie chart shows how they votedSums 4Trigonometry 2Calculus 10<strong>Statistics</strong> 5Measurement 7.(a) Which topic is represented by the letter:(i) a (ii) b in the diagram?(b) What percentage of the class is represented by letter d?(c) What fraction of the class liked Sums?Mr. Johnston's Maths Classed acb2. A college canteen draws up a pie chartshowing the number of apples eatenin a week by each of the 200 students whouse the canteen.(a) Calculate how many of the 200 students eat:(i) 3 apples in a week(ii) 1 apple in a week.(b) Use the answer to i) to find how many applesare actually eaten by these ‘3 apple’ students.(c) Calculate the total number of appleseaten in a week.3.FILMSFILMS40%2 apples20%1 apple20%0 apples10%4 apples10%3 applesSpeed 2Die HardLostWorldBatman&RobinMrs. Abraham asked her primarysix class of 32 pupils to choosetheir favourite film.(a) What fraction of the class chose(i) Batman & Robin(ii) Die Hard?(b) How many pupils chose theLost World?Mathematics: Mathematics 2 (Int 1) <strong>Statistics</strong> – Student Materials 10