Unit 2 Statistics Booklet - Newbattle Community High School
Unit 2 Statistics Booklet - Newbattle Community High School
Unit 2 Statistics Booklet - Newbattle Community High School

You also want an ePaper? Increase the reach of your titles
YUMPU automatically turns print PDFs into web optimized ePapers that Google loves.
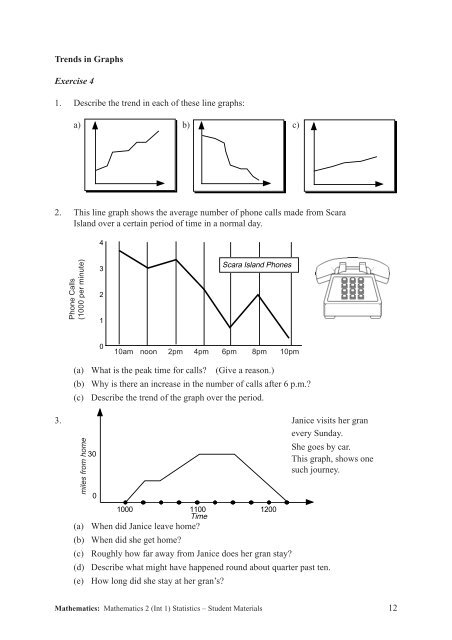
Trends in GraphsExercise 41. Describe the trend in each of these line graphs:a) b) c)2. This line graph shows the average number of phone calls made from ScaraIsland over a certain period Scara of time Island in Phones a normal day.4Phone Calls(1000 per minute)321Scara Island Phones(a)(b)(c)010 10am noon 2 2pm4 4pm6 6pm 8 8pm 10 10pmWhat is the peak time for calls? (Give a reason.)Why is there an increase in the number of calls after 6 p.m.?Describe the trend of the graph over the period.3. Janice visits her granevery Sunday.She goes by car.30This graph, shows onesuch journey.miles from home(a)(b)(c)(d)(e)010001100 1200TimeWhen did Janice leave home?When did she get home?Roughly how far away from Janice does her gran stay?Describe what might have happened round about quarter past ten.How long did she stay at her gran’s?Mathematics: Mathematics 2 (Int 1) <strong>Statistics</strong> – Student Materials 12