Unit 2 Statistics Booklet - Newbattle Community High School
Unit 2 Statistics Booklet - Newbattle Community High School
Unit 2 Statistics Booklet - Newbattle Community High School

You also want an ePaper? Increase the reach of your titles
YUMPU automatically turns print PDFs into web optimized ePapers that Google loves.
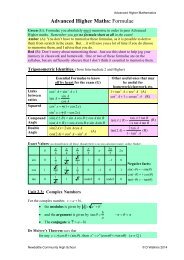
MATHEMATICS 2 (INTERMEDIATE 1)Checkup Exercise 11. A number of children decided to spend their October week’s holiday swimming orplaying badminton. The table shows those who took part.Day Mon. Tues. Wed. Thurs. Fri.Swimming 60 25 75 60 10Badminton 20 45 15 55 7080706050403020Illustrate this information on a BAR GRAPH. (similar to this one)100Day2. The number of games consoles being bought by children in Scotland since 1980 isillustrated by a line graph.60Thousands50mi 40ll 30ion 20s1001980 1984 1988 1992 1996 2000Year(a) How many children bought a console in (i) 1980 (ii) 1996?(b) What is the increase from 1996 - 2000?(c) Between which two periods was there the greatest increase?(d) Describe the general trend of the graph.3. 5%A survey on ‘crisps’ was carried out among 600BeefBaconshoppers in a supermarket one Saturday morning.The pie chart shows the results.(a) What percentage chose:10% PrawnChicken (i) Chicken (ii) Cheese (iii) Bacon?(b) How many people chose:Cheese(i) Prawn (ii) Beef ( iii) Cheese?(c) Calculate the total number of shoppers wholiked prawn, bacon and beef crisps.Mathematics: Mathematics 2 (Int 1) <strong>Statistics</strong> – Student Materials 22