Unit 2 Statistics Booklet - Newbattle Community High School
Unit 2 Statistics Booklet - Newbattle Community High School
Unit 2 Statistics Booklet - Newbattle Community High School

You also want an ePaper? Increase the reach of your titles
YUMPU automatically turns print PDFs into web optimized ePapers that Google loves.
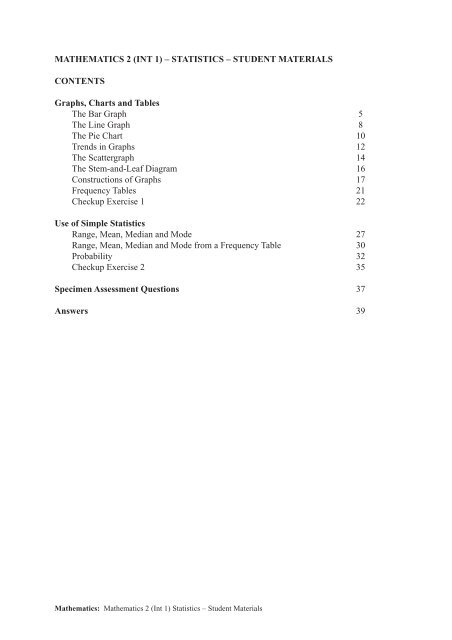
MATHEMATICS 2 (INT 1) – STATISTICS – STUDENT MATERIALSCONTENTSGraphs, Charts and TablesThe Bar Graph 5The Line Graph 8The Pie Chart 10Trends in Graphs 12The Scattergraph 14The Stem-and-Leaf Diagram 16Constructions of Graphs 17Frequency Tables 21Checkup Exercise 1 22Use of Simple <strong>Statistics</strong>Range, Mean, Median and Mode 27Range, Mean, Median and Mode from a Frequency Table 30Probability 32Checkup Exercise 2 35Specimen Assessment Questions 37Answers 39Mathematics: Mathematics 2 (Int 1) <strong>Statistics</strong> – Student Materials 1
Mathematics: Mathematics 2 (Int 1) <strong>Statistics</strong> – Student Materials 4
The Bar Graph (Chart)Exercise 11. The bar graph shows the results ofa survey into how many childrenwere in the families of an S1 class.All the pupils took part.(a)(b)(c)(d)How many pupils hadfour children in their family?How many pupils had less thanthree children in their family?How many children were therein the class?How many of the class had nobrothers or sisters? Explain.Number of families1210864201 2 3 4 5Children in family2. This bar chart shows how manyviewers regularly watch Channels 1to 5 on television.Viewers in millions40353025201510501 2 3 4 5TV Channels(a) Which TV Channel is thefavourite one?(b) Which one is watched by theleast number of viewers?(c) Which two channels have thesame number of viewers?(d) How many people in totalwatch the channels?(e) Which TV Channel hasabout one quarter of the viewers?Mathematics: Mathematics 2 (Int 1) <strong>Statistics</strong> – Student Materials 5
3. This diagram shows thenumber of people (inmillions) who wentabroad on holiday in1997.Holiday DestinationSpainIbizaGreeceMajorcaGran Canaria012Holidaymakers (millions)34(a) Which country was: (i) the most popular (ii) the least popular?(b) Why is it difficult to give exact numbers?(c) Write down the names of the countries and estimate how many people went toeach country.70presents4. A survey was carried out in asecondary school about thepreference of pupils forpresents or money for theirChristmas gift. All pupilsvoted and the results aredisplayed in this compoundbar chart.Number of pupils605040302010money(a) Which year group has the0greatest difference inS1 S2 S3 S4 S5 S6the vote?(b) In which year groups did lessthan 30 pupils vote for presents?(c) In S4, what was the differencein the vote?(d) Which year groups have the same number of pupils voting for presents?(e) In which year group is the vote for presents the same as that for money?(f) How many pupils are in S1?(g) Why is there only one ‘bar’ for S6?Mathematics: Mathematics 2 (Int 1) <strong>Statistics</strong> – Student Materials 6
5. The diagram refers to the sales of three large sports shops in Scotland.Their major sales are in football gear, golf clubs and cricket equipment.Millions of £’s(a)(b)(c)(d)How much were the golf sales in Allsports?What is the total sales for football gear in the three shops?What is the difference between the amount of golf sales in Allsports comparedwith Clubsports?What is the total sales of cricket gear in Betasports and Clubsports?Mathematics: Mathematics 2 (Int 1) <strong>Statistics</strong> – Student Materials 7
The Line GraphExercise 21. The temperature on top of a town hall was taken every morning at 11.00 a.m.This line graph was made up from the recordings.Temperature (˚C)876543210-1-2-3-4M T W Th Fr Sat Su M T W Th Fr Sat Su(Week 1) (Week 2)(a) What was the temperature on:(i) the Wednesday of week 1 (ii) the Friday of week 2?(b) What was the fall in temperature from Tuesday, week 2 - until Friday, week 2?(c) Between which two days was there the biggest rise in temperature?(d) What was the trend of the graph from Wednesday to Saturday of the first week?2. Someone was also recording the temperature of the rooms inside the town hallevery hour from when she arrived at 7 a.m. until 6 p.m.302826Temperature (˚C)24222018161412107am 8am 9am 10am 11am noon 1pm 2pm 3pm 4pm 5pm 6pmMathematics: Mathematics 2 (Int 1) <strong>Statistics</strong> – Student Materials 8
(a)(b)(c)(d)(e)(f)(g)When do you think that the heating was switched on?What was the highest temperature?When was this?Suggest a reason for the sudden dip from 2 p.m. till 3 p.m.Between which times did the temperature rise the most slowly?What was the longest time that the temperature kept rising?When was the heating officially switched off?3. The line graph shows the number of swimming trunks, bikinis etc. bought in asuperstore during the months of January to October in a normal year.1210Swim Wear (1000’s)86420Jan Feb March April May June July Aug Sept Oct(Sales month)(a)(b)(c)(d)(e)(f)Why are sales so low during January?When do the sales remain the same?(three answers required).During which month do the sales rise the most?When is the most dramatic fall in sales and by how much?When are sales at a peak? Why is this?Although sales are not great in September - why do you think that swim wearis still being bought?Mathematics: Mathematics 2 (Int 1) <strong>Statistics</strong> – Student Materials 9
The Pie ChartExercise 31. Mr. Johnston’s Maths class has 28 pupils in it.They were persuaded to vote for their favouritemaths topic.The pie chart shows how they votedSums 4Trigonometry 2Calculus 10<strong>Statistics</strong> 5Measurement 7.(a) Which topic is represented by the letter:(i) a (ii) b in the diagram?(b) What percentage of the class is represented by letter d?(c) What fraction of the class liked Sums?Mr. Johnston's Maths Classed acb2. A college canteen draws up a pie chartshowing the number of apples eatenin a week by each of the 200 students whouse the canteen.(a) Calculate how many of the 200 students eat:(i) 3 apples in a week(ii) 1 apple in a week.(b) Use the answer to i) to find how many applesare actually eaten by these ‘3 apple’ students.(c) Calculate the total number of appleseaten in a week.3.FILMSFILMS40%2 apples20%1 apple20%0 apples10%4 apples10%3 applesSpeed 2Die HardLostWorldBatman&RobinMrs. Abraham asked her primarysix class of 32 pupils to choosetheir favourite film.(a) What fraction of the class chose(i) Batman & Robin(ii) Die Hard?(b) How many pupils chose theLost World?Mathematics: Mathematics 2 (Int 1) <strong>Statistics</strong> – Student Materials 10
4. For the year 1996 - 1997, the gross income of a company was £3 700 000.After taking off the costs of running the company, a profit of £500 000 wasdeclared.Running Costs 1996 - 97wagesmiscellaneous14%21.0%fuel42%This pie-chartshows how therunning costs wereused.rent5%18%materials(a)(b)(c)(d)Calculate how much the running costs must have been.From the pie chart, find what percentage of the running costs was‘miscellaneous’.What was the actual amount of money spent on wages?Calculate (do not measure) the size of the angle used to represent ‘rent’ inthe pie chart.5. This pie chart represents the resultsof a survey of 240 senior citizens asto what their favourite breakfastcereal was.WeetabixFrostiesCorn FlakesAll Bran(a)(b)Use a PROTRACTOR to measurethe size of each angle.Calculate how many senior citizens liked:(i) All Bran (ii) Corn Flakes(iii) Weetabix(iv) Frosties.Mathematics: Mathematics 2 (Int 1) <strong>Statistics</strong> – Student Materials 11
Trends in GraphsExercise 41. Describe the trend in each of these line graphs:a) b) c)2. This line graph shows the average number of phone calls made from ScaraIsland over a certain period Scara of time Island in Phones a normal day.4Phone Calls(1000 per minute)321Scara Island Phones(a)(b)(c)010 10am noon 2 2pm4 4pm6 6pm 8 8pm 10 10pmWhat is the peak time for calls? (Give a reason.)Why is there an increase in the number of calls after 6 p.m.?Describe the trend of the graph over the period.3. Janice visits her granevery Sunday.She goes by car.30This graph, shows onesuch journey.miles from home(a)(b)(c)(d)(e)010001100 1200TimeWhen did Janice leave home?When did she get home?Roughly how far away from Janice does her gran stay?Describe what might have happened round about quarter past ten.How long did she stay at her gran’s?Mathematics: Mathematics 2 (Int 1) <strong>Statistics</strong> – Student Materials 12
4.buscarplanetrainbuscarplaneSeries 1Series 2Series 3Series 4planetrainbustraincar1958 1998These pie charts give some indication of the changes in methods of transport over thepast 40 years.Describe in detail the major changes, giving reasons for your answers.5. A modern two-tier fish tank is filled with water from a tap at a steady rate.One of the graphs below indicates the change in the height of the water as thetank fills.Which graph is it? ..... and give a reason for your choice.1 2 3 4heightheightheightheighttime 1 time 2time 3time 4Mathematics: Mathematics 2 (Int 1) <strong>Statistics</strong> – Student Materials 13
The ScattergraphExercise 51. The scattergraph shows the heightand weight of six children.(a) What height is Fred?(b) What weight is Eric?(c) Which two children are thesame height?(d) Who is the lightest?(e) Who is the shortest?Height (in cm)2101801501209060300AnnxxFredxHenryxDonxJanxEric10 20 30 40 50 60Weight (in kg)2. This graph shows a relationbetween the temperature duringthe day and the sales of ice lollieson that day.(a) Suggest a connection betweenthe temperature and the salesof ice lollies.(b) Use the chart to estimate thenumber of ice lollies whichmight be sold when thetemperature reaches 35 degrees.(c) Estimate what the temperaturewas when thirteen ice lollies weresold?Sales of ice lollies20181614121086420xxxx x x xxx x xx x xx xxx5 10 15 20 25 30 35Temperature ˚C3. This scattergraph shows theprices which taxi cabs chargefor fairly short distances.(a) Suggest a connectionbetween the fare and thenumber of miles travelled.(b) Why is there a cross at (0,0)?(c) Use the chart to give areasonable guess at howfar you could go in a taxifor £1·50.(d) How much do you think a6 mile journey would cost?cost (£)£4·00 4£3·00 3£2·00 2£1·00 10000 2 4 6 8distance travelled (miles)Mathematics: Mathematics 2 (Int 1) <strong>Statistics</strong> – Student Materials 14
4. ‘Trylin Yachts’ cost £100 000 new.The graph shows what price secondhand Trylin yachts are sold for.(a) Between which years doyachts fall in value by thelargest amount?(b) Suggest a connection betweenwhat you would have to payfor a yacht and its age.(c) Use the graph to estimatehow old a yacht might beif you spent £50 000 buyingit second hand.(d) From the graph, how much doyou think an two year oldyacht would cost?Cost (not new) £100010090807060504030201001 2 3 4 5 6Age of Yacht (years)5. A green keeper at Grey Golf Club had terrible trouble trying to get grass togrow in the rough. He was recommended to try three new grass growing treatments,one on each of three holes. He hoped for good, steady growth which would thenlet him cut the grass to his desired height.The results are shown in the scatter graphs:Treatment ATreatment BHeightofGrass* * * * * * * * **HeightofGrass* * * * * * **Amount AppliedAmount AppliedTreatment CHeightofGrass* **** * *****Amount Applied(a)(b)Comment on the effect each treatment (and the amount used) has on the grass.If you were the greenkeeper which one would you use? Why?Mathematics: Mathematics 2 (Int 1) <strong>Statistics</strong> – Student Materials 15
The Stem-and-Leaf DiagramExercise 61. The stem-and-leaf diagram shows thenumber of cases of dog food sold ata supermarket each week over a6 month period.Write out the weekly sales, in order,and find how many weeks the saleswere more than the target of 35.1 4 72 9 1 7 3 13 7 1 6 4 6 2 84 1 0 8 9 2 15 3 4 1 46 2 133 | 3 | 1 represents 31 312.1 872 19 253 24 37 694 135 22 33 556 30 587 45 7344 | | 13 represents £413This ‘two digit’ stem-and-leaf diagram showsthe daily takings over a fortnight (in pounds)for Grant’s Sweet Shop.Write out (in order) the fourteen daily takings.3. A machine weighs out coffee and puts it into packets.The machine is checked at 11 a.m. and again at 4 p.m. to see if its output issatisfactory.The results of the inspection on 15/9/98 are shown below in a back-to-backstem-and-leaf chart. The weights are in grams.11 a. m. 4 p. m.382 0 3 7 39 6 41 3 5 0 3 4 40 7 0 6 5 40 1 7 2 2 6 41 5 2 7 22 0 0 2 42 9 843 0 1 4 1stem × 1041 leaves | 7 represents × 10 417gA sample of 20 packets was weighed both times.(a) At which time (11 a.m. or 4 p.m.) did the machine produce:(i) 411 grams (ii) 434 grams?(b) Of the 20 packets sampled at 11 a.m., how many weighed from 391 to 406 grams?Mathematics: Mathematics 2 (Int 1) <strong>Statistics</strong> – Student Materials 16
Construction of GraphsExercise 71. The Park Sports Centre began its winter programme with the following numberof under 16s enrolling on the opening night.Swimming Fencing Football Aerobics Keep FitGirls 120 108 9 62 19Boys 85 32 05 22 5Draw a compound BAR CHART to illustrate this information.2. The following table shows the weekly wages of young, part-time workers inOrkam Superstore.Wage in £’s 10 -19 20 - 29 30 - 39 40 - 49 50 - 59 60 - 69 70 - 79No. Workers 3 7 23 29 38 14 1Draw a BAR CHART of the distribution.3. The height of a sun flower was measured each week for 8 weeks.Here are the results:Week Wage Number in £’s 10 -191 20 - 292 30 - 39 3 40 - 494 50 - 559 606- 69 70 7 - 879 Height No. (cm) Workers 35 78 2320 29 30 38 45 59 65 89Show this information in a LINE GRAPH.4. A sample of school children was looked at in 1997 for 6 months, regarding theireating habits in school at lunchtime. A comparison was made between those whohad school lunches and those who brought their own food.The results are shown in the table:Month Jan Feb March April May June% school lunch 75 70 60 60 30 5% own food 10 10 30 35 40 65(a)(b)Use the scale shown to draw LINE GRAPHS ofthe data on the same diagram.Make at least three comments on the results ofthe survey.% diners20100jan feb mar ...monthMathematics: Mathematics 2 (Int 1) <strong>Statistics</strong> – Student Materials 17
5. Here is a table of exam marks (out of 50) from a modern languages department.Pupils Name Ali Bo Ed Dan Flo Hal Nan Pen Rab SidFrench Mark 5 10 10 20 15 30 30 40 40 45German Mark 5 5 10 15 20 25 30 35 35 45(a) Draw a diagram similar to the one shown, usingthe same scale for each axis.(b) Plot the information from the table to make aSCATTER DIAGRAM.(c) Describe some connections between theFrench marks and the German marks.(d) Draw a line of best fit through points.(e) Use the graph to estimate what the Germanmark would be if French was 35.(f) One person seems to go against the trend.Who is it?.... and what makes you think that?French Mark504540353025201510505 10 15 20German Mark6. Brad and his pals record the number of take-away meals they deliver eachevening, and the time it takes them.Time (mins) 25 22 20 20 15 13 9 15 17 14No. Meals 40 33 30 32 22 20 13 20 21 19The average time is 17 minutes and the average number of take-away meals is 25.(a) Draw up a set of axes on squared paper, with meals on the horizontal axisand time on the vertical axis. Using suitable scales draw a SCATTER DIAGRAM.(b) Draw a line of best fit through the point (25,17). (meals = 25, time = 17)(c) Estimate the time it would take Brad & Co. to deliver 28 meals.7. Dino, the cafe owner, measured the amount of fresh orange juice he was losingfrom a large container due to a faulty tap. The table shows the results.Time (minutes) 0 1 2 3 4 5 6 7 8Juice (cm 3 ) 0 6 11 18 25 30 35 43 48(a)(b)(c)Show the results in a scatter diagram.On the graph, draw the line of best fit through the points.Use the line to estimate the volume of orange juice lost in:(i) 2 1 /2 minutes (ii) 7 1 /2 minutesMathematics: Mathematics 2 (Int 1) <strong>Statistics</strong> – Student Materials 18
8. The results in the table below make you believe that the warmer it gets, the lessrainfall there is.Ave Temp (°C) 5 10 10 12 15 18 20 24 28 30 35 40Ave Rainfall (mm) 90 80 70 68 58 35 15 17 17 15 12 8(a)(b)(c)(d)Draw a scatter graph with Temperature (°C) along the horizontal axis andthe rainfall (mm) on the vertical axis.Draw a line of best fit through these points on your diagram.Estimate, (see line), the temperature which best matches a rainfall of 50 mm.Estimate what the rainfall might be when the temperature was 25°C.9. The table shows the weight of a gorilla in a Zoo at various times in itslife, and the corresponding daily weight of food (in kg) eaten by the gorilla atthose times.Food per day 3 9 10 15 15 18 25 26 30 35 40 45 50(in kg)Weight (in kg) 5 50 100 90 100 100 200 180 200 350 350 450 500of gorilla(a)(b)(c)(d)Draw a scatter diagram to representthe information.Draw the line of best fit.Use the graph to estimate:the weight of the gorilla when itsdaily food consumption was(i) 20 kg (ii) 60 kg.Estimate the daily food intake of thegorilla when it weighed 400 kg.(Weight of gorilla)5004003002001000 5 10 15 20 etc(Weight of food)10. Copy these axes and draw SCATTER DIAGRAMS which show the connectionsbetween the items shown.Amount of SunAmount of SunAmount of SunBuying ofWellington BootsBuying ofNewspapersBuying ofSwim WearMathematics: Mathematics 2 (Int 1) <strong>Statistics</strong> – Student Materials 19
11. Construct a simple stem-and-leaf diagram to display the following golf scores,shot by the USA team in The Ryder Cup, Spain in 1997.66 79 80 78 69 66 68 80 7778 93 78 67 62 74 64 81 7560 66 78 77 84 76 72 69 9063 62 84 75 75 71 65 64 7312. A factory has two machines for packing flour into 2 kg packets. 40 packetsfrom each machine were weighed, in grams, and the results were as follows.MACHINE 12020 2014 2019 2005 2020 2023 2015 2006 2013 20122021 2011 2019 2021 2013 2000 2020 2026 2018 20072038 2018 2016 2017 2010 2019 2013 2012 2020 20212002 2015 2013 2017 2019 2020 2016 2025 2014 2028MACHINE 22005 2016 2019 2017 2029 2018 2020 2023 2014 20222020 2018 2020 2000 2020 2033 2010 2013 2030 20052013 2019 2021 2016 2012 2017 1999 2021 2014 20091998 2002 2004 2005 2007 2011 2016 2020 2001 2003Make a back to back stem-and-leaf diagram for the figures.State one or two things you notice about the two graphs and compare them.13. A teacher wanted to compare the marks of her two first year classes in a test.She had the feeling that one class was a good bit better than the other.Here are the results of the test:CLASS 1XCLASS 1Y5 7 14 17 19 24 24 25 26 26 26 27 2727 27 28 29 29 31 31 33 36 38 39 438 10 11 13 15 17 18 18 18 19 20 22 2323 24 25 25 26 26 48 49 50 50 50 50As the mean (average) mark of each class is almost identical the teacher has to findanother method to compare the marks.(a) Make a back to back stem-and-leaf diagramclass 1Xas shown and complete it.(b) If the teacher made the ‘pass’ mark ‘25 outof 50’, comment on the results with regardto numbers who ‘passed’ and how manygot high marks.012345class 1YMathematics: Mathematics 2 (Int 1) <strong>Statistics</strong> – Student Materials 20
Frequency TablesExercise 81. What numbers do these tally marks stand for?(a)IIII IIII IIII I IIII IIII IIII IIII IIII IIII IIII(b)2. A group of Primary Seven children were asked to vote for their class captain.The ballot papers unfolded as follows:DAVID FRED LOUISE FRED LOUISE FREDFRED DAVID DANIEL GINA GINA DANIELGINA DANIEL GINA GINA DANIEL FREDLOUISE FRED FRED DAVID FRED GINADANIEL GINA LOUISE LOUISE GINA GINAALICE FRED FRED FRED LOUISE DAVIDConstruct a frequency table like the one shownand answer the following questions:Name Tally Frequency(a) Who won the election?(b) One person voted for him/herself, andthat was the only vote he/she got.Who was it?(c) How many more votes did Gina get than Louise?3. The results for the Scottish Hockey League on the last Saturday in Sept. 2010 are:Airdrie Thistle 1 Airdrie Athletic 4 Ayr Rovers 8 Ayr Thistle 5Dundee Thistle 0 Dundee Rovers 0 Jedburgh 4 Peebles 4Edinburgh Thistle 1 Edinburgh Athletic 2 Kilmarnock Rovers 2 Kilmarnock <strong>Unit</strong>ed 0Stranraer Thistle 4 Stranraer Rovers 4 Aberdeen Rovers 1 Aberdeen Thistle 1Elgin Thistle 6 Elgin Rovers 1 Oban Rovers 7 Oban Thistle 7Stornoway Thistle 9 Stornaway <strong>Unit</strong>ed 3 Brechin Thistle 2 Brechin <strong>Unit</strong>ed 2Dunfermline Rovers 1 Dunfermline Athletic 1 Troon Thistle 5 Prestwick <strong>Unit</strong>ed 2Arbroath Rovers 2 Arbroath Thistle 1 Paisley Thistle 1 Johnstone Rovers 3Bishopton Rovers 0 Clydebank Thistle 1 Perth Flyers 10 Perth Rovers 0Construct a frequency table to illustrate the number of goals which will be scored!!!Mathematics: Mathematics 2 (Int 1) <strong>Statistics</strong> – Student Materials 21
MATHEMATICS 2 (INTERMEDIATE 1)Checkup Exercise 11. A number of children decided to spend their October week’s holiday swimming orplaying badminton. The table shows those who took part.Day Mon. Tues. Wed. Thurs. Fri.Swimming 60 25 75 60 10Badminton 20 45 15 55 7080706050403020Illustrate this information on a BAR GRAPH. (similar to this one)100Day2. The number of games consoles being bought by children in Scotland since 1980 isillustrated by a line graph.60Thousands50mi 40ll 30ion 20s1001980 1984 1988 1992 1996 2000Year(a) How many children bought a console in (i) 1980 (ii) 1996?(b) What is the increase from 1996 - 2000?(c) Between which two periods was there the greatest increase?(d) Describe the general trend of the graph.3. 5%A survey on ‘crisps’ was carried out among 600BeefBaconshoppers in a supermarket one Saturday morning.The pie chart shows the results.(a) What percentage chose:10% PrawnChicken (i) Chicken (ii) Cheese (iii) Bacon?(b) How many people chose:Cheese(i) Prawn (ii) Beef ( iii) Cheese?(c) Calculate the total number of shoppers wholiked prawn, bacon and beef crisps.Mathematics: Mathematics 2 (Int 1) <strong>Statistics</strong> – Student Materials 22
4. A plumber decided to monitor the number of call-outs the 10 plumbers in his companyhad to make in the early hours of one cold winter’s morning.His results are shown.Time (am) 1 1.30 2 2.30 3 3.30 4 4.30 5 5.30No. call-outs 2 1 3 3 4 5 6 6 8(a) Draw a SCATTER GRAPH.Put Time along the x -axis and Call-outs up the y -axis.(b) What is the general trend of the graph?5. The marks of 36 pupils in a maths test (out of 50) are noted below.23 12 47 35 27 42 6 44 50 48 44 3918 25 45 28 36 14 39 50 46 44 22 374 29 45 47 38 44 28 47 41 25 3 19Construct a simple stem-and-leaf diagram to display the marks.6. A survey was being carried out as people entered DucMonald’s Fast Food Store.As they arrived people were asked ‘what are you going to buy today’?The codes which the researchers used were:B = Beefburger C = Cheeseburger Ch = Chicken burgerCN = Chicken Nuggets V = Vegetarian FoodH = Hot DogU = UltrabargainHere are the results:B C B Ch B Ch Ch U Ch B CN C CNB H U H Ch C B Ch B Ch B C BCh B C Ch B H C B Ch B CN B CNB CN V B C CN CN H B H Ch V CCN CN Ch B Ch B CN B C Ch C B H(a) Construct a FREQUENCY TABLE to illustrate the results of the survey.(b) How many were going to buy a vegetarian meal?(c) What kind of food was the most popular?(d) How many more chicken burgers were sold than chicken nuggets?(e) How many people were asked?Mathematics: Mathematics 2 (Int 1) <strong>Statistics</strong> – Student Materials 23
Mathematics: Mathematics 2 (Int 1) <strong>Statistics</strong> – Student Materials 24
USE OF SIMPLE STATISTICSBy the end of this set of exercises, you should be able to(a)(b)(c)calculate the mean, median, mode and range of a set of data.calculate the mean, median, mode and range of data presented in anungrouped frequency table and interpret the results of calculated statistics.state the probability of a simple outcome.Mathematics: Mathematics 2 (Int 1) <strong>Statistics</strong> – Student Materials 25
Mathematics: Mathematics 2 (Int 1) <strong>Statistics</strong> – Student Materials 26
Range, Mean, Median and ModeExercise 11. For each set of data, find the range:(a) 8, 6, 2, 9, 7, 7, 4, 5, 12, 3, 9, 5, 6, 4.(b) 67, 83, 69, 65, 28, 36, 37, 95, 21, 25, 22, 47, 29, 54, 32, 65, 78, 94.(c) 2·1, 3·6, 5·8, 4·7, 2·5, 1·4, 8·9, 4·6, 2·5, 1·4, 2·3, 6·5, 6·8, 2·7, 2·9, 1·3, 4·4, 3·7.2. Calculate the mean in each case:(a) 8, 6, 6, 5, 7, 9, 9, 8, 6, 5, 4, 8, 7, 6, 3, 4, 5, 5, 4, 3.(b) 5·8, 7·2, 8·1, 4·9, 7·3, 7·7, 9, 6, 6·9, 8·1, 5·2, 7·8, 9·3, 6·7, 7, 7, 5·9, 9·1, 8·2, 4·8.(c) £12·20, £12·60, £13·50, £14·20, £16·80, £12·80, £11·40, £15·60, £17·20, £18.3. Find the median:(a) 6, 3, 5, 5, 2, 4, 7, 7, 8, 9, 1, 1, 4, 5, 8, 8, 7, 4, 5, 2, 9.(b) £16, £16, £17, £19, £20, £21, £16, £17, £18, £15.(c) 35 kg, 28 kg, 27 kg, 24 kg, 5 kg, 26 kg, 27 kg, 19 kg, 23 kg, 25 kg, 27 kg, 15 kg,15 kg, 35 kg.4. In the following, what is the mode?(a) 2, 2, 3, 3, 3, 3, 4, 4, 4, 4, 4, 5, 5, 6, 6, 6, 6, 7, 7, 7, 7, 8, 8, 9.(b) 5, 3, 9, 2, 3, 6, 8, 1, 2, 5, 5, 8.(c) 256, 250, 257, 251, 251, 251, 259, 250, 251 251, 252, 253, 253, 250, 254, 254,250, 255, 256, 251, 256, 258, 259.5. The children of Langbank took part in a fun-run around the village to raise moneyfor charity. These are the number of laps completed by the under 7s.15 24 13 26 22 17 8 2616 26 18 26 21 20 14 21For the number of laps completed, find:(a) the range (b) the mean (c) the median (d) the mode.6. Here are the heights, to the nearest cm, of nine girls:166 cm 176 cm 162 cm 180 cm 161 cm 176 cm 165 cm 175 cm 172 cmCalculate: (a) the range of heights(b) the mean height (to the nearest cm)(c) the median height.Mathematics: Mathematics 2 (Int 1) <strong>Statistics</strong> – Student Materials 27
7. Every morning of his Caribbean holiday, Gerald would climb a different palm tree.The top of each figure in the diagram shows the heights of the trees which he climbed.Height in metres1614121086420Find: (a) the range (b) the mean (c) the median (d) the mode.8. In the following examples, calculate the range, the mean, the median and the mode.In each case, state which ‘average’ best illustrates the catalogue of numbers.(a) 18 18 19 20 20 20 21 25 163.(b) 34 34 34 34 36 36 37 57 85.(c) 56 56 57 58 59 60 62 65 67.9. Brenda and her brother went to Disneyland for Easter. They kept a note as to how longthey had to queue to get on the rides. Here are their results (in minutes):16 30 25 20 10 110 10 22 40 17(a) Calculate the mean time waited.(b)(c)Find the median and modal times waited.Say which ‘average’ should be chosen to give a fair representation of the data.Give two reasons for your choice.10. Frank and his pals decided to have a day at an army assault course. They each recordedthe number of press-ups they could do in one minute before attempting the assaultcourse and again at the end of the course.The results were:Name Alf Bert Karl Dino Ed Flo Jim Ned Ian JanBefore 48 46 48 40 45 51 47 40 50 46After 36 38 42 35 36 46 32 28 41 38(a) Which person seemed to be affected most by the assault course? Reason??(b) Find the RANGE for (i) the ‘before’ data (ii) the ‘after’ data.(c) Calculate the MEAN for both sets of data.(d) Comment on the results.(e) Was Ian above or below average both times?Mathematics: Mathematics 2 (Int 1) <strong>Statistics</strong> – Student Materials 28
11. Mary and Beth played eight rounds of golf together during their summer holidays.Mary scored: 71 78 76 76 79 75 75 74Beth scored: 76 73 74 77 74 74 75 73(a) Calculate the range and mean for Mary.(b) Calculate the range and mean for Beth.(c) Who had: (i) the lowest score (ii) the highest score?(d) Who scored better most of the time ?12. Thirty pupils in Primary Four were given a 30 word spelling test.The teacher was to set a ‘pass’ mark. Here are the marks out of 30:18 21 23 19 24 25 17 20 18 1817 22 20 25 22 19 16 21 22 1618 23 24 19 15 18 24 23 30 29(a) Rewrite the marks in order, starting at the lowest.(b) What is the range of marks?(c) Calculate the mean, mode and median.(d) If you were the teacher, what would your pass mark have been? Give a reason!13. Mrs. Potts buys Bargain T Bags with an advertised ‘average 50 T Bags’ in every box.She buys 6 boxes and counts the tea bags in each box! Here is what she finds:49 49 52 50 52 52(a)(b)(c)(d)Calculate the mean number of tea bags.What is the mode?Should she take the boxes back to the shop and complain?What gives a clearer picture here...... the mean or the mode?14. East Athletic had a mean score of four goals per game in their first nine games!a) How many goals had they scored?b) In their next game they scored six, but failed to score in their next four matches.What was their mean score then?15. Five sisters have an average (mean) age of 19.Jean is 14, Joan is 18, Jan is 20 and Josephine is 17.What age is the eldest sister, Mags?16. Here are the number of runs scored by a cricketer,17 9but unfortunately one score is missing.42 1118 63If his mean score is 29 over the ten games, calculate26 18what the missing score must have been.80Mathematics: Mathematics 2 (Int 1) <strong>Statistics</strong> – Student Materials 29
Range, Mean, Median and Mode from a Frequency TableExercise 21. Jasmine is playing a game of Junior Darts on her children’s dart board.The highest she can score is seven. Here are some of her early scores:4 3 2 2 4 6 7 5 4 71 2 1 1 3 5 6 4 1 4(a)Draw up the frequency table and complete it.SCORE TALLY FREQUENCY SCORE × FREQUENCY123......(b) Calculate her mean score, using the frequency table above.(c) What is the range of the distribution?(d) What is i) the modal ii) the median score?2. These frequency tables show the points given to two teams in a TV challenge quiz.For each team, calculate:(a) the meanThe Groupies(b) the medianPoints 0 1 2 3 4 5 6(c) the modeFrequency 2 0 3 5 4 2 3(d) which team has the better‘average’ if:(i) the mean is usedThe Magpies(ii) the median is used(iii) the mode is used.Points 0 1 2 3 4 5 6Frequency 1 4 3 5 2 6 03. Abid made a survey of the ages of children who appeared on a bouncy castle in a parkone summer’s morning.AGE 2 3 4 5 6 7 8 9 10Frequency 1 10 11 10 7 5 4 3 2(a)(b)(c)(d)What was the range of the distribution?What was the modal age?Copy the diagram and add in another row to enable you to calculate the mean age.(correct to 1 decimal place)Find the median age.Mathematics: Mathematics 2 (Int 1) <strong>Statistics</strong> – Student Materials 30
4. The pupils in Castle <strong>High</strong> <strong>School</strong>’s top maths class looked out of their classroomwindow and noticed that the grass had not been cut for a long time.Their teacher, Mrs. McKenneth, estimated that the grass was about 15 cm high, but thepupils wanted to give their estimates.A table of results was drawn up.Height (cm) Frequency Height x Frequency13 214 415 216 217 1018 1COPY(a) Copy and complete the table and say how many pupils took part.(b) What was the range?(c) Calculate:(i) the mean(ii) the median(iii) the mode.(d) What do you think of Mrs. McKenneth’s estimate?5. Quix’s Chocolate Company claim that there are 20 mini-quix bars in an economypack. Some economy packs were purchased and the contents were as follows:-No. Bars Frequency Number x Frequency18 219 920 821 522 523 5TotalCOPY(a) Copy and complete the table.(b) What was the range in the number of bars?(c) Calculate: (i) the mean (ii) the median (iii) the mode.(d) Which average did the company use to back their claim?Mathematics: Mathematics 2 (Int 1) <strong>Statistics</strong> – Student Materials 31
ProbabilityExercise 31. Blind-folded, Jason pointed to an advert for fast-food.If he pointed to a picture, what is the probability that he pointed to:(a) a hot dog(b) a hamburger?2. On a normal six-sided die (numbered 1 to 6), what is the probability of rolling:(a) a four(b) an odd number(c) a number less than 3 (d) a prime number?3. The ‘ghostly’ dart board is shown below. You are allowed 1 throw only with a dart.What is the probability that if you hit a picture, it will contain:(a) a skeleton (b) a devil (c) a bat(d) a spider (e) a dinosaur?4. There are 49 numbers which can be drawn in the National Lottery.What is the probability that the first number out will be:(a) 44 (b) even(c) a square number (d) a multiple of 7?5. Arnold reckons that his chances of holing a putt is 70% (or 7 out of 10).What is the probability that he won’t hole it?Mathematics: Mathematics 2 (Int 1) <strong>Statistics</strong> – Student Materials 32
6. A pack of 52 playing cards are laid out, face down on a table.You have to pick a card. What is the probability that it will be:(a) a three (b) the three of spades(c) a face card (d) a black card(e) a heart?37. Henrietta watches five TV channelsBBC1 – BBC2 – STV – Channel 4 – Channel 5.What is the probability that that she will select at random:a) STV b) a channel with no breaks for adverts?8. Win a Goldfish or a Hamster!GLGLGAll you have to do is throw a ping-pong ballinto a narrow-neck bowl.G for Goldfish. H for Hamster.L for Lose.If your ball lands in a bowl, what is the probability of:(a) winning a goldfish (b) winning a hamster(c) winning (d) losing?LLGLGLLLGGLLLLH9. Malchester Rovers get most of their young players from four junior clubs.The diagram below indicates the number which they called up last season.TweedJuniors2050Tay Juniors20Malchester Rovers F.C.30Brook JuniorsForth Juniors(a) How many new young players were called up?If one of these young players was chosen at random,(b) what was the probability that the player came from Tweed Juniors?(c) what was the probability that the player came from Tay Juniors?(d) what was the probability that the player did not come from Forth Juniors?Mathematics: Mathematics 2 (Int 1) <strong>Statistics</strong> – Student Materials 33
10. A letter is chosen at random from the name THE ROLLING STONES.Calculate:(a) the probability it is an L(b) the probability it is a vowel.(c) the probability it is not a vowel.11. At the town fair, 700 red, 800 blue and 1000yellow balloons were let off.Each of them had a prize-winning ticket attached.If you were to catch a balloon, what is the probabilitythat it would be:(a) red(b) yellow(c) red or yellow (d) not blue (e) green?12. At Flo’s cafe, Flo carried out a survey on what people had to drink after churchon a Sunday.The results are shown below:TeaMilkCokeIIII IIII IIII IIII IIII IIIIII IIII IIII IIII IIIIIII IIII IIII IIII IIII IIII IIII IIIICoffeeFresh JuiceOthersIIII IIII IIII IIIIIIII IIIII IIIIWhat is the probability that if one person was chosen at random, he/she wouldbe drinking:(a) Tea (b) Coke (c) Others?Mathematics: Mathematics 2 (Int 1) <strong>Statistics</strong> – Student Materials 34
MATHEMATICS 2 (INTERMEDIATE 1)Checkup exercise 21. Find the range, the mean, the mode and the median in the following:(a) 1, 3, 5, 7, 9, 11, 14, 14(b) £11, £15, £3, £6, £2, £14, £7, £13, £11, £10, £7(c) 5cm, 2cm, 2cm, 1cm, 3cm, 3cm, 3cm, 4cm,4cm, 3cm, 3cm, 4cm, 2cm, 3cm, 2cm, 4cm.2. In a maths exam, everyone who sat it got between51% and 56%.Here is a frequency table displaying the results.(a) What is the range of marks?(b) What is the modal mark?(c) Find the median mark.(d) Calculate the mean mark, giving your answercorrect to 1 decimal place.Mark Frequency51 352 453 754 655 356 13. A paper boy was informed by his new employer that previous paper boys had been paid:£6·56 £9·81 £4·81 £5·96 £8·46 £5·56 per week.He was now being offered the median of these amounts, but being a true statistician,he said that he would prefer the mean!Was he correct? Explain fully!4. A Sunday school teacher was asked about the ages of those in her group.She replied:4, 5, 5, 6, 6, 7, 7, 7, 7 and 19!!(a) Calculate the mean age.(b) How many of the group were below the mean age?(c) Was the mean a good choice for ‘average’?(d) What ‘average’ (mean, mode or median) should have been used here?Mathematics: Mathematics 2 (Int 1) <strong>Statistics</strong> – Student Materials 35
5. The owner of a shoe shop is ordering from the manufacturer. In order to find out whichsize of shoe to order most of, he looks carefully for a while at the size of shoes whichladies buy in his shop.Here is one common sample of shoe size he found:3 3 3 3 4 4 5 5 6 6 6 6 6 6 7(a) Calculate the mean, mode and median.(b) For his own purpose, which one should the shop owner make the most use of?6. Richard gets the following marks (out of 10) for his spelling tests.9 5 5 4 8 9 7 3 4 4 6(a) Find: (i) the mean (correct to the nearest whole number).(ii) the mode.(iii) the median.(b) Richard’s ‘average’ mark will be used by the teacher in his report.Which ‘average’ - mean, mode or median, would Richard prefer?7. A five-sided spinner has a number (1 - 5) on each of its sides.When it is spun,(a) what is the probability that it stops at:(i) a 2 (ii) an even number (iii) an odd number?(b) what is the probability that:(i) it won’t stop (ii) it will stop at one of the numbers 1 - 5?345218. Mrs. Young put her two sons’ toys into one box in the dark attic.Albert’s toys were - 3 planes, 4 cars, 2 jigsawsand 1 construction set.Andrew’s toys were - 5 books, 4 carsand 1 football.Albert sneaks into the attic looking for a football.In the darkness, he plunges his hand into the box!What is the probability that he will first touch:(a) a book (b) a plane(c) a car (d) the football(e) one of his own toys (f) one of Andrew’s toys?TOYSMathematics: Mathematics 2 (Int 1) <strong>Statistics</strong> – Student Materials 36
MATHEMATICS 2 (INTERMEDIATE 1)Specimen assessment questions for Graphs, Charts and Tables1. The graph shows class absences whichwere recorded during a chicken-poxepidemic over 6 weeks in 1996.(a) Which class was more affectedfirst by the epidemic?(b) On how many weeks werethere more than 10 pupilsabsent in class 1K?(c) What was the largest numberof pupils absent on any dayin either class?(d) How many pupils, in total, wereabsent over the period?No. of pupils absent1614121086420Class 1KClass 1PWk.1 Wk.2 Wk.3 Wk.4 Wk.5 Wk.62. On Sat. 11th. Oct. 1997 Scotland defeated 10%Latvia 2-0 to qualify for the World CupFrance10%finals in France in 1998.EnglandTo assess Scotland’s chances, a50%survey was carried out, askingpeople in the street whichteam would win the World Cup.The replies from 500 people are shown inthe pie-chart.25%GermanyBrazil(a) How many said(i) Brazil (ii) Germany (iii) France?(b) The remaining section of the chart shows the people who said ‘Scotland’.How many was that?3. The marks of eight pupils from tests in History and Geography are shown below.Pupil’s Name Alice Dawn Gerry Colin Freda Sally Harry WillHistory 5 6 10 11 13 15 18 22Geography 8 10 13 14 16 17 20 25(a) Draw a SCATTER DIAGRAM using the History marks for the horizontal axisand the Geography marks for the vertical axis.(b) Describe the general trend of the graph.(c) Draw in a line of best fit.(d) Use the line to estimate the Geography mark if the History mark was 20.4. The following marks are those scored by pupils in a Primary 4 science test.(a) Draw a FREQUENCY TABLE to show this.9 3 3 4 6 7 5 4 2 5 5 7 1 7 6(b) How many sat the test and what was the 3 6 5 7 4 8 7 5 4 5 8 6 2 6 4top mark ?7 5 3 6 4 8 6 4 4 5 6 5 7 10 7(c) How many scored more than 7?6 9 7 8 6Mathematics: Mathematics 2 (Int 1) <strong>Statistics</strong> – Student Materials 37
MATHEMATICS 2 (INTERMEDIATE 1)Specimen assessment questions for Use of Simple <strong>Statistics</strong>1. The heights (to the nearest cm) of some girls are given below.What is:163 157 161 169 166 157 167 163 157 161(a)(b)(c)(d)the rangethe median heightthe modal heightthe mean height?2. A golfer (who, of course, likes to shoot low scores), plays a round of golf every day onhis week’s holiday.He scores: 69 70 90 73 71 70 82(a) Which of his three ‘average’ scores - the mean, the median or the mode, would heprefer?(b) If he accepts this ‘average’, comment on his round of 69.3. The following table shows the number of children per family in the families of thepupils in a second year class.Number of Children 1 2 3 4 5 6 7 8Frequency 4 3 10 6 4 2 1 0(a) Draw a frequency table to show this, but with an extra column for‘Number of Children × Frequency’.(b) Calculate (to 1 decimal place), the mean number of children per family.(c) Find: (i) the median (ii) the mode of the distribution.4. A bag contains 40 sweets. 30 are ‘Cola Bottles’ and 10 are ‘Mint Chews’.If a sweet is picked at random, what is the probability that it will be:(a)(b)(c)(d)a ‘Cola Bottle’a ‘Mint Chew’a ‘Pineapple Chunk’a ‘Cola Bottle’ or a ‘Mint Chew’?Mathematics: Mathematics 2 (Int 1) <strong>Statistics</strong> – Student Materials 38
Answers to Graphs, Charts and TablesExercise 11. (a) 3 (b) 16 (c) 28 (d) 11 (only child) - no brother/sister2. (a) Ch 1 (b) Ch 5 (c) Ch 2 Ch 4 (d) 97·5 million (e) Ch 33. (a) i) Majorca ii) Ibiza (b) Scale too large to read(c) Sp 2·4 million Ibiza 1·3 m Greece 1·8m Maj 4·7m Gran C 3·2m4. (a) S1 (b) S4/5/6 (c) 30 (d) S1 & S2(e) S3 (f) 80 (g) All S6 prefer money5. (a) £12 million (b) £54 million (c) £6 million (d) £30 millionExercise 21. (a) i) 8°C ii) –4°C (b) 9°C (c) Tues- Wed Wk 1 (d) Falling Temp.2. (a) 9 a.m. (b) 25°C (c) 4 p.m. (d) Heating off / open window?(e) 11 a.m. - 2 p.m. (f) 5 hours (g) 4 p.m.3. (a) Cold weather (b) Jan-Feb, March-Apr, July-Aug (c) April(d) Aug-Sept by 7000(e) July-Aug - summer holidays (f) Go on winter holiday to sunExercise 31. (a) i) Trigonometry ii) Calculus (b) 25% (c) 1 /72. (a) i) 20 ii) 40 (b) 60 apples (c) 340 apples3. (a) i) 1 /2 ii) 1 /8 (b) 84. (a) £3 200 000 (b) 21% (c) £448 000 (d) 18°5. (a) All Bran = 180° Corn Fl. = 120° Frost. = 15° Weet. = 45°(b) i) 120 ii) 80 iii) 30 iv) 10Exercise 41. (a) Rising (b) Falling (c) Slow rise.2. (a) 10 a.m. (b) Cheaper rate(c) Before 10 - high, then fall to noon, slight rise at lunch, then fall away till 6p.m.- quite a rise till 8 p.m. then as day ends, trend falls.3. (a) 1000 (b) 1215 (c) 30 miles (d) Flat tyre?? (e) 30 mins. approx.4. Decrease in use of train - bus about same - increase in car & planeMore people have cars and more confidence in air travel.5. Graph 4. Fills steadily, but quickly - then fills steadily, but slower.Exercise 51. (a) 90 cm (b) 60 kg (c) Ann & Jan (d) Ann (e) Fred2. (a) As temp rises - sales rise (b) 20 (c) Around 18 - 20°C3. (a) More miles travelled - dearer the fare (b) no travel - no cost (c) Around 4 miles(d) about £2·40 – £2·50Maths: Mathematics 2 (Int 1) <strong>Statistics</strong> 39
4. (a) 1 & 1 1 /2 (b) the older the yacht - the smaller its value(c) 3-4 years (d) about £600005. (a) A - the more you apply, the better the growth B - apply more, but growth staticC - apply more, but height varies(b) Use A, - for better, more reliable, controlled growth.Exercise 61. 14 17 21 21 23 27 29 31 32 34 36 36 3738 40 41 41 42 48 49 51 53 54 54 61 62 16 weeks2. £187 £219 £225 £324 £337 £369 £413£522 £533 £555 £630 £658 £745 £7733. (a) i) 11 a.m. ii) 4 p.m. (b) 9Ex 71.1201101009080706050403020100GirlsBoysSwim Fence Foot Aero K.FitSport2. Shaped like this:- but with Labels!! 3.4.80706050403020100403020100Height90807060504030201001 2 etc Week No.Week No.In Jan. due to bad weather, more go for hotschool lunch.As year goes on, number of school lunchesfall while own food increases.By June, many more bring own - not many inschool.Maths: Mathematics 2 (Int 1) <strong>Statistics</strong> 40
5. 45x(c) French marks are higher (not40xxby much)35Pen & Rab got same in both30x xIf a student is good at25German, he or she will be20 xgood at French.15x(d) By eye10 x x(e) Estimate 355 x(f) Flo’s German marks are higherFrench6. Draw Scatter Graph with correct axes and labels (c) Estimate 17/18 mins.7. Draw Scatter Graph with correct axes and labels (c) i) 14cm 3 ii) 45cm 38. Draw Scatter Graph with correct axes and labels (c) 16°C (d) 17mm9. Draw Scatter Graph with correct axes and labels (c) i) about 150 ii) about 550(d) 42kg.10.11.05 101520253035404515 25 35 45GermanxxxxxxxBuying ofWellington Bootsxxx xxxx x xxxBuying ofNewspapers6786 0 3 6 2 7 9 2 6 8 4 5 9 48 9 8 8 8 7 5 5 4 6 1 2 7 5 30 4 4 0 19 307 | 9 = 79x x x x x x x x x xBuying of ofSwim Swim WearWear12.Machine 1 Machine 2199 8 92 5 0 6 7 200 5 2 4 0 5 7 1 5 9 34 1 8 5 9 9 6 3 7 7 3 0 9 9 5 3 6 2 3 8 4 2 201 3 6 8 9 9 7 6 2 8 7 1 0 6 3 4 40 1 1 0 3 0 0 6 5 0 1 8 202 0 0 1 9 0 0 3 1 0 28 203 3 0201 | 6 represents 2016Machine 1 more bunched, gives more 201’s. Machine 2 gives more of the lesser 200’sbut gives more 203’s (not many!).Maths: Mathematics 2 (Int 1) <strong>Statistics</strong> 41
13. (a) (b) More passed in 1X,Class 1X Class 1Y7 5 0 8but 1Y had the highest9 7 4 1 0 1 3 5 7 8 8 8 9 marks.9 9 8 7 7 7 7 6 6 6 5 4 4 2 0 2 3 3 4 5 5 6 69 8 6 3 1 1 33 4 8 95 0 0 0 02 | 3 represents 23Exercise 81. (a) 16 (b) 342. Table with frequencies 4, 11, 9, 6, 5, 1 = 36(a) Fred (b) Alice (c) 3.3. Table with:Goals 0 1 2 3 4 5 6 7 8 9 10Teams 5 10 6 2 5 2 1 2 1 1 1Checkup Exercise 11. 2. (a) i) 0 – 1000 ii) 41 – 42 thousand80(b) 18000 approx.70(c) 1992 - 199660(d) Rising slowly, then fast!5040303. (a) i) 50% ii) 25% iii) 10%20(b) i) 60 ii) 30 iii) 15010(c) 1500M T W Th F4. 85.7654302345463182493598785256899775572447618440023 | 8 represents 3816. (a) Table with: B = 21, C = 10,1am 2am 3am 4am 5amCh = 14, CN = 10,V = 2, H = 6, U = 2.(b) Rising - later it gets - more call-outs (b) 2(c) Beefburger(d) 4 (e) 65Call-outsMaths: Mathematics 2 (Int 1) <strong>Statistics</strong> 42
Answers to Use of Simple <strong>Statistics</strong>Exercise 11. (a) 10 (b) 74 (c) 7·62. (a) 5·9 (b) 7·1 (c) £14·433. (a) 5 (b) £17 (c) 25·5kg4. (a) 4 (b) 5 (c) 2515. (a) 18 (b) 19·6 (c) 20·5 (d) 266. (a) 19 cm (b) 170 cm (c) 172 cm7. (a) 12 m (b) 10·2 m (c) 10 m (d) 10 m8. Range Mean Mode Median Best(a) 145 36 20 20 Med/Mode(b) 51 43 34 36 Mode(c) 11 60 56 59 Mean / Median9. (a) 30 mins (b) Med = 21 mins Mode = 10 mins(c) Med. Mean is put out by 110 mins. Mode...only 2 at 10 mins..not enough to justify10. (a) Jim - 15 less (b) i) 11 ii) 18 (c) Before = 46·1 After = 37·2(d) At end...wider range and mean lower (e) Above both times.11. (a) R 8 M 75·5 (b) R 4 M 74·5 (c) i) Mary ii) Mary (d) Beth12. (a) List Marks in order (b) 15 (c) Mean = 20·9 Mode = 18 Median = 20·5(d) 20 or 21 Mean & median close to each other and small range13. (a) 50·7 (b) 52 (c) No! (d) Mode14. (a) 36 (b) 3 15. 24 16. 6Exercise 21. (a) Complete table (b) 3·6 (c) 6 (d) i) 4 ii) 42. (a) B = 3·4 D = 3 (b) B = 3 D = 3 (c) B = 3 D = 5(d) i) The Groupies ii) neither iii) The Magpies.3. (a) 8 years (b) 4 (c) 5·3 (d) 54. (a) 21 (b) 5 cm (c) i) 15·8 cm ii) 17 cm iii) 17 cm(d) Not great! too low.5. (a) Check table (b) 5 (c) i) 20·5 ii) 20 iii) 19(d) MedianMaths: Mathematics 2 (Int 1) <strong>Statistics</strong> 43
Exercise 31. (a) 3 /18 = 1 /6 (b) 5 /62. (a) 1 /6 (b) 1 /2 (c) 1 /3 (d) 1 /23. (a) 8 /24 = 1 /3 (b) 4 /24 = 1 /6 (c) 2 /24 = 1 /12 (d) 6 /24 = 1 /4 (e) 4 /24 = 1 /64. (a) 1 /49 (b) 24 /49 (c) 1 /7 (d) 1 /75. 30% (or 3 out of 10)6. (a) 1 /13 (b) 1 /52 (c) 3 /13 (d) 1 /2 (e) 1 /47. (a) 1 /5 (b) 2 /58. (a) 7 /20 (b) 1 /20 (c) 8 /20 = 2 /5 (d) 3 /59. (a) 120 (b) 1 /6 (c) 5 /12 (d) 3 /410. (a) 1 /8 (b) 5 /16 (c) 11 /1611. (a) 7 /25 (b) 2 /5 (c) 17 /25 (d) 17 /25 (e) 012. (a) 27 /124 (b) 39 /124 (c) 9 /124Checkup Exercise 21. Range Mean Mode Median(a) 13 8 14 8(b) £13 £9·90 none £10(c) 4cm 3cm 3cm 3cm2. (a) 5 (b) 53 (c) 53 (d) 53·23. Median = £6·26, Mean = £6·86 Yes. He was correct!4. (a) 7·3 (b) 9 out of 10!(c) No, the teacher included herself,knocking the mean out(d) Median. Mean, without age 19, is 6.5. (a) Mean 4·9 Mode 6 Median 5(b) Mode will tell him which size he sells most.6. (a) i) 6 ii) 4 iii) 5 (b) Mean gives better mark.7. (a) i) 1 /5 ii) 2 /5 iii) 3 /5 (b) i) 0 ii) 18. (a) 1 /4 (b) 3 /20 (c) 2 /5 (d) 1 /20 (e) 1 /2 (f) 1 /2Maths: Mathematics 2 (Int 1) <strong>Statistics</strong> 44
Specimen Assessment Questions for Graphs, Charts and Tables1. (a) 1K (b) 3 (c) 15 (d) 1102. (a) i) 250 ii) 125 iii) 50(b) 253.Geography252015105xxxxxxxx(b) If student is good at Historythen he/she is good at Geography(c) See graph(d) Round about 20 also!05 10 15 20 25History4. (a) Simple Freq. table (b) 50 sat 10 top mark (c) 7Specimen Assessment Questions for Use of Simple <strong>Statistics</strong>1. (a) 12 cm (b) 162 cm (c) 157 cm (d) 162·1 cm2. (a) Mode (b) Good! 1 better than ‘average’. (mean = 75, median = 71)3. (a) Freq. Table (b) 3·4 (c) i) 3 ii) 34. (a) 3 / 4 (b) 1 / 4 (c) 0 (d) 1Maths: Mathematics 2 (Int 1) <strong>Statistics</strong> 45