Lab 4 – DC Servomotor Modeling
Lab 4 – DC Servomotor Modeling
Lab 4 – DC Servomotor Modeling

You also want an ePaper? Increase the reach of your titles
YUMPU automatically turns print PDFs into web optimized ePapers that Google loves.
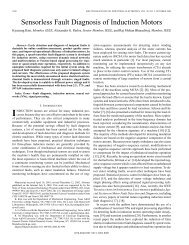
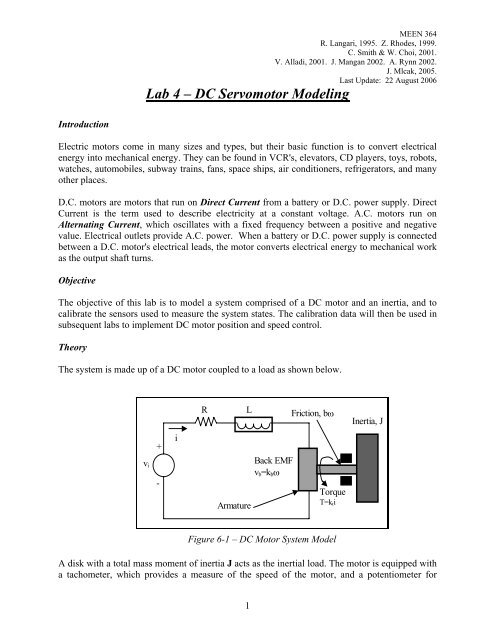
<strong>Lab</strong> 4 <strong>–</strong> <strong>DC</strong> <strong>Servomotor</strong> <strong>Modeling</strong>MEEN 364R. Langari, 1995. Z. Rhodes, 1999.C. Smith & W. Choi, 2001.V. Alladi, 2001. J. Mangan 2002. A. Rynn 2002.J. Mlcak, 2005.Last Update: 22 August 2006IntroductionElectric motors come in many sizes and types, but their basic function is to convert electricalenergy into mechanical energy. They can be found in VCR's, elevators, CD players, toys, robots,watches, automobiles, subway trains, fans, space ships, air conditioners, refrigerators, and manyother places.D.C. motors are motors that run on Direct Current from a battery or D.C. power supply. DirectCurrent is the term used to describe electricity at a constant voltage. A.C. motors run onAlternating Current, which oscillates with a fixed frequency between a positive and negativevalue. Electrical outlets provide A.C. power. When a battery or D.C. power supply is connectedbetween a D.C. motor's electrical leads, the motor converts electrical energy to mechanical workas the output shaft turns.ObjectiveThe objective of this lab is to model a system comprised of a <strong>DC</strong> motor and an inertia, and tocalibrate the sensors used to measure the system states. The calibration data will then be used insubsequent labs to implement <strong>DC</strong> motor position and speed control.TheoryThe system is made up of a <strong>DC</strong> motor coupled to a load as shown below.RLFriction, bωInertia, Jv i+-iArmatureBack EMFv b =k b ωTorqueT=k t iFigure 6-1 <strong>–</strong> <strong>DC</strong> Motor System ModelA disk with a total mass moment of inertia J acts as the inertial load. The motor is equipped witha tachometer, which provides a measure of the speed of the motor, and a potentiometer for1
MEEN 364R. Langari, 1995. Z. Rhodes, 1999.C. Smith & W. Choi, 2001.V. Alladi, 2001. J. Mangan 2002. A. Rynn 2002.J. Mlcak, 2005.Last Update: 22 August 2006measuring the angular position. The motor is powered by means of a power amplifier, whichamplifies the current coming into the motor, but not the voltage.The developed torque of the <strong>DC</strong> motor is proportional to the magnitude of the flux due to thefield current ifand the armature current i a. The developed torque can be expressed asT ( t)= Kϕwhere ϕ represents the magnetic flux (1)i aFor the armature control mode, the field current is held constant and an adjustable voltage isapplied to the armature. The flux produced by the field current is therefore constant. Hence thetorque is only proportional to the armature current and is given byT ( t)= K ti a(2)When the armature is rotating, a voltage ebis produced that is proportional to the product of theflux and the speed, ω. Because the polarity of this voltage opposes the applied voltage e a, it isalso called back emf. Since the flux is constant, the induced voltage is given byeb= K bω(3)Looking at the circuit diagram of the motor, we get the voltage equation of the armature circuitasdi+ vi(4)dtaL iaR+ eb=The current in the armature produces the required torque as per (1). The required torque dependson the load connected to the motor shaft. If the load is modeled as a moment of inertia and adamper as shown in the figure, then the torque equation can be written asdωJ + Bω= T (t)dt(5)Substituting (2) into (5) and solving results in1 dω ia= ( J + Bω )(6)K dttDifferentiating (6) once and using the result along with (6) in (4) produces2
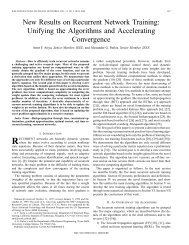
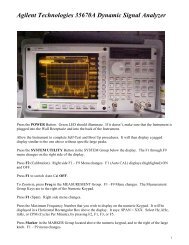
LJKtMEEN 364R. Langari, 1995. Z. Rhodes, 1999.C. Smith & W. Choi, 2001.V. Alladi, 2001. J. Mangan 2002. A. Rynn 2002.J. Mlcak, 2005.Last Update: 22 August 20062d ω ⎛ LB + RJ ⎞ dω⎛ RB ⎞+ Kb= vidt⎜K⎟ +tdt⎜ +K⎟ω(7)2⎝ ⎠ ⎝ t ⎠Equation (7) represents the response of the system to an input voltage vi.If the inductance in the system can be ignored, then (7) can be simplified as belowJ⎛ KbK⎜ B +⎝ Rt⎞⎟⎠dω+ ω =dtKt⎛ KbKR⎜B +⎝ Rt⎞⎟⎠vi(8)The above equation is of the form,dωτ + ω = K sv i(9)dtEquation (9) is a first order equation that shows how ω varies with input voltage. Ksis thenumerator of the first order approximation of the system dynamics. If the angular velocity is atsteady state, then Ksis the relation between the <strong>DC</strong> motor input voltage and the steady statevelocity. This is called the steady state gain. It may be determined from first principles, as seenby comparing in equations (8) and (9) or it may be determined experimentally. When it isdetermined experimentally, the correct notation is Kˆ s , which shows that this is a measurementof Ks.The response of this system to a unit step voltage is shown in figure (2).3
MEEN 364R. Langari, 1995. Z. Rhodes, 1999.C. Smith & W. Choi, 2001.V. Alladi, 2001. J. Mangan 2002. A. Rynn 2002.J. Mlcak, 2005.Last Update: 22 August 2006ω ss10.90.80.70.6ω0.50.40.30.20.1063% ω ssFigure 2 <strong>–</strong> Motor Step Input Response0 τ 0.2 0.4 0.6 0.8 1tA notable feature of this response pattern is that ω reaches a steady state value, which is denotedby ω . In effect,ssω = K v(10)sssidωsince → 0 .This notion of steady state behavior is important in that if one were to ignore thedttransient response of the system, the motor can be viewed as a purely static system whosebehavior is described by (10). The motor response in Figure 2 involves a transient effect bestdescribed in terms of the time constant τ . It is defined as the time it takes for the response toreach 63% of its steady state, or final value.InstrumentationA tachometer outputs a voltage that is proportional to the angular speed ω of the motor. Thisvoltage varies from <strong>–</strong>10 to 10 volts. At higher speeds the voltage may be more than 10 Volts.The analog output from the tachometer can be read using the Data Acquisition board. Thevoltage read must be converted to speed after A/D conversion.ω = K vV o(11)where0V is the voltage output by the tachometer. You will determine this value in thecalibration part of the experiment.4
MEEN 364R. Langari, 1995. Z. Rhodes, 1999.C. Smith & W. Choi, 2001.V. Alladi, 2001. J. Mangan 2002. A. Rynn 2002.J. Mlcak, 2005.Last Update: 22 August 2006A potentiometer outputs a voltage proportional to the angular position of the motor. It ismounted directly on the shaft of the motor. The voltage V 02is related to θ according to therelationshipθ = K xV o2(12)A power amplifier amplifies the current needed to drive the motor since the output current ofthe D/A is very small. The voltage vito the motor should be kept between ± 10 Volts.<strong>Lab</strong> ProcedureThe lab deals with calibrating the speed and position sensors and finding out the parameters ofthe motor <strong>–</strong> namely the steady state gain, K , and the time constant, τ , of the motor.s1. Create a Simulink model capable of sending a constant voltage to the <strong>DC</strong> motor andreading a voltage from the onboard tachometer.a) Use the Simulation Interface Toolkit and <strong>Lab</strong>VIEW (see SIT Tutorial) to interfacewith the hardware. Allow the input voltage to be varied using a <strong>Lab</strong>VIEWcontrol.b) Use Analog Output channel 0 on the DAQ card to output a voltage to the motor.c) Use Analog Input channel 0 on the DAQ card to input the tachometer voltage.d) Log the tachometer voltage, V o , to a separate file, and display it on the screen asthe model is running.Note: Vo is a floating source with a ± 1 V dead zone.e) Use a simulation step size of 0.01 seconds (a 100 Hz sampling rate).Note: The step size can be increased (equivalent to reducing sampling rate) so thetime interval displayed on the graphs/charts to be created in <strong>Lab</strong> 8 is larger(<strong>Lab</strong>VIEW stores 1000 data points in memory regardless of the time step).2. Steady State Gain Determination and Tachometer Calibrationa) Determine the voltage range of operation for the <strong>DC</strong> motor. (The range should be~1 <strong>–</strong> 9 V.)b) Send 5 voltages across range of operation to <strong>DC</strong> motor using analog outputchannel 1 on the DAQ board.Note: Set Vout to zero after each run (before stopping the VI)c) Measure the steady-state angular velocity, ω , using a handheld stroboscopictachometer.d) Save the output voltage, V o , from the onboard tachometer to a separate file for theestimation of the motor time constant.e) The table below can be used to record your results.f) Find Kˆ s , an estimate of the <strong>DC</strong> motor steady state gain.5
ωssi. Take the mean of the five values of .viii. Find the standard deviation of the estimate,MEEN 364R. Langari, 1995. Z. Rhodes, 1999.C. Smith & W. Choi, 2001.V. Alladi, 2001. J. Mangan 2002. A. Rynn 2002.J. Mlcak, 2005.Last Update: 22 August 2006Δ Kˆs.g) Determine K v <strong>–</strong> take the mean of the five values of3. Estimation of the motor time constant.ωss .VoThe motor time constant, τ , is shown in the sample motor response in figure 2. Themotor time constant is the time it takes for the motor to reach 63% of its steady statevalue, when subject to a step input.Write a MATLAB m-file or use Excel to estimate the motor time constant.Run12345vi[V]Vo[V]ωss[rpm]ωssKv=Vo[rpm/V]ssKˆωs=vi[rpm/V]τ[sec]4. Potentiometer calibration.a) Modify the Simulink model used in the tachometer calibration to read the rotarypotentiometer from Analog Input channel 1. Save the Simulink model under adifferent file name and perform the procedure listed in the SIT Tutorial on theSimulink model.b) Use the same step size you set in part 1.e) above.c) Do not send a voltage to the <strong>DC</strong> motor.d) Use a numeric indicator in <strong>Lab</strong>VIEW to view the value of the potentiometervoltage. The data does not need to be logged to a text file. Rather, you willrecord the voltage reading displayed for each angular position of the motor.e) Manually rotate the load until the potentiometer voltage is 0 V, this correspondsto the 0º position.f) Rotate the shaft in 45º increments in both the positive and negative direction, andrecord the potentiometer voltage. Be cautious around θ = 180º because thepotentiometer voltage switches from positive to negative at this point and there isa small dead region.g) Plot the angular shaft position vs. potentiometer voltage.6
h) Determine K x , using equation 12.MEEN 364R. Langari, 1995. Z. Rhodes, 1999.C. Smith & W. Choi, 2001.V. Alladi, 2001. J. Mangan 2002. A. Rynn 2002.J. Mlcak, 2005.Last Update: 22 August 2006*NOTE: Save all data and results obtained in this lab for use with <strong>Lab</strong> 8: Implementationof <strong>DC</strong> Motor Speed Control.Issues to be addressed in the report:• System Description• Include all the data and the calibration constants obtained from the lab• Include plots of the speed vs. time data and report the time constants you obtain from thegraphs.• Comment on whether or not the system behaves linearly, as the model predicts.Things you have learned from this lab<strong>Modeling</strong> electro-mechanical systems.Calibration of sensors.Evaluating time constant of first order systems.7