Simulation Interface Toolkit (SIT) Tutorial
Simulation Interface Toolkit (SIT) Tutorial
Simulation Interface Toolkit (SIT) Tutorial

Create successful ePaper yourself
Turn your PDF publications into a flip-book with our unique Google optimized e-Paper software.
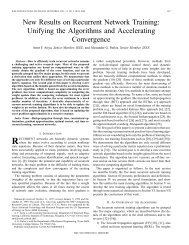
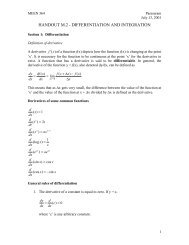
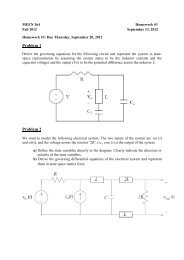
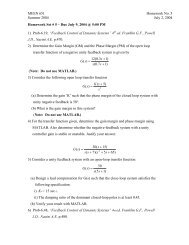
MEEN 364J. MlcakLast Update: 8/27/2006<strong>Simulation</strong> <strong>Interface</strong> <strong>Toolkit</strong> (<strong>SIT</strong>) <strong>Tutorial</strong>Simulink is an add-on toolkit for MATLAB, and it provides a graphicalenvironment for the design and interactive execution of dynamic system models. Theuser can create models in Simulink using customizable blocks. Using graphical wires toconnect the blocks, the user can specify data flow. In some computer systems, Simulinkcan connect directly to the data acquisition board, but in this lab, the National InstrumentsPXI system is the hardware that performs data acquisition. The PXI system is a NationalInstruments product, and LabVIEW must be used to perform data acquisition with thissystem. Therefore, a method is needed to allow a Simulink model to perform dataacquisition. You should bring this tutorial to lab whenever Simulink will be used toperform data acquisition operations.1. About <strong>SIT</strong>The <strong>Simulation</strong> <strong>Interface</strong> <strong>Toolkit</strong> (<strong>SIT</strong>) provides a way to create a LabVIEW userinterface that you can use to interact with a Simulink model. With a LabVIEW userinterface, you can manipulate the model parameters and view the output data of theSimulink model immediately. With a different type of system, Simulink can functionindependent of <strong>SIT</strong> or LabVIEW, but the current lab configuration with low-profilecomputers requires the use of <strong>SIT</strong> and LabVIEW.For LabVIEW to communicate successfully with MATLAB and Simulink, youmust have MATLAB running at all times. When you launch MATLAB, you also startthe <strong>Simulation</strong> <strong>Interface</strong> <strong>Toolkit</strong> (<strong>SIT</strong>) Server, which enables LabVIEW and MATLAB tocommunicate with each other. Figure 1 displays the interaction between LabVIEW andSimulink.Host VILabVIEWFront PanelBlock DiagramMATLAB and Simulink<strong>SIT</strong> ServermodelTCP/IPHost ComputerHost ComputerFigure 1. Running a Simulink Model using LabVIEWThe LabVIEW/<strong>SIT</strong> interface behaves differently when data acquisition isinvolved in the Simulink model. Simulink can function independently as a modeling andcalculation tool, so <strong>SIT</strong> is not needed when data acquisition is not involved.1
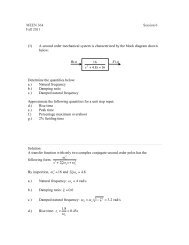
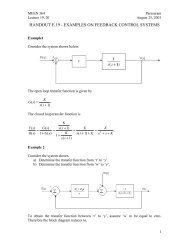
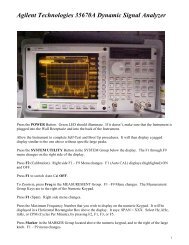
MEEN 364J. MlcakLast Update: 8/27/2006(a)(b)(c)Figure 4. a, b, and c. <strong>Simulation</strong> parameters.In the Simulink diagram, select the drop down menu in the upper toolbar andchoose “External” as shown in Figure 5.Figure 5. Diagram window setting of external mode4
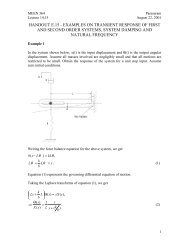
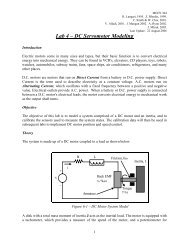
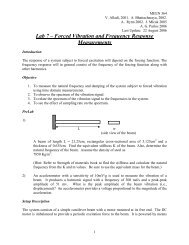
MEEN 364J. MlcakLast Update: 8/27/2006the Waveform chart to the NI_SINK. Note that the icons beside the controls andindicators differ. Icons of different types cannot be linked. Once all connections havebeen made, select OK to create all connections and return to the Front panel. PressingOK causes LabVIEW to build a block diagram that makes all necessary connectionsbetween the Front panel elements and the Simulink model DLL.Figure 6. LabVIEW Front panelFigure 7. <strong>SIT</strong> Connection Manager6
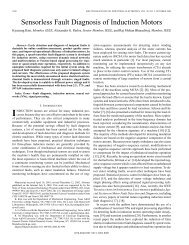
MEEN 364J. MlcakLast Update: 8/27/2006For this example, it is desired to log (save) the data in an array, or spreadsheetform. This array can be opened in any spreadsheet program or MATLAB as long as it issaved as a comma-delimited or tab-delimited file. Double click the Waveform Chartindicator on the Front panel. This takes you to the Waveform Chart’s location in theBlock diagram. Right click on the Block diagram and select Functions >> File I/O >>Write LVM and drag the Write LVM block to a location under the Waveform Chartterminal in the Block diagram. A dialog box as shown in Figure 8 will appear. Select alocation and file name where the data will be logged and save it as a “.txt” file. Selectall options so that they match those shown in Figure 8. Click OK to close the ConfigureWrite LVM File dialog box. A Write LVM block must be added for each data set youwish to log.*NOTE: The filename in the Write LVM block must be changed each time you wantto save another data set.Figure 8. Configure Write LabVIEW Measurement (LVM) File dialog boxAs shown in Figure 9, use the wiring tool to connect the Signals port of the WriteLVM block to the wire that enters the indicator’s terminal block. Repeat the processabove for all data values that must be logged. Save the LabVIEW VI in the projectfolder. Use a unique file name such as RUN_ME.vi to separate this VI from the manyothers that were generated in the build process.7
MEEN 364J. MlcakLast Update: 8/27/2006The Front panel of the main VI is shown in Figure 12. Select the “Run <strong>SIT</strong>”button on the Front panel to run the <strong>SIT</strong>/Simulink diagram in LabVIEW, and select the“Stop <strong>SIT</strong>” button on the Front panel to stop the <strong>SIT</strong>/Simulink diagram in LabVIEW.*NOTE: Do not use the stop button labeled “Stop VI” or the stop button on the toptoolbar. These stop buttons do not properly close the <strong>SIT</strong>/Simulink connection withLabVIEW.Run <strong>SIT</strong>Stop <strong>SIT</strong>Figure 12. LabVIEW Front panel after <strong>SIT</strong> connections are establishedTo convert the logged data to a variable in the MATLAB workspace, make surethe “.txt” file is in the MATLAB working directory. At the MATLAB command promptor a M-file type:load Trial_1.txtwhere Trial_1.txt is the filename given in the Write LVM block. This will create an arraylabeled Trial_1 in the MATLAB workspace. The first column of the array is time, andthe second column is the data set that was logged while running <strong>SIT</strong>.The data can be opened in Excel by first opening Excel, then going toFile>>Open. Under the “Files of Type” drop-down menu, select Text Files. Then selectthe “.txt” file containing the data you want. Click the next button twice, and then clickthe finish button. The data can then be manipulated using Excel. Like MATLAB, thefirst column is time, and the second column is the data set that was logged while running<strong>SIT</strong>.10
3. SummaryMEEN 364J. MlcakLast Update: 8/27/20061. Create a folder for your lab projects.2. Open MATLAB and change the working directory to your lab project folder.3. Create Simulink Diagram:a. Label all blocks with a unique and descriptive name.b. Include an In block for each analog input data acquisition terminal.c. Include an Out block for each analog output operation.d. Insert an NI Sink where data values will be viewed in LabVIEW.e. Give constants and gains nominal values if appropriate.f. Include at least one “In” and “Out” block even if the blocks are not used.If the In or Out block is not used, do not connect it to anything.4. Set the sampling frequency, fixed calculation step size, and real-time workshop:a. Go to <strong>Simulation</strong>>><strong>Simulation</strong> Parameters>>Solver tab:i. Set a Stop time (can leave at default of 10 seconds).ii. Under Solver Options, select the type as Fixed-step with the ode5(Dormand-Prince) solver.iii. Under Fixed step size, type in the sampling time in seconds. Forexample, if sampling at 100 Hz, type 0.01 seconds.b. Select the Workspace I/O tab:i. Uncheck all boxes in the Save to workspace area.ii. Uncheck “Limit data points to last” dialog box in the Save optionsarea.c. Select the Real-Time Workshop tab:i. Select browse.ii. Select nidll.tlc (LabVIEW DLL Target) >> OK.d. Click Apply and OK to close the <strong>Simulation</strong> Parameters dialog box.e. From the drop-down menu on the toolbar, select External.f. Save the Simulink model. Recall that no spaces can appear in a Simulinkfile name. The first character in the filename must not be a number.g. Ask your lab Teaching Assistant to review your Simulink model beforecontinuing.5. Close all LabVIEW programs that may be open, and build the Simulink model byselecting Tools >> Real-Time Workshop >> Build Model, or press Ctrl+B.6. Allow the Simulink model to build. LabVIEW will open and close in the process.The build is complete when the MATLAB command prompt displays:### Successful completion of Real-Time Workshop buildprocedure for model: filename.7. Do NOT close MATLAB.8. Open LabVIEW and create a New (blank) VI.9. Select the Front panela. Add a numerical or dial control for every data value you wish to change(ex. gains and constants).b. Add a numerical or graphical indicator for every data value you wish tooutput from your simulink model. At least one indicator must be presentfor each NI Sink used in the Simulink model.11
MEEN 364J. MlcakLast Update: 8/27/2006c. Label each control and indicator with a unique and descriptive name.10. Select Tools >> <strong>SIT</strong> Connection Manager:a. Select Load Model and verify that the Select Host dialog box has amachine name as “localhost” on port 6011. Click OK.b. Select the Simulink model and click OK.c. Link LabVIEW controls and indicators with Simulink blocks. Any blockthat must be varied in Simulink must be paired with a control, and everyNI Sink in Simulink must be paired with a LabVIEW indicator.i. Match a LabVIEW control with a Simulink gain or constant valueand click “Add to Connections”ii. Match a LabVIEW indicator with NI Sinks from Simulink andclick “Add to Connections”iii. Repeat for all desired connections between the LabVIEW andSimulink models.d. Click OK.11. If acquired will not be saved (logged), skip this step. For each data point that willbe logged:a. Double click the indicator on the front panel. This will take you to theindicator’s location in the Block diagram.b. Select Functions >> Output >> Write LVM and drag the Write LVMblock to a location under the indicator’s terminal block in the Blockdiagram.c. In the dialog box, select a file name where the data will be logged andsave it as a “.txt” file.d. Select options as shown in Figure 8.e. Click OK to close the dialog box.f. Use the wiring tool to connect the Signals port of the Write LVM block tothe wire that enters the indicator’s terminal block.g. Repeat steps a-f for all values that require logging.12. Save the LabVIEW VI in the project folder. A unique file name such asRUN_ME.vi will help separate this VI from the many others that were generatedin the build process.13. In LabVIEW, go to File>>Open:a. In your project folder, double-click the filename_nidll_rtw folderb. Open the filename_daq_driver.vic. Under “AI Channels” type in the analog input channels that any cables areconnected to on the terminal block.d. Under the “AO Channels” type in the analog output channels that anycables are connected to on the terminal block.e. Save the filename_daq_driver.vi and close it.14. If the PXI box is not already on, turn it on and allow it to boot.15. Run the VI created that has the user interface (RUN_ME.vi):a. In the dialog box type the following:i. Machine Name/IP: Type in the IP address listed on the PXI boxii. Port: 6011b. Check the “RT Target?” box12
MEEN 364J. MlcakLast Update: 8/27/2006c. Under “Path to Model VI”, click the open folder icon and selectfilename_main_daq.vi in the filename_nidll_rtw folder.d. Under “Path to Model DLL”, click the open folder icon and selectfilename.dll.e. Click OK in the “Select Host” dialog box to run the VI.f. Select the “Run <strong>SIT</strong>” button on the Front panel to run the <strong>SIT</strong>/Simulinkdiagram in LabVIEW.g. Select the “Stop <strong>SIT</strong>” button on the Front panel to stop the <strong>SIT</strong>/Simulinkdiagram in LabVIEW.h. Do NOT use the stop button that says “Stop VI” or the stop button on thetop toolbar because these do not properly close the <strong>SIT</strong>/Simulinkconnection with LabVIEW.For additional information, refer to:<strong>Simulation</strong> <strong>Interface</strong> <strong>Toolkit</strong> User Guide, National Instruments, 2002-2003.Available at http://www.ni.com13