Simulation Interface Toolkit (SIT) Tutorial
Simulation Interface Toolkit (SIT) Tutorial
Simulation Interface Toolkit (SIT) Tutorial

Create successful ePaper yourself
Turn your PDF publications into a flip-book with our unique Google optimized e-Paper software.
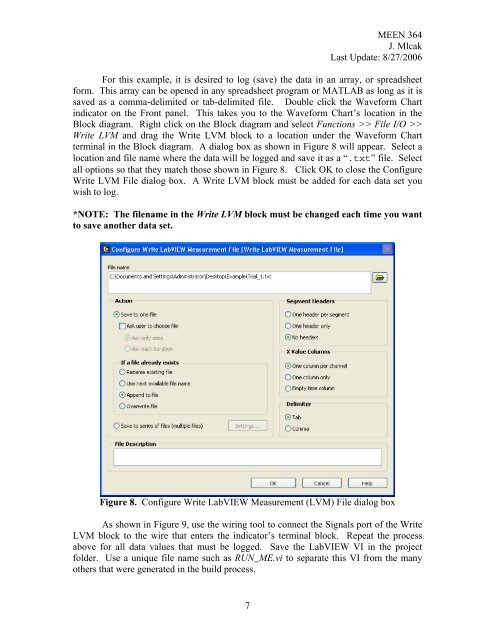
MEEN 364J. MlcakLast Update: 8/27/2006For this example, it is desired to log (save) the data in an array, or spreadsheetform. This array can be opened in any spreadsheet program or MATLAB as long as it issaved as a comma-delimited or tab-delimited file. Double click the Waveform Chartindicator on the Front panel. This takes you to the Waveform Chart’s location in theBlock diagram. Right click on the Block diagram and select Functions >> File I/O >>Write LVM and drag the Write LVM block to a location under the Waveform Chartterminal in the Block diagram. A dialog box as shown in Figure 8 will appear. Select alocation and file name where the data will be logged and save it as a “.txt” file. Selectall options so that they match those shown in Figure 8. Click OK to close the ConfigureWrite LVM File dialog box. A Write LVM block must be added for each data set youwish to log.*NOTE: The filename in the Write LVM block must be changed each time you wantto save another data set.Figure 8. Configure Write LabVIEW Measurement (LVM) File dialog boxAs shown in Figure 9, use the wiring tool to connect the Signals port of the WriteLVM block to the wire that enters the indicator’s terminal block. Repeat the processabove for all data values that must be logged. Save the LabVIEW VI in the projectfolder. Use a unique file name such as RUN_ME.vi to separate this VI from the manyothers that were generated in the build process.7