Simulation Interface Toolkit (SIT) Tutorial
Simulation Interface Toolkit (SIT) Tutorial
Simulation Interface Toolkit (SIT) Tutorial

Create successful ePaper yourself
Turn your PDF publications into a flip-book with our unique Google optimized e-Paper software.
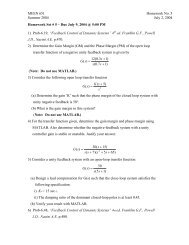
MEEN 364J. MlcakLast Update: 8/27/2006The Front panel of the main VI is shown in Figure 12. Select the “Run <strong>SIT</strong>”button on the Front panel to run the <strong>SIT</strong>/Simulink diagram in LabVIEW, and select the“Stop <strong>SIT</strong>” button on the Front panel to stop the <strong>SIT</strong>/Simulink diagram in LabVIEW.*NOTE: Do not use the stop button labeled “Stop VI” or the stop button on the toptoolbar. These stop buttons do not properly close the <strong>SIT</strong>/Simulink connection withLabVIEW.Run <strong>SIT</strong>Stop <strong>SIT</strong>Figure 12. LabVIEW Front panel after <strong>SIT</strong> connections are establishedTo convert the logged data to a variable in the MATLAB workspace, make surethe “.txt” file is in the MATLAB working directory. At the MATLAB command promptor a M-file type:load Trial_1.txtwhere Trial_1.txt is the filename given in the Write LVM block. This will create an arraylabeled Trial_1 in the MATLAB workspace. The first column of the array is time, andthe second column is the data set that was logged while running <strong>SIT</strong>.The data can be opened in Excel by first opening Excel, then going toFile>>Open. Under the “Files of Type” drop-down menu, select Text Files. Then selectthe “.txt” file containing the data you want. Click the next button twice, and then clickthe finish button. The data can then be manipulated using Excel. Like MATLAB, thefirst column is time, and the second column is the data set that was logged while running<strong>SIT</strong>.10