InGaP/GaAs HBT Safe Operating Area and Thermal ... - CS Mantech
InGaP/GaAs HBT Safe Operating Area and Thermal ... - CS Mantech
InGaP/GaAs HBT Safe Operating Area and Thermal ... - CS Mantech

You also want an ePaper? Increase the reach of your titles
YUMPU automatically turns print PDFs into web optimized ePapers that Google loves.
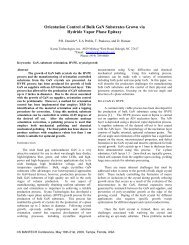
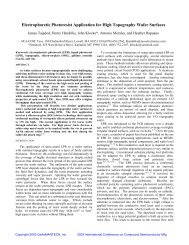
<strong>InGaP</strong>/<strong>GaAs</strong> <strong>HBT</strong> <strong>Safe</strong> <strong>Operating</strong> <strong>Area</strong> <strong>and</strong> <strong>Thermal</strong> Size EffectNick GM Tao, Chien-Ping Lee, Anthony St. Denis <strong>and</strong> Tim HendersonTriQuint Semiconductor, Inc., 2300 NE Brookwood Pkwy, Hillsboro, OR 97124Phone: (503) 615-9083 Email: ntao@tqs.comKeywords: <strong>HBT</strong>, SOA, <strong>GaAs</strong>, thermal effectAbstractDeeply underst<strong>and</strong>ing <strong>HBT</strong> thermal characteristics<strong>and</strong> safe operating area (SOA) is critical to theimprovement of the ruggedness <strong>and</strong> reliability of poweramplifiers. In this work, we investigate the device sizeeffect of SOA <strong>and</strong> thermal resistance by means ofexperimental measurement, analytical modeling <strong>and</strong> 3-dimensional simulation. For <strong>HBT</strong>s with a factor of tenvariations in emitter area, the SOAs are characterizedunder extremely high current density, <strong>and</strong> the thermalsimulations are performed <strong>and</strong> the thermal resistancesare measured with a thermal-electrical method. It isfound that with increasing device size, the SOA in termsof current density shrinks <strong>and</strong> thermal resistance perunit area increases, which is demonstrated by bothsimulation <strong>and</strong> measurement.2×3×10µm 2 , 2×3×20µm 2 , 2×3×30µm 2 , 2×3×40µm 2 , <strong>and</strong>2×3×50µm 2 respectively. Typical ground-signal-ground(GSG) pads are used for probing <strong>and</strong> there is no intentionalballasting resistor. A Keithley 4200-S<strong>CS</strong> parameter analyzeris used for the measurement.INTRODUCTION<strong>InGaP</strong>/<strong>GaAs</strong> heterojunction bipolar transistors (<strong>HBT</strong>s)have become a major technology in wireless poweramplifiers (PAs). As PA die size keeps shrinking, the size of<strong>HBT</strong> unit cell is of interest <strong>and</strong> higher operating currentdensity or higher power density may be desirable. On theother h<strong>and</strong>, PA ruggedness <strong>and</strong> junction temperature becomemore of a concern as power density increases. <strong>Safe</strong> operatingarea (SOA) that is normally used for the ruggednesscharacterization at device level has been recently studied [1,2], but the relationship between the device size <strong>and</strong> SOA hasnot been well investigated. <strong>Thermal</strong> effect is one of the keyfactors in SOA evaluation [3]; therefore the device thermalcharacteristics with respect to emitter area also need to bewell studied. In this paper, for the first time we report theSOAs with current density over 100kA/cm 2 for differentdevice sizes <strong>and</strong> explain a new high current densityphenomenon with analytical modeling. The results of thethermal simulation <strong>and</strong> thermal-electrical measurement forvarious device sizes are also reported, revealing the samesize effect as found in the SOA measurement.SOA MEASUREMENT AND MODELINGThe st<strong>and</strong>ard TQ<strong>HBT</strong>3 process [4] is used for the waferfabrication. The unit cell device has two emitter fingers <strong>and</strong>each finger has nominal width of 3µm <strong>and</strong> various lengthsfrom 5µm to 50µm. Emitter areas are 2×3×5µm 2 ,Fig. 1. Measured collector current density versus collector voltagewith stepped I b (a) <strong>and</strong> stepped V b (b) for the device size of2×3×50μm 2 . The insets are enlarged plots for the high current densitycurves <strong>and</strong> the circles are the points used to define the SOA boundary.8a<strong>CS</strong> MANTECH Conference, May 13th - 16th, 2013, New Orleans, Louisiana, USA219
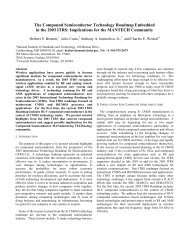
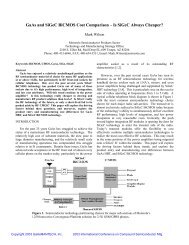
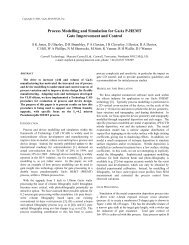
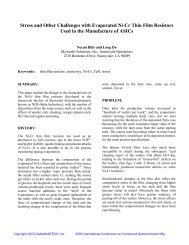
650μm SubstrateFig. 2. Calculated IV curves for the V b mode using analyticalmodels show the exactly the same high current densityphenomenon as found in the measurement.current (I b mode) <strong>and</strong> forcing voltage (V b mode). For eachbase bias step, the collector voltage V c is swept from zero upto the point where the device completely fail, while thecollector current I c is monitored. The device failure mostlyexhibits a snap-back of the collector current [5]. Since thetest is destructive, a large number of devices are measuredacross the wafer to obtain one SOA for each emitter size. Indoing so, the data has included the variation on the wafer. Asan example, Fig. 1(a) <strong>and</strong> (b) show the measured collectorcurrent density (J c ) versus collector voltage (V c ) with I b <strong>and</strong>V b modes for the device of 2×3×50µm 2 .Both I b <strong>and</strong> V b modes exhibit two régimes based ondifferent current behaviors: low current regime <strong>and</strong> highcurrent regime that is magnified in the inset of Fig. 1 (a) <strong>and</strong>(b) each. In order to define the loci of points which definethe SOA boundary, we use different criteria for these tworegimes.μm 2μm 2μm 2μm 2μm 2μm 2 μm 2μm 2μm 2μm 2μm 2μm 2Fig. 3. Measured SOA boundaries with I b mode (a) <strong>and</strong> V b mode(b) for various device sizes (shown in legend).The measurement is based on common emitterconfiguration <strong>and</strong> involves two base bias modes: forcingFig. 4. 3D model for the thermal simulation of a typical <strong>HBT</strong>unit cell. A cross section of the intrinsic device (dot-circled) isalso shown in the lower picture.In Fig. 1(a), when I b begins at very low level <strong>and</strong> thedissipated power is low, J c saturates until high V c thenincreases with sweeping V c due to impact ionization, <strong>and</strong>eventually, avalanche occurs at the point (as denoted circle1) where J c exhibits a snap-back (not shown); At higher I blevels, J c keeps decreasing with increasing V c in the on-statedue to the self-heating effect caused by significant dissipatedpower, <strong>and</strong> the device then fails at the point (as denotedcircle 2 or 3) where a snap-back occurs. All the snap-backpoints, e.g., circles 1, 2 <strong>and</strong> 3 in Fig. 1(a) define the loci inthe low current regime of the I b mode. At very high I b levels,J c decreases more rapidly with increasing V c <strong>and</strong> exhibits asudden drop or collapse before it goes into snap-back (seeinset of Fig. 1(a)). The current collapse implies that thedevice has been in such an unstable condition that oneemitter finger draws most of the current due to the thermalcoupling [5]. Therefore, we refer the J c collapsing points (as220 <strong>CS</strong> MANTECH Conference, May 13th - 16th, 2013, New Orleans, Louisiana, USA
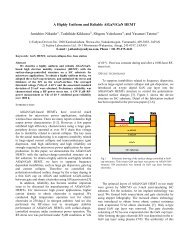
denoted circles in the inset of Fig. 1(a) to the loci in the highcurrent regime of the I b mode. We found that the currentcollapse occurs only for large size devices, i.g., 2×3×40µm 2 ,<strong>and</strong> 2×3×50µm 2 indicating that the small size devices mightnot have significant “multi-finger effect” as typically foundin other measurements [5] [2].<strong>and</strong> base current is low. We can postulate that the two modesgive rise to two extreme cases for the devices in real PAs.THERMAL SIMULATION AND MEASUREMENTμm 2μm 2μm 2μm 2μm 2μm 2 221Fig. 5. Simulated peak temperature versus dissipated power densityat room temperature for various device sizes (shown in the legend).In Fig. 1(b), when V b is low, the J c keeps increasing withsweeping V c due to the thermal effect [3] until the pointwhere the snap-back occurs <strong>and</strong> therefore, those snap-backpoints, e.g., circles 1 <strong>and</strong> 2, define the loci in the low currentregime of the V b mode. When V b is set higher, J c increasesinitially at slow rate <strong>and</strong> then exhibits a steep jump to a highcurrent regime where J c peaks <strong>and</strong> goes down to the snapback.This high current phenomenon is found in all sizedevices. It’s also found that as soon as the Jc passes thepeaks, the devices can easily fail even before the snap-backoccurs. So we assign those peak points as denoted circles inthe inset of Fig. 1(b) to the loci. To verify theaforementioned high current phenomenon for V b mode, wecalculate the IV curves as shown in Fig. 2 using analyticalmodels which include most important physical mechanismssuch as thermal, “Kirk”, <strong>and</strong> breakdown effects [3]. Fig. 2demonstrates that at high current regime, the J c significantlyincreases to a peak point (as denoted circles in Fig. 2) <strong>and</strong>drops until the snapback. Detailed modeling will be reportedseparately.Fig. 3 (a) <strong>and</strong> (b) show the measured SOAs with I b mode<strong>and</strong> V b mode respectively for all six emitter sizes. Withincreasing emitter size, the SOA shrinks. This size effect isattributed to the thermal resistance difference with size,which will be discussed in the next section. It is also notedthat for the same device size, the I b mode <strong>and</strong> V b mode giverise to the significantly different SOAs. This is because thebias conditions at the base side are very different for the twomodes. Specifically, for I b mode, the base current is high <strong>and</strong>base voltage is low, but for V b mode, the base voltage is highFig. 6. Simulated temperature profile across one finger diagonallyas indicated with a dash line in the inset which shows thetemperature map of the two emitter fingers at the power density of120kW/cm 2 .Fig. 7. (a): Measured base voltage (V be) vs. dissipated power density(P d) at different substrate temperatures, <strong>and</strong> (b): extrapolated V be0 vs.substrate temperature (T b)To obtain more precise results for the unit cells, athermal simulation is performed at microscale level, whichincludes all detailed metal <strong>and</strong> dielectric layers, mesageometry, <strong>and</strong> epi-layers. The tool CoventorWare [6] is used<strong>and</strong> the simulation is purely thermal without mechanical <strong>and</strong>electrical coupling. Fig. 4 shows a typical unit cell structureas measured in the SOA measurements. A cross section ofthe active device is also shown. The heat generation volumeis defined under the emitter <strong>and</strong> vertically across thecollector as indicated with the red dash line in Fig. 4, sincethe highest field is located within the collector [7]. The heatis assumed to be uniformly generated in the aforementionedvolume. The substrate backside is set to a heat sink withconstant temperature T b . Fig. 5 shows the simulated peaktemperature (T max ) in the unit cell versus dissipated powerdensity (P d W/cm 2 ) at room temperature for all differentemitter sizes. Precisely speaking, the relation of the peak8a<strong>CS</strong> MANTECH Conference, May 13th - 16th, 2013, New Orleans, Louisiana, USA
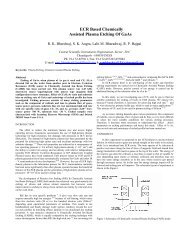
temperature <strong>and</strong> power density is parabolic, as we can see inFig. 5. But empirically when the power is not too high, alinear relation is valid such as:where R th is the thermal resistance with unit of cm 2·°C/W.Fig. 5 clearly demonstrates that the thermal resistanceincreases with emitter size. It should be noted that thetemperature is not uniform across the emitter area as shownin Fig. 6, <strong>and</strong> this non-uniformity becomes worse withincreasing emitter area following the same size effect as thethermal resistance.To compare with the simulation, we experimentallyobtain R th from thermal-electrical measurements. Basicallythe DC characteristics for each device size are measured atthe substrate temperatures of 25, 50, 75 <strong>and</strong> 100°C. The DCmeasurement involves sweeping base current at variouscollector voltage V ce while monitoring the collector currentdensity J c <strong>and</strong> base voltage V be . We then obtain, for variousV ce , a group of curves of J c vs V be , from which the V be versusdissipated power density P d = (I c ×V ce )/A e can be plotted for aspecific J c . The method detail can be found in [8] [9]. Therelation of V be <strong>and</strong> power density can be expressed as:whereis called thermal-electrical feedbackcoefficient which can be extracted by P d = 0 from (2) withvarious base temperatures.As an example, Fig. 7 shows the measured V be vs.dissipated power density for a current density of 40kA/cm 2at different base temperatures (a) <strong>and</strong> the correspondinglyextracted V be0 vs. T b (b). From the linear line in Fig. 7(b), thethermal-electrical feedback coefficient of our <strong>InGaP</strong>/<strong>GaAs</strong>(1)(2)Fig. 8. Comparison between two thermal resistances forvarious emitter areas (A e): one obtained by thermal simulation(solid diamond) <strong>and</strong> another one obtained by thermal-electricalmeasurement (hollow square).<strong>HBT</strong>s at a high current density of 40kA/cm 2 is obtained forthe first time, which is about 0.98mV/ºC.From Fig. 7(a) <strong>and</strong> equation (2), we can obtain thethermal resistance R th at room temperature <strong>and</strong> this value isthen compared with the R th obtained through thermalsimulation for each device size as shown in Fig. 8. It’simportant to note that an average junction temperature in thesimulation is used to compare with the measurement,because the temperature across the junction is not uniform asdiscussed previously <strong>and</strong> the result from the thermalelectricalmeasurement reflects an overall effect of thedevice junction. The comparison in Fig. 8 demonstrates thatthe device thermal resistances from the measurement <strong>and</strong>simulation are in good agreement for a large variation ofdevice sizes. More importantly, the thermal resistanceincreases with increasing device size <strong>and</strong> this thermal sizeeffect is consistent with the SOA size effect as discussedpreviously.CONCLUSIONSBoth measurement <strong>and</strong> simulation have demonstratedthat the SOA <strong>and</strong> thermal resistance of <strong>InGaP</strong>/<strong>GaAs</strong> <strong>HBT</strong>sfollow the same size effect, revealing that the device thermalperformance plays an important role in the SOA formation.The agreement between the theoretical analyses (thermalsimulation <strong>and</strong> analytical modeling) <strong>and</strong> measurementsindicate that the mechanism of SOA can be well understood.ACKNOWLEDGEMENTSThe authors would like to thank Dean Monthei <strong>and</strong> JohnHitt for helping with many technical issues in thermalsimulations.REFERENCES[1] C. Cismaru, H. Banbrook, <strong>and</strong> P. J. Zampardi, 2010 <strong>CS</strong> ManTech,Portl<strong>and</strong>, Oregon, USA, May 2010.[2] S.J. Li, C.K. Lin, S.H. Tsai, B.S. Hong, D. William, <strong>and</strong> Y.C. Wang,2011 <strong>CS</strong> ManTech, Palm Springs, California USA, May 2011[3] C.P. Lee, F. H. F. Chau, W. Ma, <strong>and</strong> N. L. Wang, Electron Devices,IEEE Transactions on, vol. 53, pp. 2681-2688, 2006.[4] http://www.triquint.com/prodserv/foundry/process_info[5] W. Liu, H<strong>and</strong>book of III-V Heterojunction Bipolar Transistors,John Wiley & Sons, Inc., 1998.[6] http://www.coventor.com/products/coventorware/[7] S.Madra, Microelectronics Reliability, vol. 44, pp. 1061- 1068, 2004.[8] D. E. Dawson, A. K. Gupta, <strong>and</strong> M. L. Salib, Electron Devices,IEEE Transactions on, vol. 39, pp. 2235-2239, 1992.[9] D. Williams <strong>and</strong> P. Tasker, in IEEE High Frequency PostgraduateStudent Colloquium 2000 Proceeding, 2000, pp. 71-75ACRONYMS<strong>HBT</strong>: Heterojunction Bipolar TransistorSOA: <strong>Safe</strong> <strong>Operating</strong> <strong>Area</strong>222 <strong>CS</strong> MANTECH Conference, May 13th - 16th, 2013, New Orleans, Louisiana, USA