Friction measurement methods and the correlation between road - VTI
Friction measurement methods and the correlation between road - VTI
Friction measurement methods and the correlation between road - VTI

Create successful ePaper yourself
Turn your PDF publications into a flip-book with our unique Google optimized e-Paper software.
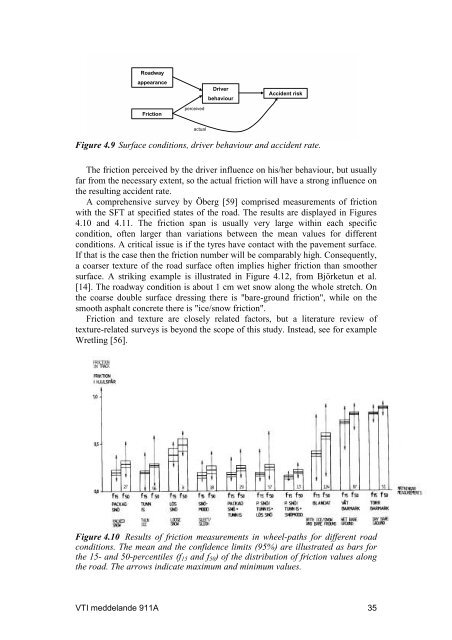
RoadwayappearanceDriverbehaviourAccident risk<strong>Friction</strong>perceivedactualFigure 4.9 Surface conditions, driver behaviour <strong>and</strong> accident rate.The friction perceived by <strong>the</strong> driver influence on his/her behaviour, but usuallyfar from <strong>the</strong> necessary extent, so <strong>the</strong> actual friction will have a strong influence on<strong>the</strong> resulting accident rate.A comprehensive survey by Öberg [59] comprised <strong>measurement</strong>s of frictionwith <strong>the</strong> SFT at specified states of <strong>the</strong> <strong>road</strong>. The results are displayed in Figures4.10 <strong>and</strong> 4.11. The friction span is usually very large within each specificcondition, often larger than variations <strong>between</strong> <strong>the</strong> mean values for differentconditions. A critical issue is if <strong>the</strong> tyres have contact with <strong>the</strong> pavement surface.If that is <strong>the</strong> case <strong>the</strong>n <strong>the</strong> friction number will be comparably high. Consequently,a coarser texture of <strong>the</strong> <strong>road</strong> surface often implies higher friction than smoo<strong>the</strong>rsurface. A striking example is illustrated in Figure 4.12, from Björketun et al.[14]. The <strong>road</strong>way condition is about 1 cm wet snow along <strong>the</strong> whole stretch. On<strong>the</strong> coarse double surface dressing <strong>the</strong>re is "bare-ground friction", while on <strong>the</strong>smooth asphalt concrete <strong>the</strong>re is "ice/snow friction".<strong>Friction</strong> <strong>and</strong> texture are closely related factors, but a literature review oftexture-related surveys is beyond <strong>the</strong> scope of this study. Instead, see for exampleWretling [56].Figure 4.10 Results of friction <strong>measurement</strong>s in wheel-paths for different <strong>road</strong>conditions. The mean <strong>and</strong> <strong>the</strong> confidence limits (95%) are illustrated as bars for<strong>the</strong> 15- <strong>and</strong> 50-percentiles (f 15 <strong>and</strong> f 50 ) of <strong>the</strong> distribution of friction values along<strong>the</strong> <strong>road</strong>. The arrows indicate maximum <strong>and</strong> minimum values.<strong>VTI</strong> meddel<strong>and</strong>e 911A 35