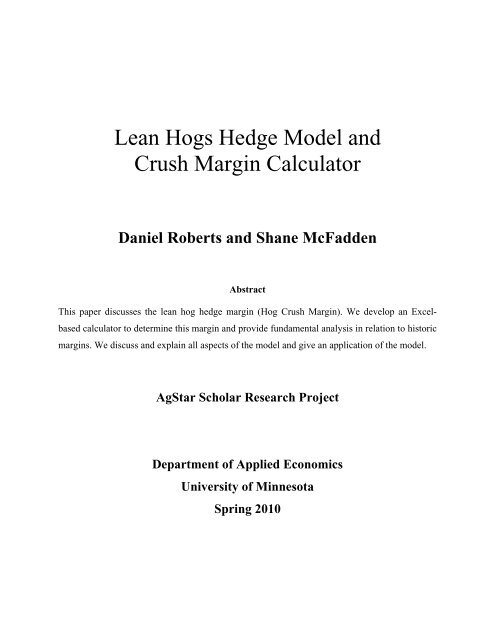
Lean Hogs Hedge Model and Crush Margin Calculator
Lean Hogs Hedge Model and Crush Margin Calculator
Lean Hogs Hedge Model and Crush Margin Calculator

You also want an ePaper? Increase the reach of your titles
YUMPU automatically turns print PDFs into web optimized ePapers that Google loves.
price is determined by the local bid price. These calculations are then incorporated into the othercosts of production, <strong>and</strong> ultimately determine the projected profit per hundredweight or per headof lean hogs.The model is the beginning of what can potentially become an intricate tool. While thecorn bids on this model come from Crystal Valley Cooperative, where the Roberts Farm doesbusiness, figures for corn prices could be exp<strong>and</strong>ed to include different elevators at the click of abutton. It would also be very useful to have a way to automatically update corn contract pricesfor local elevators the same way our model automatically updates futures market prices. Thiswould save time <strong>and</strong> decrease errors by the user. As far as the assumptions <strong>and</strong> fixed costs, themodel could also be specific to certain hog sites, diets, <strong>and</strong> could also be used in comparison tothe corn, soybean meal, <strong>and</strong> lean hog prices when transportation costs <strong>and</strong> other site-specificconsiderations are taken into account. Finally, a more thorough analysis of historical marginscould be performed to improve percentile analysis of the hedge profit.As stated earlier, this model uses input information pertaining to the Roberts operation,<strong>and</strong> certain tables, such as the cost of production tab, are categorized according to their financialstatements <strong>and</strong> in accordance with Iowa State averages. However, this model can easily beapplied to most hog operations in southern Minnesota <strong>and</strong> throughout the Midwest. Costs ofproduction as well as local feed costs can easily be adjusted, <strong>and</strong> will be automaticallyincorporated into the hedging calculation.Another reason why this model is easily convertible to other hog operations is because itis based on a per hundredweight basis. That type of calculation makes it possible to comparedifferent farms with each other. The input is either reliably st<strong>and</strong>ardized or based on local feedcosts to be inputted by the producer. The cost per head will often be different based on the scaleof the operation, but making simple changes to the costs in the model will account for thosedifferences. The user can simply input their desired market weight <strong>and</strong> it will change allassumptions within the model.III. OVERVIEW OF SECTIONSBefore any projections can be made, the fixed costs of production must be taken intoaccount by going to the Cost of Production tab. These costs cover every expense per head fromfarrow-to-finish minus the volatile costs of corn <strong>and</strong> soybean meal. There is a flat rate for the4 | P age
cost of raising a pig from farrow-to-weaning, which in our model is $35 per head (see Exhibit 1).From weaning to finishing, this table summarizes all the costs of vitamins/minerals, feedprocessing <strong>and</strong> delivery, health, labor, facilities, utilities, transportation, as well as interest cost.Exhibit 1. Cost of ProductionThis exhibit from the model breaks down the costs, which can be changed by the producer at thetouch of a keypad, <strong>and</strong> automatically totals it <strong>and</strong> puts the cost into the calculator. In thisscenario, the total cost per head minus corn <strong>and</strong> soybean meal is $75.48. The user can changeany of the cells highlighted in gray to fit the financial information available to them. Forexample, the weaned pig cost can be highly variable <strong>and</strong> the user may wish to use a generalconvention such as 50% of the 5-month delayed lean hog futures.This tab contains a comm<strong>and</strong> button macro that enables the user to return to the defaultvalues at any time. The other comm<strong>and</strong> button will clear all values with a single click. As statedearlier, the user can also change the desired weight <strong>and</strong> applicable premium price on this page.The premium is the percent over base that the operation is projected to obtain, or historically hasobtained, because of minimal sort loss. This can be seen in Exhibit 2.5 | P age
Exhibit 2. Weight <strong>and</strong> Premium Assumptions in Cost of Production tabWEIGHT AssumptionsLive Weight 270 PremiumConverted Carcass 199.8 3.50%With the other costs established, it is necessary to move to the Feed Composition tab tobreak down <strong>and</strong> make assumptions on feed consumption per head, from wean-to-finish. Exhibit3 shows the breakdown in corn <strong>and</strong> soybean meal feeding based on the stage of growth. Thedefault model (based on diets composed by Agri-Nutrition Services) has three phases at thenursery stage <strong>and</strong> six phases at the grower stage with corn consumption increasing in each stage<strong>and</strong> the soybean meal-to-corn ratio increasing during the nursery stage <strong>and</strong> then graduallydecreasing in the growth stage.Exhibit 3. Feed CompositionGrowth Stage Gestation Lactation Nursery 1 Nursery 2 Nursery 3 GF 1 GF 2 GF3 GF4 GF5 GF6Corn lbs/ton 1605 1291 924 962 1123 1358 1488 1634 1745 1814 1846Soy Meal lbs/ton 302 573 99 448 734 511 383 280 212 146 119Corn Bushels per pig 10.7416Soy Meal Tons Per Pig 0.044765Recalculations can be done whenever there is a change in ration at any given stage. Theformulations end with the amount of total corn <strong>and</strong> soybean meal per head is converted intobushels <strong>and</strong> tons, respectively, in order for easy comparisons to futures <strong>and</strong> cash prices of thoseproducts. For operations with a different number of growth phases or otherwise configureddifferently, a slight rearrangement of the table may be necessary. However, this task should notbe difficult for most people with experience using Microsoft Excel. New columns can be insertedor existing columns can be renamed. We opted to make this step less automatic in order topreserve ultimate customization. Feed rations are extremely variable, <strong>and</strong> users should beallowed to either accept the highly efficient assumptions that are default to the model, or makeup any variety of feed ratio scenarios. Further automation in this step would almost certainlyinhibit the functionality of this model.6 | P age
Using the futures market price is the fundamental role of this model. The ability to set aprice for commodities in the future is a valuable resource for producers, <strong>and</strong> this tool is a way inwhich to enhance that resource. Using basis data from Iowa State University (ISU Current <strong>Crush</strong><strong>Margin</strong>s), our model has a month-by-month breakdown of the lean hog basis using the averagesof the first half <strong>and</strong> second half of each month. This historical data is an effective way ofprojecting future prices. Using basis is better than a straight prediction of price because basistrends are much more consistent <strong>and</strong> no matter what the futures price is in any given month oryear the cash price will be correlated with the basis. Exhibit 4 shows the historical trends of thelean hog basis.Exhibit 4. <strong>Lean</strong> hog historical basis$/cwt0‐0.5‐1‐1.5‐2‐2.5‐3‐3.5‐4‐4.5‐5Jan Feb Mar Apr May Jun<strong>Lean</strong> <strong>Hogs</strong> historical basis, CMEJul Aug Sep Oct Nov DecThe basis for lean hogs usually tightens up in the summer months <strong>and</strong> stretches outbetween October <strong>and</strong> April. This is directly correlated with the biological production cycle wheretypically there is less pork produced during the summer months due to fall breeding difficulties(biological) <strong>and</strong> reduced weights due to higher temperatures.Factoring in the basis for soybean meal is done in a simple, reliable way. The threemonths nearest to the current month have a basis of -$5.00/ton. All months farther out than threemonths have a basis of -$10.00.A feature of Excel which enables this tool to be effective is the use of data updating fromthe web. Separate tables consisting of the futures prices of corn <strong>and</strong> soybeans from the Chicago7 | P age
Board of Trade (CBOT) <strong>and</strong> lean hog futures from the Chicago Mercantile Exchange (CME).Using the Excel tab “Data”=> “Get External Data”=> “From Web” (Exhibit 5), it is possible toobtain constantly updated data for these prices.Exhibit 5. Importing data from webThis feature will inform the user of all the trading months, as well as other information inaddition to the current price as an additional reference for the user. The web query is set toautomatically update every 15 minutes; this can be adjusted by the user if necessary. It isimportant to note that the user must enable data connections every time they open thespreadsheet to enable this function to work. Other conventions were performed to enhanceautomation, such as formatting the query to not recognize the date format <strong>and</strong> some functionalconversions of queried names to match other queried names.The information up to this point is all used in the calculator which projects potentialhedging profits on lean hogs. The total cost per hundredweight is formulated first. This is doneby taking the local forward price from Crystal Valley Cooperative. If desired, the user has theoption to input the futures price for corn with the appropriate button, <strong>and</strong> then manually input abasis in the appropriate column if needed.Soybean meal is tabulated by the futures price for the respective month, <strong>and</strong> then addedto the projected basis as described to determine the cash price. These prices are multiplied by thenumber of bushels of corn <strong>and</strong> tons of soybean meal per head in the Feed Composition tab. This8 | Page
gives the total feed cost per head. The other fixed costs are then added to give the total cost perhead, <strong>and</strong> then converted into total cost per hundredweight based on a 200 lbs/head carcassweight.The lean hog futures price for the month is then input less the projected basis for theanticipated price. A premium is then added (in this example it is 3.5%) which gives the net leanhog price per hundredweight. The total cost per hundredweight is subtracted from the net pricereceived per hundredweight to give the hedged profit per hundredweight. This amount can thenbe doubled to give the net price per head.IV. EXPLANATION IN DEPTHThe data upload feature of the three futures prices tables is a valuable tool as has alreadybeen described. This information is then incorporated into the crush calculator by using theVLOOKUP function (See Exhibit 6). This is used for the prices of futures corn, Crystal Valleycorn, soybean meal futures, <strong>and</strong> lean hog futures. The VLOOKUP is used to ensure that theprices carry over from their respective tables based on the trading months. This allows the valuesin the calculator to still be accurate if there is any modification to the tables. It also decreases thechance of any errors in the calculator.Exhibit 6. Example of VLOOKUP functionA macro function is incorporated into the model to allow the user to easily switchbetween the contract corn price from Crystal Valley Cooperative <strong>and</strong> the futures corn price fromthe CBOT (see Exhibit 7). Switching from one price source to the other will automaticallyupdate costs <strong>and</strong> hedge profit in the model. When applying the CBOT futures corn prices, theuser can manually input a basis that is pertinent to their situation. This enables flexibility inestablishing the cash corn price.9 | Page
Exhibit 7. Corn price macroThe VLOOKUP, corn price macro, <strong>and</strong> auto updates are essential to this model. Itensures current <strong>and</strong> accurate information, organization of data, <strong>and</strong> flexibility in making hedgingprojections.The model also uses the IF <strong>and</strong> ISNA function combination to compensate for months inwhich a futures contract for corn, soybean meal or lean hogs does not trade. For example, if youare looking at January 11 (a month without a futures contract for corn), the VLOOKUP resultwould normally be “N/A.” This function automatically uses the next available month of pricedata to give at least an estimate of the price.Also used in conjunction with the VLOOKUP function is the LEFT function. Thisfunction allows the VLOOKUP function to work despite having different naming associationsfor the date/month. For example, the function can look up only the left 3 digits when used inconjunction with VLOOKUP.Example with ResultsThe end result is the open market hedge margin sheet titled “<strong>Crush</strong> <strong>Calculator</strong>”. In theexample we have input the default costs under the Cost of Production tab, including a 3.5%premium <strong>and</strong> a 270 pound market weight (this converts over to a 200 pound carcass). Assumingdata from the Default Feed Assumptions tab, the end result can be seen in Exhibit 8.10 | P age
Exhibit 8. <strong>Crush</strong> <strong>Calculator</strong> tab with resultsCornFutures BasisCash SoybeanCorn MealCashMealFeed Cos tper hdOpen Market <strong>Hedge</strong> <strong>Margin</strong>OtherFixedMonthBasisNetPer HdMay 10 3.58 3.58 285.5 ‐5 280.5 51.01 75.48 63.31 90 ‐1.92 88.08 91.23 27.92 55.79 47.48 100%Jun 10 3.67 3.67 287.8 ‐5 282.8 52.08 75.48 63.84 86.85 ‐1.39 85.46 88.50 24.66 49.26 47.88 88%Jul 10 3.67 3.67 287.8 ‐5 282.8 52.08 75.48 63.84 86.95 ‐1.745 85.205 88.25 24.40 48.76 47.88 95%Aug 10 3.75 3.75 285 ‐10 275 52.59 75.48 64.10 86.8 ‐0.185 86.615 89.65 25.55 51.06 48.07 95%Sep 10 3.75 3.75 280 ‐10 270 52.37 75.48 63.99 76.75 ‐0.29 76.46 79.15 15.16 30.29 47.99 81%Oct 10 3.835 3.84 272.5 ‐10 262.5 52.94 75.48 64.28 76.75 ‐0.76 75.99 78.68 14.40 28.77 48.21 86%Nov 10 3.835 3.84 271.5 ‐10 261.5 52.90 75.48 64.25 73.75 ‐4.045 69.705 72.29 8.03 16.05 48.19 80%Dec 10 3.835 3.84 271.5 ‐10 261.5 52.90 75.48 64.25 73.75 ‐4.68 69.07 71.65 7.40 14.78 48.19 80%Jan 11 3.98 3.98 272.5 ‐10 262.5 54.50 75.48 65.06 73.9 ‐3.95 69.95 72.54 7.48 14.95 48.79 78%Feb 11 3.98 3.98 273.5 ‐10 263.5 54.55 75.48 65.08 73.9 ‐2.42 71.48 74.07 8.99 17.96 48.81 72%Mar 11 3.98 3.98 273.5 ‐10 263.5 54.55 75.48 65.08 74.8 ‐4.695 70.105 72.72 7.64 15.27 48.81 47%Apr 11 4.065 4.07 272.5 ‐10 262.5 55.42 75.48 65.51 74.8 ‐4.71 70.09 72.71 7.19 14.38 49.13 49%May 11 4.065 4.07 272.5 ‐10 262.5 55.42 75.48 65.51 78.100 ‐1.92 76.18 78.91 13.40 26.77 49.13 55%Jun 11 4.13 4.13 274.0 ‐10 264 56.18 75.48 65.90 80 ‐1.39 78.61 81.41 15.51 31.00 49.42 62%Jul 11 4.13 4.13 274.0 ‐10 264 56.18 75.48 65.90 79.000 ‐1.745 77.255 80.02 14.12 28.22 49.42 62%Aug 11 0 0 274.1 ‐10 264.1 11.82 75.48 43.69 76.400 ‐0.185 76.215 78.89 35.19 70.32 32.77 #N/AThe blue highlighted column titled “<strong>Hedge</strong> Profit” is the desired result of the crushcalculator. As we have seen, the corn futures price has been taken along with soybean meal withbasis, other fixed costs, etc. <strong>and</strong> is subtracted from the lean hog (LH) futures price. The <strong>Hedge</strong>Profit column is on a per hundredweight (CWT) basis. The per head basis is in the next columnto the right. Of course, the results will change whenever new data is obtained from marketsources.An additional feature of the model is a percentile analysis of the hedge margin. We used15 years of corn, soybean meal, <strong>and</strong> lean hog price data to analyze the monthly average st<strong>and</strong>ard.The current margins can be compared to historical margins by looking at the percentile. Forexample, if the percentile of the margin is 74%, this means that the current margin is better than74% of the monthly average margins in the last 15 years.CwtB/ELHFuturesProbableBasisFuturesLess Basis<strong>Hedge</strong>ProfitLiveB/EPercentileof <strong>Hedge</strong>V. CONCLUSIONThis paper reports on a tool that can be used by pork producers to develop their margin <strong>and</strong>recognize possible hedging opportunities. The simplicity of the model makes it user-friendly <strong>and</strong>underst<strong>and</strong>able. The layout of the model allows the user to use his or her data or use as manydefault assumptions as necessary. Ideally, the producer can use this data <strong>and</strong> analysis to makemanagement decisions in a timely manner. The model uses real-time information to allow day-11 | P age
to-day comparisons <strong>and</strong> easier trend analysis. Finally, percentile analysis of historical marginsallows producers <strong>and</strong> lenders to set up marketing strategies to reach a desired profit goal.VI.REFERENCESISU Current <strong>Crush</strong> <strong>Margin</strong>shttp://econ2.econ.iastate.edu/outreach/agriculture/periodicals/ifo/margins/Chicago Mercantile Exchangehttp://www.cmegroup.comUSDA ERShttp://ers.usda.govCrystal Valley Coophttp://www.crystalvalley.coop12 | P age


![Publications Since 2000[1].docx](https://img.yumpu.com/30237513/1/190x245/publications-since-20001docx.jpg?quality=85)