Prefrontal Cortex, Thalamus, and Cerebellar Volumes in ...
Prefrontal Cortex, Thalamus, and Cerebellar Volumes in ...
Prefrontal Cortex, Thalamus, and Cerebellar Volumes in ...

You also want an ePaper? Increase the reach of your titles
YUMPU automatically turns print PDFs into web optimized ePapers that Google loves.
BRAIN VOLUMES IN YOUTHS 1591<br />
et al., 1999), <strong>and</strong> compromised pontocerebellar <strong>and</strong> cerebellothalamocortical<br />
systems (Sullivan 2003) were reported<br />
<strong>in</strong> adults with an AUD.<br />
PFC <strong>and</strong> the cerebellar hemispheres are bra<strong>in</strong> regions<br />
that undergo active developmental changes dur<strong>in</strong>g adolescence<br />
(Durston et al., 2001; Giedd et al., 1999; Paus et al.,<br />
2001; Pfefferbaum et al., 1994; Thompson et al., 2000). The<br />
acquisition of executive cognitive functions, which reflect<br />
the maturation of the prefrontal-thalamic-cerebellar structures,<br />
encompass higher cognitive functions (Miller <strong>and</strong><br />
Cohen, 2001; Schmahmann, 1997). Adolescents with AUD<br />
show deficits <strong>in</strong> cognitive functions, <strong>in</strong>clud<strong>in</strong>g lower IQ <strong>and</strong><br />
achievement scores <strong>in</strong> read<strong>in</strong>g than control subjects (Moss<br />
et al., 1994) <strong>and</strong> neurocognitive deficits <strong>in</strong> attention, visuospatial,<br />
<strong>and</strong> memory function<strong>in</strong>g (Brown et al., 2000). In a<br />
prospective study of adolescents with AUD, ages 14 to 17<br />
years, many of whom had at least one other substance use<br />
disorder (60% had significant cannabis use), substance use<br />
disorders predicted poorer performances on tests of memory<br />
<strong>and</strong> attention (Tapert et al., 2002b). On the other h<strong>and</strong>,<br />
subjects who were offspr<strong>in</strong>g of <strong>in</strong>dividuals with alcoholism,<br />
<strong>and</strong> so were at high familial risk for an AUD, perform<br />
poorly on measures of executive cognitive function (Giancola<br />
et al., 1996; Harden <strong>and</strong> Pihl 1995; Hill, 2004; Tarter et<br />
al., 1999). This raises speculation that as a result of <strong>in</strong>herent<br />
prefrontal-thalamic-cerebellar vulnerabilities, there may be<br />
a predisposition to an adolescent-onset AUD (Wiers et al.,<br />
1994).<br />
Consequently, as prefrontal-thalamic-cerebellar structures<br />
are actively matur<strong>in</strong>g dur<strong>in</strong>g adolescence, we compared<br />
volume measures of these regions of <strong>in</strong>terest <strong>in</strong><br />
adolescents <strong>and</strong> young adults with adolescent-onset AUD<br />
with those of matched comparison subjects. It was hypothesized<br />
that adolescents with an AUD will have structural<br />
deficits <strong>in</strong> these structures compared with sociodemographically<br />
similar healthy control subjects. Given that<br />
adult females with an AUD may show disproportionately<br />
negative effects on bra<strong>in</strong> structure <strong>and</strong> function from excessive<br />
dr<strong>in</strong>k<strong>in</strong>g than adult males with an AUD (Harper et<br />
al., 1990; Hommer et al., 1996; Hommer, 2003; Mann, et<br />
al., 1992), a comparison of sex differences was also planned.<br />
MATERIALS AND METHODS<br />
Subjects<br />
Adolescents (def<strong>in</strong>ed as age 13 to 17 years) <strong>and</strong> young adults (def<strong>in</strong>ed<br />
as age 18 to 21 years) with an adolescent-onset AUD <strong>and</strong> healthy comparison<br />
subjects were recruited (Table 1). Because of the high degree of<br />
known variability <strong>in</strong> volume of bra<strong>in</strong> structures (Lange et al., 1997), two<br />
healthy comparison subjects were case-matched for each subject with an<br />
AUD for age (with<strong>in</strong> six months), sex, <strong>and</strong> h<strong>and</strong>edness. Groups were<br />
similar on height, weight, socioeconomic status (SES) <strong>and</strong> full-scale IQ.<br />
The comparison group was recruited by advertisement from the community<br />
<strong>and</strong> these subjects had no lifetime histories of psychiatric disorders,<br />
<strong>in</strong>clud<strong>in</strong>g alcohol <strong>and</strong> substance use disorders.<br />
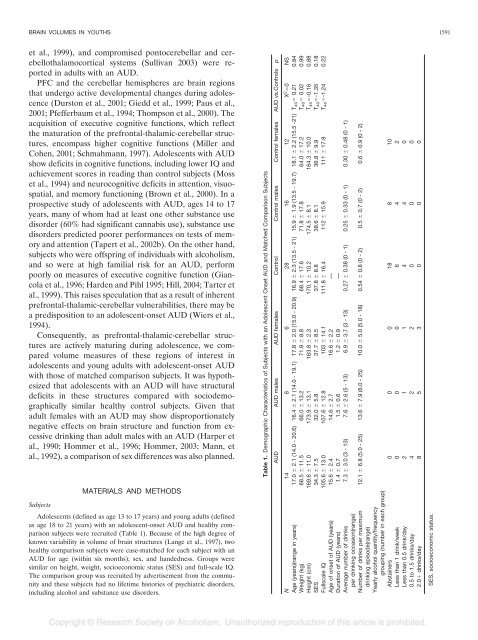
Table 1. Demographic Characteristics of Subjects with an Adolescent Onset AUD <strong>and</strong> Matched Comparison Subjects<br />
AUD AUD males AUD females Control Control males Control females AUD vs.Controls p<br />
N 14 8 6 28 16 12 X2�0 NS<br />
Age (years)(range <strong>in</strong> years) 17.0 � 2.1 (14.0 - 20.6) 16.4 � 2.1 (14.0 - 19.1) 17.8 � 2.0 (15.0 - 20.9) 16.9 � 2.3 (13.5 - 21) 15.9 � 1.9 (13.5 - 19.7) 18.1 � 2.2 (15.5 -21) T40� 0.21 0.84<br />
Weight (kg) 68.5 � 11.5 66.0 � 13.2 71.9 � 8.8 68.4 � 17.6 71.8 � 17.8 64.0 � 17.2 T40� 0.02 0.99<br />
Height (cm) 169.6 � 11.0 173.9 � 13.1 163.8 � 2.3 170.1 � 10.2 174.5 � 8.1 164.3 � 10.0 T40�-0.16 0.88<br />
SES 34.3 � 7.5 32.0 � 5.8 37.7 � 8.5 37.8 � 8.8 38.6 � 8.1 36.8 � 9.9 T40�-1.35 0.18<br />
Fullscale IQ 105.6 � 13.0 107.6 � 12.8 103 � 14.1 111.8 � 16.4 112 � 15.9 111 � 17.8 T40�-1.24 0.22<br />
Age of onset of AUD (years) 15.6 � 2.4 14.6 � 2.7 16.6 � 2.2 ––<br />
Duration of AUD (years) 1.4 � 0.7 1.5 � 0.6 1.2 � 0.9 ––<br />
Average number of dr<strong>in</strong>ks<br />
7.3 � 3.0 (3 - 13) 7.6 � 2.6 (5 - 13) 6.9 � 3.7 (3 - 13) 0.27 � 0.38 (0 - 1) 0.25 � 0.33 (0 - 1) 0.30 � 0.48 (0 - 1)<br />
per dr<strong>in</strong>k<strong>in</strong>g occasion(range)<br />
Number of dr<strong>in</strong>ks per maximum 12.1 � 6.8 (5.0 - 25) 13.6 � 7.9 (6.0 - 25) 10.0 � 5.0 (5.0 - 18) 0.54 � 0.8 (0 - 2) 0.5 � 0.7 (0 - 2) 0.6 � 0.9 (0 - 2)<br />
dr<strong>in</strong>k<strong>in</strong>g episode(range)<br />
Yearly alcohol quantity/frequency<br />
group<strong>in</strong>g (number <strong>in</strong> each group)<br />
Absta<strong>in</strong>ers<br />
0<br />
0<br />
0<br />
18<br />
8<br />
10<br />
Less than 1 dr<strong>in</strong>k/week<br />
0<br />
0<br />
0<br />
6<br />
4<br />
2<br />
Less than 0.5 dr<strong>in</strong>k/day<br />
2<br />
1<br />
1<br />
4<br />
4<br />
0<br />
0.5 to 1.5 dr<strong>in</strong>ks/day<br />
4<br />
2<br />
2<br />
0<br />
0<br />
0<br />
2.0� dr<strong>in</strong>ks/day<br />
8<br />
5<br />
3<br />
0<br />
0<br />
0<br />
SES, socioeconomic status.