Prefrontal Cortex, Thalamus, and Cerebellar Volumes in ...
Prefrontal Cortex, Thalamus, and Cerebellar Volumes in ...
Prefrontal Cortex, Thalamus, and Cerebellar Volumes in ...

You also want an ePaper? Increase the reach of your titles
YUMPU automatically turns print PDFs into web optimized ePapers that Google loves.
BRAIN VOLUMES IN YOUTHS 1593<br />
cooperation, <strong>and</strong> image quality. We required that the midsagittal slice<br />
show full visualization of the cerebral aqueduct <strong>and</strong> the anterior <strong>and</strong><br />
posterior commissures, <strong>in</strong> which a l<strong>in</strong>e was estimated requir<strong>in</strong>g the<br />
anterior-commissure-posterior-commissure l<strong>in</strong>e to be with<strong>in</strong> three degrees<br />
of 180. If these criteria were not met, the subject was realigned until these<br />
criteria were met. A three-dimensional spoiled gradient recalled acquisition<br />
<strong>in</strong> the steady-state pulse sequence was used to obta<strong>in</strong> 124 contiguous<br />
images with slice thickness of 1.5 mm <strong>in</strong> the coronal plane for region of<br />
<strong>in</strong>terest measures (TE � 5 msec, TR � 25 msec, flip angle � 40 degrees,<br />
acquisition matrix � 256 � 192, number of excitations � 1, field of vision<br />
� 24 cm). Coronal sections were obta<strong>in</strong>ed perpendicular to the anteriorcommissure-posterior-commissure<br />
l<strong>in</strong>e to provide a more reproducible<br />
guide for image orientation. Axial proton density <strong>and</strong> T 2-weighted images<br />
were obta<strong>in</strong>ed to enable exclusion of structural abnormalities on MRI. A<br />
neuroradiologist reviewed all scans <strong>and</strong> ruled out cl<strong>in</strong>ically significant<br />
abnormalities. All subjects tolerated the procedure well. No sedation was<br />
used.<br />
The imag<strong>in</strong>g data from the coronal sections were transferred from the<br />
MRI unit to a computer workstation (PowerMac<strong>in</strong>tosh, Apple Computer)<br />
<strong>and</strong> analyzed with the use of IMAGE software (version 1.61) developed at<br />
the NIH (Rasb<strong>and</strong>, 1996) that provides valid <strong>and</strong> reliable volume measurements<br />
of specific structures us<strong>in</strong>g a manually operated (h<strong>and</strong> trac<strong>in</strong>g)<br />
approach. Tra<strong>in</strong>ed <strong>and</strong> reliable raters who were bl<strong>in</strong>ded to subject <strong>in</strong>formation<br />
made all measurements. These methods were previously described<br />
by our group (De Bellis et al., 1999; De Bellis et al., 2002; De Bellis et al.,<br />
2001) <strong>and</strong> are briefly presented here.<br />
Intracranial volumes were calculated by first manually trac<strong>in</strong>g the<br />
<strong>in</strong>tracranial volume of each coronal slice after exclusion of skull <strong>and</strong> dura,<br />
then summ<strong>in</strong>g these areas of successive coronal slices, <strong>in</strong>clud<strong>in</strong>g GM <strong>and</strong><br />
WM <strong>and</strong> cerebral sp<strong>in</strong>al fluid (CSF) volumes, <strong>and</strong> multiply<strong>in</strong>g by slice<br />
thickness. These measures <strong>in</strong>cluded frontal, parietal, temporal, occipital<br />
cortex, subcortical structures, cerebellum, <strong>and</strong> bra<strong>in</strong>stem.<br />
Cerebral volumes were measured after manual exclusion of CSF volumes,<br />
cerebellum, <strong>and</strong> bra<strong>in</strong>stem <strong>in</strong> the same manner <strong>and</strong> <strong>in</strong>cluded cortical<br />
<strong>and</strong> subcortical structures.<br />
<strong>Prefrontal</strong> cortex volumes were calculated by summ<strong>in</strong>g up areas of<br />
successive coronal slices, <strong>in</strong>clud<strong>in</strong>g gray <strong>and</strong> white matter <strong>and</strong> CSF volumes<br />
<strong>and</strong> multiply<strong>in</strong>g by slice thickness. The anterior boundary of the<br />
prefrontal cortex was def<strong>in</strong>ed as the most anterior coronal section conta<strong>in</strong><strong>in</strong>g<br />
gray matter. The coronal slice show<strong>in</strong>g the genu of the corpus<br />
callosum was used to mark the posterior limit of the prefrontal cortex<br />
(Rosenberg et al., 1997). <strong>Prefrontal</strong> white <strong>and</strong> gray matter volumes were<br />
calculated by us<strong>in</strong>g a semiautomated segmentation algorithm. This computerized<br />
segmentation technique uses mathematically derived cutoffs for<br />
gray matter–white matter–CSF partitions with histograms of signal <strong>in</strong>tensities.<br />
This computerized segmentation technique is both labor <strong>in</strong>tensive<br />
<strong>and</strong> manually operated. It uses an <strong>in</strong>teractive method <strong>in</strong> which mathematically<br />
derived cutoffs for gray matter–white matter–CSF partitions from<br />
histograms of signal <strong>in</strong>tensities are used to <strong>in</strong>dividually select gray matter,<br />
white matter, <strong>and</strong> CSF areas from each coronal slice. Gray matter, white<br />
matter, <strong>and</strong> CSF areas are thus separately calculated <strong>and</strong> multiplied by<br />
slice thickness for the <strong>in</strong>dividual subject’s gray matter, white matter, <strong>and</strong><br />
CSF volumes. In this way, we can m<strong>in</strong>imize the <strong>in</strong>herent limitations on<br />
qualify<strong>in</strong>g white matter signal hypo<strong>in</strong>tensities as gray matter on T 1weighted<br />
MRI scans by visual <strong>in</strong>spection of slices (i.e., so that hypo<strong>in</strong>tensity<br />
artifacts <strong>in</strong> corpus callosum or cerebral white matter are not calculated<br />
as gray matter). This approach has been validated by us<strong>in</strong>g both a stereology<br />
technique for bra<strong>in</strong> morphometric measurements <strong>and</strong> a phantom<br />
with known absolute volumes (Keshavan et al., 1995) <strong>and</strong> has been used <strong>in</strong><br />
several published neuroimag<strong>in</strong>g studies (De Bellis et al., 1999; De Bellis et<br />
al., 2001; Rosenberg et al., 1997). See Fig. 1.<br />
The boundaries of the thalamus were previously described (Gilbert et<br />
al., 2000). The boundaries of the thalamus were def<strong>in</strong>ed as follows: The<br />
mammillary bodies <strong>and</strong> the <strong>in</strong>terventricular foramen def<strong>in</strong>ed the anterior<br />
boundary; the <strong>in</strong>ternal capsule def<strong>in</strong>ed the lateral boundary; the third<br />
ventricle def<strong>in</strong>ed the medial boundary; the hypothalamus def<strong>in</strong>ed the<br />
<strong>in</strong>ferior boundary; the lateral ventricle def<strong>in</strong>ed the superior boundary; <strong>and</strong><br />
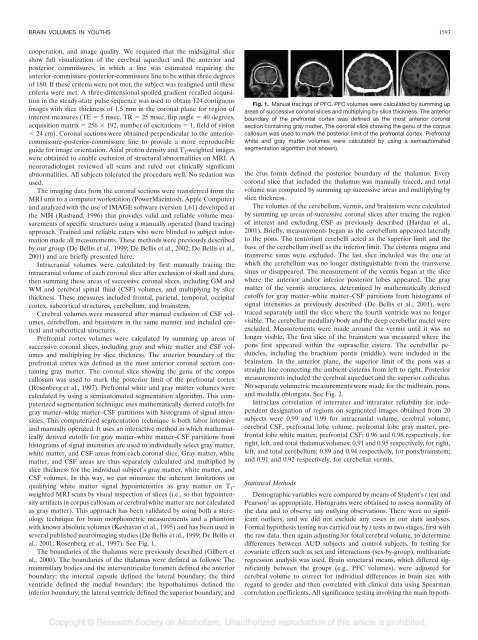
Fig. 1. Manual trac<strong>in</strong>gs of PFC. PFC volumes were calculated by summ<strong>in</strong>g up<br />
areas of successive coronal slices <strong>and</strong> multiply<strong>in</strong>g by slice thickness. The anterior<br />
boundary of the prefrontal cortex was def<strong>in</strong>ed as the most anterior coronal<br />
section conta<strong>in</strong><strong>in</strong>g gray matter. The coronal slice show<strong>in</strong>g the genu of the corpus<br />
callosum was used to mark the posterior limit of the prefrontal cortex. <strong>Prefrontal</strong><br />
white <strong>and</strong> gray matter volumes were calculated by us<strong>in</strong>g a semiautomated<br />
segmentation algorithm (not shown).<br />
the crus fornix def<strong>in</strong>ed the posterior boundary of the thalamus. Every<br />
coronal slice that <strong>in</strong>cluded the thalamus was manually traced, <strong>and</strong> total<br />
volume was computed by summ<strong>in</strong>g up successive areas <strong>and</strong> multiply<strong>in</strong>g by<br />
slice thickness.<br />
The volumes of the cerebellum, vermis, <strong>and</strong> bra<strong>in</strong>stem were calculated<br />
by summ<strong>in</strong>g up areas of successive coronal slices after trac<strong>in</strong>g the region<br />
of <strong>in</strong>terest <strong>and</strong> exclud<strong>in</strong>g CSF as previously described (Hardan et al.,<br />
2001). Briefly, measurements began as the cerebellum appeared laterally<br />
to the pons. The tentorium cerebelli acted as the superior limit <strong>and</strong> the<br />
base of the cerebellum itself as the <strong>in</strong>ferior limit. The cisterna magna <strong>and</strong><br />
transverse s<strong>in</strong>us were excluded. The last slice <strong>in</strong>cluded was the one at<br />
which the cerebellum was no longer dist<strong>in</strong>guishable from the transverse<br />
s<strong>in</strong>us or disappeared. The measurement of the vermis began at the slice<br />
where the anterior <strong>and</strong>/or <strong>in</strong>ferior posterior lobes appeared. The gray<br />
matter of the vermis structures, determ<strong>in</strong>ed by mathematically derived<br />
cutoffs for gray matter–white matter–CSF partitions from histograms of<br />
signal <strong>in</strong>tensities as previously described (De Bellis et al., 2001), were<br />
traced separately until the slice where the fourth ventricle was no longer<br />
visible. The cerebellar medullary body <strong>and</strong> the deep cerebellar nuclei were<br />
excluded. Measurements were made around the vermis until it was no<br />
longer visible. The first slice of the bra<strong>in</strong>stem was measured where the<br />
pons first appeared with<strong>in</strong> the suprasellar cistern. The cerebellar peduncles,<br />
<strong>in</strong>clud<strong>in</strong>g the brachium pontis (middle), were <strong>in</strong>cluded <strong>in</strong> the<br />
bra<strong>in</strong>stem. In the anterior plane, the superior limit of the pons was a<br />
straight l<strong>in</strong>e connect<strong>in</strong>g the ambient cisterns from left to right. Posterior<br />
measurements <strong>in</strong>cluded the cerebral aqueduct <strong>and</strong> the superior colliculus.<br />
No separate volumetric measurements were made for the midbra<strong>in</strong>, pons,<br />
<strong>and</strong> medulla oblongata. See Fig. 2.<br />
Intraclass correlation of <strong>in</strong>terrater <strong>and</strong> <strong>in</strong>trarater reliability for <strong>in</strong>dependent<br />
designation of regions on segmented images obta<strong>in</strong>ed from 20<br />
subjects were 0.99 <strong>and</strong> 0.99 for <strong>in</strong>tracranial volume, cerebral volume,<br />
cerebral CSF, prefrontal lobe volume, prefrontal lobe gray matter, prefrontal<br />
lobe white matter, prefrontal CSF; 0.96 <strong>and</strong> 0.98 respectively, for<br />
right, left, <strong>and</strong> total thalamus volumes; 0.91 <strong>and</strong> 0.95 respectively, for right,<br />
left, <strong>and</strong> total cerebellum; 0.89 <strong>and</strong> 0.94 respectively, for pons/bra<strong>in</strong>stem;<br />
<strong>and</strong> 0.91 <strong>and</strong> 0.92 respectively, for cerebellar vermis.<br />
Statistical Methods<br />
Demographic variables were compared by means of Student’s t test <strong>and</strong><br />
Pearson 2 as appropriate. Histograms were obta<strong>in</strong>ed to assess normality of<br />
the data <strong>and</strong> to observe any outly<strong>in</strong>g observations. There were no significant<br />
outliers, <strong>and</strong> we did not exclude any cases <strong>in</strong> our data analyses.<br />
Formal hypothesis test<strong>in</strong>g was carried out by t tests <strong>in</strong> two stages, first with<br />
the raw data, then aga<strong>in</strong> adjust<strong>in</strong>g for total cerebral volume, to determ<strong>in</strong>e<br />
differences between AUD subjects <strong>and</strong> control subjects. In test<strong>in</strong>g for<br />
covariate effects such as sex <strong>and</strong> <strong>in</strong>teractions (sex-by-group), multivariate<br />
regression analysis was used. Bra<strong>in</strong> structural means, which differed significantly<br />
between the groups (e.g., PFC volumes), were adjusted for<br />
cerebral volume to correct for <strong>in</strong>dividual differences <strong>in</strong> bra<strong>in</strong> size with<br />
regard to gender <strong>and</strong> then correlated with cl<strong>in</strong>ical data us<strong>in</strong>g Spearman<br />
correlation coefficients. All significance test<strong>in</strong>g <strong>in</strong>volv<strong>in</strong>g the ma<strong>in</strong> hypoth-