Prefrontal Cortex, Thalamus, and Cerebellar Volumes in ...
Prefrontal Cortex, Thalamus, and Cerebellar Volumes in ...
Prefrontal Cortex, Thalamus, and Cerebellar Volumes in ...

You also want an ePaper? Increase the reach of your titles
YUMPU automatically turns print PDFs into web optimized ePapers that Google loves.
BRAIN VOLUMES IN YOUTHS 1595<br />
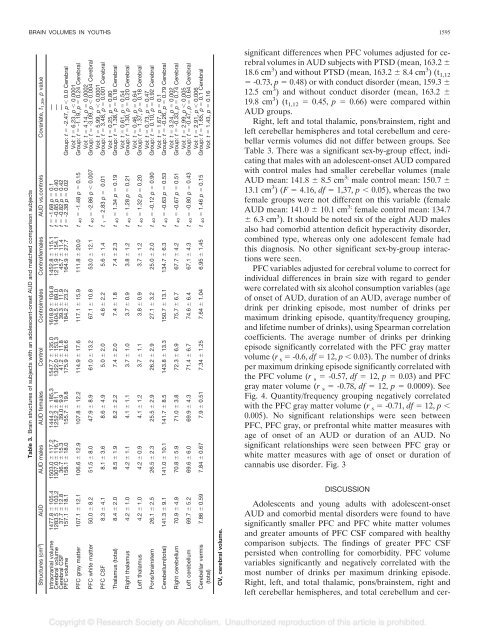
Table 3. Bra<strong>in</strong> structures of subjects with an adolescent-onset AUD <strong>and</strong> matched comparison subjects<br />
Structures (cm 3 ) AUD AUD males AUD females Control Controlmales Controlfemales AUD vs.controls Covariate, t 1,39, p value<br />
Intracranial volume 1477.8 � 105.4 1503.0 � 117.2 1444.2 � 185.3 1547.7 � 135.0 1618.9 � 104.8 1452.8 � 115.1 t � -1.68 p � 0.1 —<br />
Cerebral volume 1283.5 � 103.2 1307.0 � 116.7 1252.2 � 81.1 1322.0 � 153.3 1404.5 � 89.0 1211.9 � 154.1 t � -0.85 p � 0.40 —<br />
Cerebral CSF 37.7 � 12.8 36.7 � 15.3 39.0� 9.9 41.2 � 11.8 39.3 � 11.9 45.7 � 11.4 t � -0.82 p � 0.42 —<br />
PFC volume 157.1 � 18.1 158.1 � 18.0 155.7 � 19.8 175.9 � 26.6 184.2 � 23.2 164.9 � 27.7 t � -2.38 p � 0.02 Group: t � -2.47, p � 0.0 Cerebral<br />
Vol: t � 6.23, p � 0.0001<br />
PFC gray matter 107.1 � 12.1 106.6 � 12.9 107.8 � 12.2 114.9 � 17.6 117.1 � 15.9 111.8 � 20.0 t 40 � -1.48 p � 0.15 Group: t � -1.19, p � 0.24 Cerebral<br />
Vol: t � 4.14, p � 0.0002<br />
PFC white matter 50.0 � 8.2 51.5 � 8.0 47.9 � 8.9 61.0 � 13.2 67.1 � 10.8 53.0 � 12.1 t 40 � -2.86 p � 0.007 Group: t � -3.09, p � 0.004 Cerebral<br />
Vol: t � 5.99, p � 0.0001<br />
PFC CSF 8.3 � 4.1 8.1 � 3.6 8.6 � 4.9 5.0 � 2.0 4.6 � 2.2 5.6 � 1.4 t 1 � 2.83 p � 0.01 Group: t � 3.48, p � 0.001 Cerebral<br />
Vol: t � 0.25, p � 0.80<br />
<strong>Thalamus</strong> (total) 8.4 � 2.0 8.5 � 1.9 8.2 � 2.2 7.4 � 2.0 7.4 � 1.8 7.4 � 2.3 t 40 � 1.34 p � 0.19 Group: t � 1.38, p � 0.18 Cerebral<br />
Vol: t � 0.61, p � 0.54<br />
Right thalamus 4.2 � 1.0 4.2 � 1.1 4.1 � 1.1 3.7 � 1.0 3.7 � 0.9 3.8 � 1.2 t 40 � 1.28 p � 0.21 Group: t � 1.30, p � 0.20 Cerebral<br />
Vol: t � 0.46, p � 0.64<br />
Left thalamus 4.2 � 1.0 4.2 � 0.9 4.1 � 1.2 3.7 � 1.1 3.8 � 0.9 3.7 � 1.2 t 40 � 1.32 p � 0.20 Group: t � 1.37, p � 0.18 Cerebral<br />
Vol: t � 0.73, p � 0.47<br />
Pons/bra<strong>in</strong>stem 26.1 � 2.5 26.5 � 2.3 25.5 � 2.9 26.2 � 2.9 27.1 � 3.2 25.0 � 2.0 t 40 � -0.12 p � 0.90 Group: t � 0.10, p � 0.92 Cerebral<br />
Vol: t � 1.67, p � 0.1<br />
Cerebellum(total) 141.3 � 9.1 141.0 � 10.1 141.7 � 8.5 143.8 � 13.3 150.7 � 13.1 134.7 � 6.3 t 40 � -0.63 p � 0.53 Group: t � -0.26, p � 0.79 Cerebral<br />
Vol: t � 3.24, p � 0.002<br />
Right cerebellum 70.9 � 4.9 70.8 � 5.9 71.0 � 3.8 72.3 � 6.9 75.7 � 6.7 67.7 � 4.2 t 40 � -0.67 p � 0.51 Group: t � -0.33, p � 0.74 Cerebral<br />
Vol: t � 2.99, p � 0.005<br />
Left cerebellum 69.7 � 5.2 69.6 � 6.0 69.9 � 4.3 71.4 � 6.7 74.6 � 6.4 67.1 � 4.3 t 40 � -0.80 p � 0.43 Group: t � -0.47, p � 0.64 Cerebral<br />
Vol: t � 2.91, p � 0.006<br />
<strong>Cerebellar</strong> vermis 7.86 � 0.59 7.84 � 0.67 7.9 � 0.51 7.34 � 1.25 7.64 � 1.04 6.95 � 1.45 t 40 � 1.46 p � 0.15 Group: t � 1.65, p � 0.1 Cerebral<br />
(total)<br />
Vol: t � 1.43, p � 0.16<br />
CV, cerebral volume.<br />
significant differences when PFC volumes adjusted for cerebral<br />
volumes <strong>in</strong> AUD subjects with PTSD (mean, 163.2 �<br />
18.6 cm 3 ) <strong>and</strong> without PTSD (mean, 163.2 � 8.4 cm 3 )(t 1,12<br />
� -0.73, p � 0.48) or with conduct disorder (mean, 159.3 �<br />
12.5 cm 3 ) <strong>and</strong> without conduct disorder (mean, 163.2 �<br />
19.8 cm 3 )(t 1,12 � 0.45, p � 0.66) were compared with<strong>in</strong><br />
AUD groups.<br />
Right, left <strong>and</strong> total thalamic, pons/bra<strong>in</strong>stem, right <strong>and</strong><br />
left cerebellar hemispheres <strong>and</strong> total cerebellum <strong>and</strong> cerebellar<br />
vermis volumes did not differ between groups. See<br />
Table 3. There was a significant sex-by-group effect, <strong>in</strong>dicat<strong>in</strong>g<br />
that males with an adolescent-onset AUD compared<br />
with control males had smaller cerebellar volumes (male<br />
AUD mean: 141.8 � 8.5 cm 3; male control mean: 150.7 �<br />
13.1 cm 3 )(F � 4.16, df � 1,37, p � 0.05), whereas the two<br />
female groups were not different on this variable (female<br />
AUD mean: 141.0 � 10.1 cm 3; female control mean: 134.7<br />
� 6.3 cm 3 ). It should be noted six of the eight AUD males<br />
also had comorbid attention deficit hyperactivity disorder,<br />
comb<strong>in</strong>ed type, whereas only one adolescent female had<br />
this diagnosis. No other significant sex-by-group <strong>in</strong>teractions<br />
were seen.<br />
PFC variables adjusted for cerebral volume to correct for<br />
<strong>in</strong>dividual differences <strong>in</strong> bra<strong>in</strong> size with regard to gender<br />
were correlated with six alcohol consumption variables (age<br />
of onset of AUD, duration of an AUD, average number of<br />
dr<strong>in</strong>k per dr<strong>in</strong>k<strong>in</strong>g episode, most number of dr<strong>in</strong>ks per<br />
maximum dr<strong>in</strong>k<strong>in</strong>g episode, quantity/frequency group<strong>in</strong>g,<br />
<strong>and</strong> lifetime number of dr<strong>in</strong>ks), us<strong>in</strong>g Spearman correlation<br />
coefficients. The average number of dr<strong>in</strong>ks per dr<strong>in</strong>k<strong>in</strong>g<br />
episode significantly correlated with the PFC gray matter<br />
volume (r s � -0.6, df � 12, p � 0.03). The number of dr<strong>in</strong>ks<br />
per maximum dr<strong>in</strong>k<strong>in</strong>g episode significantly correlated with<br />
the PFC volume (r s � -0.57, df � 12, p � 0.03) <strong>and</strong> PFC<br />
gray mater volume (r s � -0.78, df � 12, p � 0.0009). See<br />
Fig. 4. Quantity/frequency group<strong>in</strong>g negatively correlated<br />
with the PFC gray matter volume (r s � -0.71, df � 12, p �<br />
0.005). No significant relationships were seen between<br />
PFC, PFC gray, or prefrontal white matter measures with<br />
age of onset of an AUD or duration of an AUD. No<br />
significant relationships were seen between PFC gray or<br />
white matter measures with age of onset or duration of<br />
cannabis use disorder. Fig. 3<br />
DISCUSSION<br />
Adolescents <strong>and</strong> young adults with adolescent-onset<br />
AUD <strong>and</strong> comorbid mental disorders were found to have<br />
significantly smaller PFC <strong>and</strong> PFC white matter volumes<br />
<strong>and</strong> greater amounts of PFC CSF compared with healthy<br />
comparison subjects. The f<strong>in</strong>d<strong>in</strong>gs of greater PFC CSF<br />
persisted when controll<strong>in</strong>g for comorbidity. PFC volume<br />
variables significantly <strong>and</strong> negatively correlated with the<br />
most number of dr<strong>in</strong>ks per maximum dr<strong>in</strong>k<strong>in</strong>g episode.<br />
Right, left, <strong>and</strong> total thalamic, pons/bra<strong>in</strong>stem, right <strong>and</strong><br />
left cerebellar hemispheres, <strong>and</strong> total cerebellum <strong>and</strong> cer-