Thermal Performance of Engineered Assemblies Thermal Clips
Thermal Performance of Engineered Assemblies Thermal Clips
Thermal Performance of Engineered Assemblies Thermal Clips

Create successful ePaper yourself
Turn your PDF publications into a flip-book with our unique Google optimized e-Paper software.
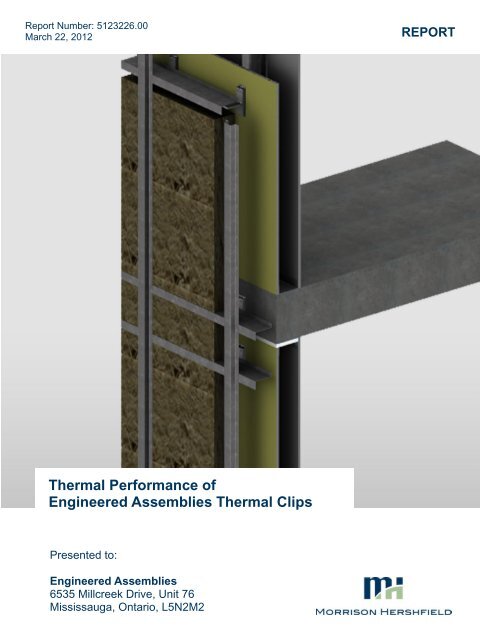
Report Number: 5123226.00March 22, 2012REPORT<strong>Thermal</strong> <strong>Performance</strong> <strong>of</strong><strong>Engineered</strong> <strong>Assemblies</strong> <strong>Thermal</strong> <strong>Clips</strong>Presented to:<strong>Engineered</strong> <strong>Assemblies</strong>6535 Millcreek Drive, Unit 76Mississauga, Ontario, L5N2M2
TABLE OF CONTENTSPage1. INTRODUCTION 12. MODELING PROCEDURES 13. THERMAL ANALYSIS 13.1 Clear Field <strong>Thermal</strong> <strong>Performance</strong> 13.2 Slab Edge Linear Transmittance 23.3 Impact <strong>of</strong> Batt Insulation in Steel Stud Cavity 34. SENSITIVITY ANALYSIS 54.1 Insulation Type 54.2 Clip Spacing 65. BUILDING ENVELOPE REQUIREMENTS IN CANADA 76. CONCLUSION 10APPENDIX A – CLIP SYSTEM DETAILS AND MATERIAL PROPERTIESAPPENDIX B – ASHRAE 1365-RP METHODOLOGYAPPENDIX C – EFFECTIVE ASSEMBLY R-VALUESAPPENDIX D – EXAMPLE SIMULATED TEMPERATURE DISTRIBUTIONA1B1C1D1
- 1 -1. INTRODUCTIONThe <strong>Engineered</strong> <strong>Assemblies</strong> <strong>Thermal</strong> Clip System is an aluminum thermal clip system forattaching rain-screen cladding systems for steel stud wall assemblies with exteriorinsulation. Morrison Hershfield was contracted by <strong>Engineered</strong> <strong>Assemblies</strong> Inc. (E.A.I) toprovide an overview <strong>of</strong> the energy codes in the major markets in Canada and evaluate thethermal performance <strong>of</strong> their thermal clip system for various scenarios.The aluminum clips are connected to horizontal and vertical sub-girts that support rainscreenpanel cladding. The clips are attached to a steel stud back-up wall. <strong>Thermal</strong> breaksare provided at the connection between the sub-girt and clips via a cork/neoprene pad andbetween the clips and exterior sheathing via an aerogel insulation pad. A summary <strong>of</strong> thecomponents for the evaluated system follows and detailed drawings can be found inAppendix A.2. MODELING PROCEDURESModeling was done using the Nx s<strong>of</strong>tware package from Siemens, which is a generalpurpose computer aided design (CAD) and finite element analysis (FEA) package. Thethermal solver and modeling procedures utilized for this study were extensively calibratedand validated for ASHRAE Research Project 1365-RP “<strong>Thermal</strong> <strong>Performance</strong> <strong>of</strong> BuildingEnvelope Details for Mid- and High-Rise Construction (1365-RP) 1 . The thermaltransmittance (U-Value) or “effective R-value” was determined using the methodologypresented in 1365-RP and is summarized in Appendix B.3. THERMAL ANALYSISThe following section provides U-Value results for both the clear field area and an assemblyincluding a typical floor slab detail. For effective assembly R-Values please see Appendix C.3.1 Clear Field <strong>Thermal</strong> <strong>Performance</strong>Three clear field assemblies were evaluated; the T100, T125 and T150 clip systems, whichaccommodate 4”, 5”, and 6” <strong>of</strong> exterior insulation respectively. Drawings for these systems,including dimensions and material properties are shown in Appendix A.Each <strong>of</strong> these systems was modeled for three vertical clip spacings and girt/sub girtarrangements as summarized in Table 1. The spacings are based on structural loadinginformation provided by <strong>Engineered</strong> <strong>Assemblies</strong> Inc. Semi-rigid mineral wool, R-4.2 per inch(RSI-0.74 per 25 mm), was modeled outboard the exterior sheathing with 90 mm steel studsin the back-up wall spaced at 16” o.c.. A sensitivity analysis using other insulation types canbe found in section 4 <strong>of</strong> this report. Table 2 shows the clear field U-values <strong>of</strong> the three clipsystems and clip/girt spacing arrangements (Effective R-values are given in Table C.1). Thehorizontal spacing for the clips is always 16” o.c., since the clips are attached to the steelstuds.1 http://www.morrisonhershfield.com/ashrae1365research/Pages/Insights-Publications.aspx
- 2 -StructuralLoadingScenarioTable 1: Horizontal Girt and Vertical Girt SpacingVerticalSpacing <strong>of</strong><strong>Clips</strong> (Inches)Horizontal GirtSpacing (In)Vertical GirtSpacing(Inches)+/- 25 psf 48 48 23.5+/- 35 psf 41 41 20.5+/- 45 psf 34 34 17.5Table 2: Clear Field <strong>Thermal</strong> TransmittanceClipSystemExteriorInsulationNominal R-Valuehr·ft 2·oF/BTU(m 2 K/W)34” VerticalClip SpacingAssembly U-ValueBTU/hr·ft 2·oF (W/m 2 K)41” VerticalClip Spacing48” VerticalClip SpacingT100 16.8 (3.0) 0.061 (0.346) 0.059 (0.336) 0.058 (0.329)T125 21.0 (3.7) 0.051 (0.288) 0.049 (0.278) 0.048 (0.272)T150 25.2 (4.4) 0.044 (0.251) 0.042 (0.241) 0.041 (0.235)The “effective R-value” <strong>of</strong> the clip systems are over 80% effective compared to the assemblynominal thermal resistance for all the clip systems. As with all systems with thermal bridging,the assembly is less effective with increasing insulation, but the diminishing returns is minor.The results show that increasing the vertical spacing from 34 to 48 inches results in no morethan a 7% reduction in the U-value (R-1.7 gain).The vertical girts were spaced at specific intervals as determined by the structural loading.However, the difference in positioning <strong>of</strong> the vertical girts between 15 to 25 inches for any <strong>of</strong>the scenarios has negligible effect on the overall thermal performance (less than 1%).The temperature distribution for the T125 system at the horizontal sub-girt spaced at 41inches is found in Appendix C. The absolute values are presented using temperatureindices as defined in Appendix B.3.2 Slab Edge Linear TransmittanceThe slab edge detail evaluated for the thermal clip system has aluminum clips fastened tothe slab and directly beneath the slab fastened to the steel stud wall. Drawings for this detailshowing dimensions and material properties are found in Appendix A.The slab edge detail was modeled in the same manner as the previous section for threeclip/girt arrangements. Table 3 summarizes the thermal performance values for a 9 foot floor
- 3 -to ceiling height (and 8 inch slab), including the effects <strong>of</strong> the slab edge detail for each clipsystem. Effective R-Values are given in Table C.2. Linear transmittance values are alsoprovided, which allow the overall U-value to be calculated for any floor to ceiling height.More information on utilizing linear transmittance is provided in Appendix A.The slab edge detail increases the overall U-value by approximately 10% (an R-2.4reduction) compared to the clear field U-value for a 9 foot floor to ceiling height.The linear transmittance values are not significantly impacted by the vertical clip spacing (at34 inches, the clips are well isolated from the slab); therefore a single linear transmittancecan represent any vertical clip spacing. There is a slight increase in linear transmittancefrom the T100 to T125 clip systems but none between the T125 to T150 systems. Thiseffect was also evident in the slab edge details analyzed for 1365-RP and is discussed indetail in the final report. This is due to more heat flowing through the slab with increasinginsulation levels up to maximum point It is reasonable to assign a single lineartransmittance value <strong>of</strong> 0.04 BTU/hr·ft·oF(W/m K) to the slab edge for the thermal clipsystems because the differences do not equate to significant difference is overall thermalperformance. The temperature distribution for the T125 system with a 41 inch clip/girtspacing for the modeled slab edge detail can be found in Appendix D.Table 3: Overall <strong>Thermal</strong> Transmittance including the effects <strong>of</strong> an insulated slab edge for 9foot floor to ceiling heightClipSystemExteriorInsulationNominalR-Valuehr·ft 2·oF/BTU (m 2 K/W)Assembly U-Value with Slab EdgeBTU/hr·ft 2·oF (W/m 2 K)34”VerticalSpacing41”VerticalSpacing48”VerticalSpacingΨSlab EdgeLinearTransmittanceBTU/hr·ft·oF(W/mK)T100 16.8 (2.96)0.064(0.364)0.062(0.354)0.061(0.346)0.029 (0.050)T125 21.0 (3.70)0.055(0.312)0.053(0.303)0.052(0.297)0.041 (0.070)T150 25.2 (4.44)0.048(0.275)0.047(0.266)0.046(0.259)0.041 (0.070)3.3 Impact <strong>of</strong> Batt Insulation in Steel Stud CavityThe stud cavities did not have any insulation in the scenarios presented in the previoussections. The impact adding R-12 batt insulation to the stud cavity was analyzed for theclear wall scenarios presented in section 3.1. The thermal transmittance values aresummarized in Table 4. Effective R-values are given in Table C.3.
- 4 -Table 4: Clear Field <strong>Thermal</strong> Transmittance with Batt Insulation in the Stud CavityClipSystemExteriorInsulationNominal R-Valuehr·ft 2·oF/BTU(m 2 K/W)Assembly U-Value with interiorinsulation34” VerticalSpacingBTU/hr·ft 2·oF (W/m 2 K)41” VerticalSpacing48” VerticalSpacingT100 16.8 (2.96)0.045(0.258)0.044(0.253)0.044(0.249)T125 21.0 (3.70)0.040(0.225)0.039(0.220)0.038(0.215)T150 25.2 (4.44)0.036(0.202)0.035(0.196)0.034(0.191)Adding batt insulation to the stud steel cavity is <strong>of</strong>ten considered for during the design basedon design constraints (cost or overall thickness) to meet specific building envelope thermaltransmittance targets. However, adding batt insulation in the stud cavity is not as effectiveas adding insulation to the exterior for a clip system and the condensation resistance <strong>of</strong> theassembly will be greatly reduced. Table 5 summarizes the temperature indices (seeappendix B) for the three clip systems with and without batt insulation in the stud cavity for41” clip spacing. The significance <strong>of</strong> this is that split insulated assemblies have marginalcondensation resistance compared to fully exterior insulated assembly 2 . The temperaturedistribution pr<strong>of</strong>ile for the T125 system with a 41 inch clip/girt spacing with R-12 battinsulation in the steel stud cavity is found in Appendix D.Table 5: Minimum temperature indices for interior face <strong>of</strong> sheathing, with and without battfor 41” clip spacingClipSystemWithout BattInsulationWith BattInsulationT100 0.81 0.57T125 0.83 0.64T150 0.84 0.692 A thorough discussion on how to evaluate condensation resistance using temperature indices isavailable upon request
- 5 -4. SENSITIVITY ANALYSISA sensitivity analysis <strong>of</strong> the modeled systems was performed to allow designers tointerpolate the thermal performance values for others insulation levels and clip spacing.4.1 Insulation TypeThe base modeling assumed semi-rigid insulation (R 4.2 / inch) for the exterior insulation.Other conductivities were evaluated to allow the thermal transmittance values for thethermal clip system to be utilized for other types <strong>of</strong> insulation. In order to characterize therange <strong>of</strong> exterior insulation values, the modeled assemblies in section 3.1 were recalculatedusing a low end <strong>of</strong> R-3.5 per inch (RSI-0.62 per inch) to a high end <strong>of</strong> R-6.5 perinch (RSI-1.14 per inch). Figure 1 shows the graphical results for effective assembly R-Value for a clip spacing <strong>of</strong> 41 inch for the varying R-per inch materials. The case <strong>of</strong>continuous exterior insulation as assumed in energy standard ASHRAE 90.1-2007 is alsographed as a reference.Effective Assembly R-Value (hr∙ft 2 ∙ o F/BTU)45.040.035.030.025.020.015.010.05.00.00.0 10.0 20.0 30.0 40.0Nominal R-Value <strong>of</strong> Exterior Insulation (hr∙ft 2 ∙ o F/BTU)R-3.5 per inchR- 4.2 per inchR- 6.5 per inch Continuous InsulationFigure 1: Effective Assembly R-Value vs Nominal Insulation R-Value for avariety <strong>of</strong> insulation materials for 41 in clip spacingThe results show that the thickness <strong>of</strong> the insulation (and length <strong>of</strong> the clip) for a givennominal thermal resistance is largely independent <strong>of</strong> the effective R-value. Therefore, theresults can be characterized by the R-value <strong>of</strong> the exterior insulation and can be applied toany material. The results from Table 2 can be re-arranged and additional R-values can beinterpolated with the results from the sensitivity analysis. The U-value results are presentedin Table 6. Effective R-Values are given in Table C.4.
- 7 -5. BUILDING ENVELOPE REQUIREMENTS INCANADAFor most provinces, the National Building Code <strong>of</strong> Canada is used as the basis for theirrespective building codes, with changes and implementations tailored for each province. Forsingle family or low-rise (Part 9) buildings, provincial codes typically have their requirementsfor building envelope minimum insulation levels, however, for commercial or mid and highrise construction (non Part 9), many codes reference existing standards from national andinternational organizations. In regards to the building envelope, the most commonlyreferenced standards across Canada are ASHRAE 90.1 “Energy Standard for BuildingsExcept Low-Rise Residential Buildings” and the Model National Energy Code for Buildings(MNECB) 1997. The National Energy Code for Buildings (NECB) 2011 has recently beenissued to replace MNECB 1997; however it has not yet been adopted by any authority.While these two standards differ in their specific requirements, they both employ threeoptions for showing compliance: Prescriptive, Trade-<strong>of</strong>f and <strong>Performance</strong>.The prescriptive path awards compliance for explicitly meeting all provisions <strong>of</strong> the coderelevant to the project in question. For the building envelope, assemblies must be lowerthan a given maximum thermal transmittance U-value or must meet or exceed insulationvalues in a prescribed assembly. These requirements can be based on climate region,building type/principal heating source and framing type, depending on the standard. Theprescriptive path is widely used as it is fairly straight forward and building components needonly be assessed individually. However, some <strong>of</strong> the prescriptive requirements may bedifficult to achieve due to design trends. For example, in ASHRAE 90.1-2007, theprescriptive path requires a glazing to wall ratio <strong>of</strong> less than 40%. If these prescriptiverequirements cannot be met, then another compliance path must be used.The trade-<strong>of</strong>f path allows for projects to trade-<strong>of</strong>f the performance <strong>of</strong> building envelopecomponents (i.e. ro<strong>of</strong>s, walls, and windows) when the prescriptive requirements are not metfor each and every item. With this approach, the performance <strong>of</strong> some envelopecomponents may be lower than the prescribed values in the standard as long as othercomponents exceed the requirements so that the overall building envelope is deemed to beequal or better than the standard. For example, this allows for low thermally performing wallsif the ro<strong>of</strong> sufficiently compensates above its prescriptive values. The trade-<strong>of</strong>f methodallows for some flexibility with the prescriptive values. This approach can be demonstratedusing either specific calculations (provided in the standards) or through computer s<strong>of</strong>twarethat is typically provided by the authors <strong>of</strong> the standard.The performance path requires an evaluation <strong>of</strong> the annual energy use <strong>of</strong> the wholebuilding. This must be done using computer simulation, where the proposed building and itssystems are modeled and compared to a compliance building. The compliance buildingcontains the same shape, size, occupancy and scheduling <strong>of</strong> proposed building, but all <strong>of</strong> itssystems and individual components meet the minimum requirements <strong>of</strong> the standard. Forexample, for the compliance building, the thermal performance <strong>of</strong> the walls <strong>of</strong> thecompliance building must match the prescriptive U-values <strong>of</strong> the standard. The proposeddesign is acceptable if the annual energy use is less than or equal to that <strong>of</strong> the compliancebuilding. Energy certification programs, such as Leadership in Energy and EnvironmentalDesign (LEED), have used MNECB and ASHRAE performance paths as this can allow for
- 8 -much greater flexibility in design. The performance path takes into account other variablessuch as building orientation, higher efficiency HVAC systems and lighting controls, whichwould not give any benefit with the other two compliance paths. Each standard givesrequirements that specify what can and cannot be included with the energy model andwhich energy modeling programs can be used.The Ontario Building Code (OBC) contains a supplementary standard SB-10 to deal withenergy in non-Part 9 buildings. As <strong>of</strong> January 1st, 2012, SB-10 incorporates ASHRAE 90.1-2010; however the prescriptive path is modified by including the values from ASHRAE 189.1“Standard for the Design <strong>of</strong> High <strong>Performance</strong>, Green Buildings” for envelope requirements.For the performance path, compliance can be achieved by modeling energy savings 5%better than ASHRAE 90.1-2010, 25% better than MNECB 1997 or meeting ASHRAE 90.1-2010 modified by ASHRAE 189.1.Currently, both the Alberta Building Code (ABC) and the Quebec Construction Code (CCQ)only have prescriptive values for minimum insulation levels in Part 9 buildings; however itdoes not contain any requirements for non Part 9 buildings. It is our understanding that bothprovinces are considering adopting NECB 2011 in order to assist in meeting their energyefficiency targets.In British Columbia there are two governing documents. The majority <strong>of</strong> the province fallsunder the British Columbia Building Code (BCBC), while Vancouver follows the VancouverBuilding Bylaw (VBBL). For non-Part 9 buildings, BCBC references ASHRAE 90.1-2004,while VBBL references the more recent ASHRAE 90.1-2007. The 90.1-2007 requirementsare more stringent than 90.1-2004 (lower allowable glazing ratios, lower U-values, higherefficiency systems etc.), however the approach remains the same. Currently, there is debatewhether BCBC should adopt a more recent ASHRAE 90.1 standard, either 2007 or 2010. Ifeither case happens, VBBL will also update to 2010.Below is a summary <strong>of</strong> the prescriptive wall assembly requirements from ASHRAE 90.12004, 2007 and 2010 for steel framed buildings along with wall assembly requirements fromNECB 2011. Canadian climate zones in both ASHRAE and NECB are divided by heatingdegree days (HDD). NECB divides zones every 1000 HDD, however ASHRAE groupsclimate zones by 1000 or 2000 HDD. Both zone types are included.
- 9 -ASHRAEClimateZoneNECBClimateZonesHeatingDegreeDays(HDD)ASHRAE90.1-2004Maximum Assembly U-ValueBTU/hr∙ft 2 ∙ o F (W/m 2 K)ASHRAE90.1-2007ASHRAE90.1-2010NECB-20114C 4 < 30000.084(0.477)0.064(0.363)0.064(0.363)0.055(0.315)5A, 5B and5C5 3000-40000.084(0.477)0.064(0.363)0.064(0.363)0.049(0.278)6A, 6B 6 4000-50000.084(0.477)0.064(0.363)0.064(0.363)0.044(0.247)77A 5000-60007B 6000-70000.064(0.363)0.064(0.363)0.064(0.363)0.064(0.363)0.064(0.363)0.064(0.363)0.037(0.210)0.037(0.210)8 8 >70000.064(0.363)0.064(0.363)0.064(0.363)0.032(0.183)ASHRAE 90.1 tends to be updated every 3 years. From this chart, it can be seen that thetrend from 2004-2007 was to decrease the maximum U-value. The decrease in U-valueappears to be based on increasing the amount <strong>of</strong> continuous exterior insulation. Adjustingthe building envelope prescriptive requirements does not happen with every cycle (2007-2010 did not see further decreases to U-value); however ASHRAE 90.1 may choose to doso in the future as other standards, such as NECB 2011, already have more stringentprescriptive requirements.Moving forward, to achieve realistic thermal performance goals, standards will need to beginto account for thermal bridging in details. Currently, many codes in Canada <strong>of</strong>fer exemptionsfor the thermal effects <strong>of</strong> details (such as slab edges) or their inclusion is <strong>of</strong>ten left tointerpretation by designers. For example, in the ASHRAE 90.1 performance path, slabedges can be ignored as long as they are less than 5% <strong>of</strong> the wall area. Depending on thedetail, these thermal bridges can have a major impact on the thermal performance <strong>of</strong> thebuilding envelope. With increased awareness <strong>of</strong> heat flow from/through details, standardswill likely move towards adding prescriptive and performance requirements to thoroughlydeal with thermal bridging.
- 10 -6. CONCLUSIONFrom this report, the following conclusions can be made:• For mineral wool insulation and the modeled thickness and clip spacing, the clipsystem assembly U-values range between 0.041 BTU/hr∙ft 2 ∙ o F - 0.061 BTU/hr∙ft 2 ∙ o F(0.235 W/m 2 K - 0.346 W/m 2 K).• With the inclusion <strong>of</strong> the proposed slab edge, the wall U-value is increased by, atmost, 10% for the same range <strong>of</strong> clip size and spacing.• With the inclusion <strong>of</strong> interior R-12 batt, the clear wall thermal resistance gainsapproximately an effective R-5.5.• From the sensitivity analysis there is negligible effect <strong>of</strong> the insulation type onthermal resistance with the same the nominal R-value <strong>of</strong> the insulation. The resultscan be used for any type <strong>of</strong> insulation as long as the nominal R-value is known.• The clip spacing has a small effect on the thermal performance under 41”. Higherthan 41”, the increase in thermal resistance is minor.In terms <strong>of</strong> code compliance, the values given in this report can be used with all threecompliance paths. For designers who are concerned with energy efficiency, beyondcompliance, or as building codes change to include thermal bridging in details, the slab edgetransmittance provided will assist in calculating a more accurate thermal performance <strong>of</strong> thebuilding envelope.Morrison HershfieldNeil Norris, M.A.Sc.Building Science ConsultantPatrick Roppel, P.Eng.Associate, Building Science Specialist
APPENDIX A – CLIP SYSTEM DETAILS ANDMATERIAL PROPERTIES
<strong>Engineered</strong><strong>Assemblies</strong> ClipSystemClear Wall AssemblyComponentThicknessInches (mm)ConductivityBTU/hr ·ft· o F (W/mK)Nominal Resistancehr· ft 2· o F/BTU (m 2 K/W)Interior Film - - R-0.7 (RSI-0.12)Gypsum Board ½” (13) 0.09 (0.16) R-0.5 (RSI-0.08)Air in Stud Cavity 3 5/8” (92) - R-0.9 (RSI-0.16)3 5/8” x 1 5/8” SteelStuds18 gauge 36 (62) -Exterior Sheathing ½” (13) 0.10 (0.16) R-0.5 (RSI-0.08)Exterior Insulation4” to 6”R-16.8 to R-25.20.020 (0.034)(Mineral Wool)(102 to 152)(RSI-2.96 to RSI-4.44)Aluminum Clip1/5” to 3/8”(5 to10)92 (160) -Aerogel 3/8” (10) 0.01(0.015) R-3.9 (RSI-0.68)Bolts 5/6”D (8D) 29(50) -Cork/Neoprene pad 1/16” (1.5) 0.033 (0.058) R-0.15 (RSI-0.03)Horizontal/Vertical Girt 18 gauge 36 (62) -Generic Cladding with ½” (13mm) vented air space is incorporated into exterior heattransfer coefficientExterior Film - - R-0.7 (RSI-0.12)
Alternate Insulation ValuesThickness Conductivity Nominal ResistanceComponentInches (mm) BTU/hr ·ft· o F (W/mK) hr· ft 2· o F/BTU (m 2 K/W)R-12 Batt Insulation 3 5/8” (92) 0.025 (0.044) R-12.0 (RSI-2.11)4” to 6”R-14.0 to R-21.0EPS0.024 (0.041)(102 to 152)(RSI-2.47 to RSI-3.70)Sprayfoam4” to 6”(102 to 152)0.013 (0.022)R-26.0 to R-39.0(RSI-4.58 to RSI-6.87)
<strong>Engineered</strong><strong>Assemblies</strong> ClipSystemSlab Edge DetailComponentThicknessInches (mm)ConductivityBTU/hr ·ft· o F (W/mK)Interior Film - -Nominal Resistancehr· ft 2· o F/BTU (m 2 K/W)R-0.6 to R-0.9(RSI-0.11 to RSI-0.16)Gypsum Board ½” (13) 0.09 (0.16) R-0.5 (RSI-0.08)Air in Stud Cavity 3 5/8” (92) - R-0.9 (RSI-0.16)3 5/8” x 1 5/8” SteelStuds18 gauge 36 (62) -Exterior Sheathing ½” (13) 0.10 (0.16) R-0.5 (RSI-0.08)Exterior Insulation4” to 6”R-16.8 to R-25.20.020 (0.034)(Mineral Wool)(102 to 152)(RSI-2.96 to RSI-4.44)Aluminum Clip1/5” to 3/8”(5 to10)92 (160) -Aerogel 3/8” (10) 0.01(0.015) R-3.9 (RSI-0.68)Bolts 5/6”D (8D) 29(50) -Cork/Neoprene pad 1/16” (1.5) 0.033 (0.058) R-0.15 (RSI-0.03)Horizontal/Vertical Girt 18 gauge 36 (62) -Generic Cladding with ½” (13mm) vented air space is incorporated into exterior heattransfer coefficientConcrete Slab 8 (203) 1.04 (1.8) -Exterior Film - - R-0.7 (RSI-0.12)
APPENDIX B – ASHRAE 1365-RP METHODOLOGY
B.1 General Modeling ApproachFor this report, a steady-state conduction model was used. Air cavities were assumed to havean effective thermal conductivity which includes the effects <strong>of</strong> cavity convection. Interior/exteriorair films were taken from Table 1, p. 26.1 <strong>of</strong> 2009 ASHRAE Handbook – Fundamentsdepending on surface orientation. From the calibration in 1365-RP, contact resistances betweenmaterials were modeled. The temperature difference between interior and exterior was modeledas a dimensionless temperature index between 0 and 1 (see Appendix B.3). These values,along with other modeling parameters, are given in ASHRAE 1365-RP, Chapter 5.B.2 <strong>Thermal</strong> TransmittanceThe methodology presented in ASHRAE 1365-RP separates the thermal performance <strong>of</strong>assemblies and details in order to simplify heat loss calculations. For the assemblies, acharacteristic area is modeled and the heat flow through that area is found. To find the effects <strong>of</strong>thermal bridges in details (such as slab edges), the assembly is modeled with and without thedetail. The difference in heat loss between the two models is then prescribed to that detail. Thisallows the thermal transmittances to be divided into three categories: clear field, linear and pointtransmittances.The clear field transmittance is the heat flow from the wall or ro<strong>of</strong> assembly, including uniformlydistributed thermal bridges that are not practical to account for on an individual basis, such asstructural framing, brick ties and cladding supports. This is treated the same as in standardpractice, defined as a U-value, Uo (heat flow per area). For a specific area <strong>of</strong> opaque wall, thiscan be converted into an overall heat flow per temperature difference, Qo.The linear transmittance is the additional heat flow caused by details that can be defined by acharacteristic length, L. This includes slab edges, corners, parapets, and transitions betweenassemblies. The linear transmittance is a heat flow per length, and is represented by psi (Ψ).The point transmittance is the heat flow caused by thermal bridges that occur only at single,infrequent locations. This includes building components such as pipe penetrations andintersections between linear details. The point transmittance is a single additive amount <strong>of</strong> heat,represented by chi (χ).With these thermal quantities the overall heat flow can be found simple by adding all thecomponents together, as given in equation 1.thermalbri dgeoL QoQ Q Q EQ 1Equation 1 gives the overall heat flow for a given building size. For energy modeling, orcomparisons to standards and codes, <strong>of</strong>ten it is more useful to present equation 1 as a heat flowper area. Knowing that the opaque wall area is A total , and U=Q/At otal , equation 2 can be derived.U L ATotalUoEQ 2
Since the linear and point transmittances are simply added amounts <strong>of</strong> heat flow, they can beindividually included or excluded depending on design requirements. The clear field analysis forR100, R125 and R150 clip systems is shown in Section 3.1. The linear transmittance analysisfor the <strong>Engineered</strong> <strong>Assemblies</strong> clip system slab edge detail is shown in Section 3.2. For thisreport, no point transmittance details were analyzed.B.2 Temperature IndexFor condensation concerns, the thermal model can also provide surface temperatures <strong>of</strong>assembly components to help locate potential areas <strong>of</strong> risk. In order to be applicable for anyclimate (varying indoor and outdoor temperatures), the temperatures can been nondimensionalizedinto a temperature index, T i , as shown below in Equation 3.EQ 3The index is the ratio <strong>of</strong> the surface temperature relative to the interior and exteriortemperatures. The temperature index has a value between 0 and 1, where 0 is the exteriortemperature and 1 is the interior temperature. If T i is known, Equation 3 can be rearranged forT surface .Example temperature pr<strong>of</strong>iles for the assemblies and details modeled in this report are shown inAppendix C.
APPENDIX C – EFFECTIVE ASSEMBLY R-VALUES
C1. Clear Field <strong>Thermal</strong> <strong>Performance</strong>Table C.1: Clear Field Effective Assembly R-ValuesClipSystemExteriorInsulationNominal R-Valuehr∙ft 2 ∙ o F/BTU(m 2 K/W)34” VerticalClip SpacingAssembly Effective R-Valuehr∙ft 2 ∙ o F/BTU (m 2 K/W)41” VerticalClip Spacing48” VerticalClip SpacingT100 16.8 (3.0) 16.4 (2.89) 16.9 (2.98) 17.3 (3.04)T125 21.0 (3.7) 19.7 (3.48) 20.4 (3.60) 20.9 (3.68)T150 25.2 (4.4) 22.7 (3.99) 23.6 (4.15) 24.2 (4.26)C2. Slab Edge <strong>Thermal</strong> <strong>Performance</strong>Table C.2: Effective Assembly R-Values including the effects <strong>of</strong> an insulated slab edge for 9foot floor to ceiling heightClipSystemExteriorInsulationNominal R-Valuehr∙ft 2 ∙ o F/BTU(m 2 K/W)Assembly Effective R-Valuewith Slab Edgehr∙ft 2 ∙ o F/BTU (m 2 K/W)34”VerticalSpacing41”VerticalSpacing48”VerticalSpacingSlab EdgeLinearTransmittanceBTU/hr∙ft∙ o F(W/mK)T100 16.8 (2.96) 15.6 (2.75) 16.1 (2.83) 16.4 (2.89) 0.029 (0.050)T125 21.0 (3.70) 18.2 (3.20) 18.8(3.30) 19.1(3.37) 0.041 (0.070)T150 25.2 (4.44) 20.6 (3.63) 21.4 (3.76) 21.9 (3.86) 0.041 (0.070)
C3. Impact <strong>of</strong> Batt Insulation in Steel Stud CavityTable C.3: Clear Field Effective Assembly R-Values with Batt Insulation in the Stud CavityClipSystemExteriorInsulationNominal R-Valuehr∙ft 2 ∙ o F/BTU(m 2 K/W)34” VerticalSpacingAssembly Effective R-Valuewith interior insulationhr∙ft 2 ∙ o F/BTU (m 2 K/W)41” VerticalSpacing48” VerticalSpacingT100 16.8 (2.96) 22.0 (3.87) 22.5 (3.96) 22.8 (4.02)T125 21.0 (3.70) 25.2 (4.44) 25.8 (4.55) 26.4 (4.65)T150 25.2 (4.44) 28.1 (4.95) 28.9 (5.09) 29.7 (5.23)C4. Sensitivity AnalysisTable C.4: Clip System Effective Assembly R-Value Per Exterior Insulation LevelExteriorInsulationNominal R-Valuehr∙ft 2 ∙ o F/BTU(m 2 K/W)34” ClipSpacingAssembly Effective R-Valuehr∙ft 2 ∙ o F/BTU (m 2 K/W)41” ClipSpacing48” ClipSpacing15 (2.64) 15.2 (2.68) 15.7 (2.76) 16.0 (2.81)20 (3.52) 18.9 (3.33) 19.5 (3.44) 20.0 (3.52)25 (4.40) 22.4 (3.94) 23.2 (4.09) 23.8 (4.20)30 (5.28) 25.6 (4.52) 26.8 (4.71) 27.5 (4.84)35 (6.16) 28.7 (5.05) 30.1 (5.30) 31.0 (5.46)40 (7.04) 31.5 (5.56) 33.2 (5.85) 34.3 (6.04)
Table C.5: T100 Clip Effective Assembly R-Values for Alternative Vertical Clip SpacingExteriorInsulationNominal R-Valuehr∙ft 2 ∙ o F/BTU(m 2 K/W)27” ClipSpacingAssembly Effective R-Value34” ClipSpacinghr∙ft 2 ∙ o F/BTU (m 2 K/W)41” ClipSpacing48” ClipSpacing55” ClipSpacing16.8 (2.96)15.5(2.74)16.4(2.89)16.9(2.98)17.3(3.04)17.3(3.04)
APPENDIX D – EXAMPLE SIMULATEDTEMPERATURE DISTRIBUTION
Figure D1: Temperature pr<strong>of</strong>ile for R125 clip system with clips spaced vertically at 41 inches
Figure D2: Temperature pr<strong>of</strong>ile for R125 clip system with clips spaced 41 in o.c. and slab edge detail
Figure D3: Temperature Distribution for the R125 clip system with interior insulation and clips verticallyspaced at 41 inch.
Morrison HershfieldSuite 310, 4321 Still Creek Drive, Burnaby, BC V5C 6S7, CanadaTel 604 454 0402 | Fax 604 454 0403 | morrisonhershfield.com