- Page 1 and 2:
Maple 9Learning GuideBased in part
- Page 3 and 4:
ContentsPreface 1Audience . . . . .
- Page 5 and 6:
Contents • vRoot Finding and Fact
- Page 7:
Contents • viiLast-Name Evaluatio
- Page 11 and 12:
1 Introduction to MapleMaple is a S
- Page 13 and 14:
2 Mathematics with Maple:The Basics
- Page 15 and 16:
2.2 Numerical Computations • 7are
- Page 17 and 18:
2.2 Numerical Computations • 9Tab
- Page 19 and 20:
2.2 Numerical Computations • 11Im
- Page 21 and 22:
2.2 Numerical Computations • 13Th
- Page 23 and 24:
2.2 Numerical Computations • 15Ma
- Page 25 and 26:
2.3 Basic Symbolic Computations •
- Page 27 and 28:
2.4 Assigning Expressions to Names
- Page 29 and 30:
2.5 Basic Types of Maple Objects2.5
- Page 31 and 32:
2.5 Basic Types of Maple Objects
- Page 33 and 34:
{1,2,3,a,b,c} intersect {0,1,y,a};2
- Page 35 and 36:
third_set := old_set minus {2, 5};2
- Page 37 and 38:
2.5 Basic Types of Maple Objects
- Page 39 and 40:
2.5 Basic Types of Maple Objects
- Page 41 and 42:
2.6 Expression Manipulation • 333
- Page 43 and 44:
x 2 + x y + y 2(y + x) (x 2 + y 2 )
- Page 45 and 46:
2.6 Expression Manipulation • 37T
- Page 47 and 48:
2.6 Expression Manipulation • 39>
- Page 49 and 50:
2.6 Expression Manipulation • 41C
- Page 51 and 52:
3 Finding SolutionsThis chapter int
- Page 53 and 54:
3.1 The Maple solve Command • 45s
- Page 55 and 56:
3.1 The Maple solve Command • 47A
- Page 57 and 58:
3.1 The Maple solve Command • 49>
- Page 59 and 60:
3.1 The Maple solve Command • 51>
- Page 61 and 62:
3.1 The Maple solve Command • 53f
- Page 63 and 64:
3.2 Solving Numerically Using the f
- Page 65 and 66:
3.2 Solving Numerically Using the f
- Page 67 and 68:
3.4 Polynomials • 59Solving Recur
- Page 69 and 70:
3.4 Polynomials • 61> sort(mul_va
- Page 71 and 72:
3.4 Polynomials • 63Table 3.1 Com
- Page 73 and 74:
3.5 Calculus3.5 Calculus • 65Mapl
- Page 75 and 76:
3.5 Calculus • 67> plot({f(x), p}
- Page 77 and 78:
3.5 Calculus • 69> simplify(%);x
- Page 79 and 80:
3.6 Solving Differential Equations
- Page 81 and 82: 3.6 Solving Differential Equations
- Page 83 and 84: 3.6 Solving Differential Equations
- Page 85 and 86: _C1 e + _C2 e (−1) − _C3 sin(1)
- Page 87 and 88: 4 Maple OrganizationThis chapter in
- Page 89 and 90: 4.1 The Organization of Maple • 8
- Page 91 and 92: CurveFitting commands that support
- Page 93 and 94: 4.2 The Maple Packages • 85Orthog
- Page 95 and 96: 4.2 The Maple Packages • 87TypeTo
- Page 97 and 98: 4.2 The Maple Packages • 89To vie
- Page 99 and 100: 4.2 The Maple Packages • 91> Limi
- Page 101 and 102: 4.2 The Maple Packages • 93You ca
- Page 103 and 104: 4.2 The Maple Packages • 95The fo
- Page 105 and 106: 4.2 The Maple Packages • 97To est
- Page 107 and 108: 4.2 The Maple Packages • 99> read
- Page 109 and 110: 4.2 The Maple Packages • 101The s
- Page 111 and 112: 5 PlottingMaple can produce several
- Page 113 and 114: 5.1 Graphing in Two Dimensions •
- Page 115 and 116: 5.1 Graphing in Two Dimensions •
- Page 117 and 118: polarplot( r-expr, angle=range )5.1
- Page 119 and 120: 5.1 Graphing in Two Dimensions •
- Page 121 and 122: 5.1 Graphing in Two Dimensions •
- Page 123 and 124: 5.1 Graphing in Two Dimensions •
- Page 125 and 126: 5.1 Graphing in Two Dimensions •
- Page 127 and 128: 5.2 Graphing in Three Dimensions
- Page 129 and 130: 5.2 Graphing in Three Dimensions
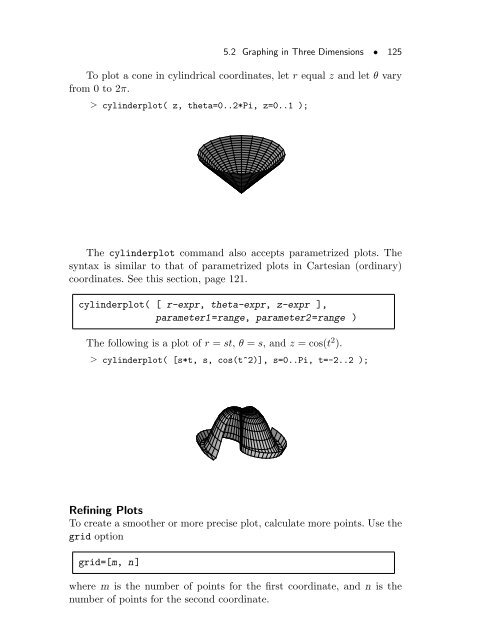
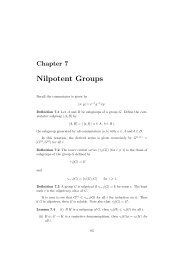
- Page 131: 5.2 Graphing in Three Dimensions
- Page 135 and 136: 5.3 Animation • 127Simultaneous u
- Page 137 and 138: 5.3 Animation • 129Specifying Fra
- Page 139 and 140: • a,b - real constants giving the
- Page 141 and 142: 5.4 Annotating Plots • 133The Sph
- Page 143 and 144: 5.5 Composite Plots • 135> with(p
- Page 145 and 146: a := plot( sin(x), x=-Pi..Pi ):5.6
- Page 147 and 148: 5.6 Special Types of Plots • 139T
- Page 149 and 150: 5.6 Special Types of Plots • 141A
- Page 151 and 152: 5.6 Special Types of Plots • 1431
- Page 153 and 154: 5.7 Manipulating Graphical Objects
- Page 155 and 156: 5.7 Manipulating Graphical Objects
- Page 157 and 158: hedgehog := [s1, s2, c3, stelhs]:>
- Page 159 and 160: 5.8 Code for Color Plates • 151>
- Page 161 and 162: 5.10 Conclusion5.10 Conclusion •
- Page 163 and 164: 6 Evaluation andSimplificationExpre
- Page 165 and 166: expand( (x+1)*(y^2-2*y+1) / z / (y-
- Page 167 and 168: 6.1 Mathematical Manipulations •
- Page 169 and 170: 6.1 Mathematical Manipulations •
- Page 171 and 172: factor( poly, RootOf(x^2-2) );6.1 M
- Page 173 and 174: 6.1 Mathematical Manipulations •
- Page 175 and 176: 6.1 Mathematical Manipulations •
- Page 177 and 178: 6.1 Mathematical Manipulations •
- Page 179 and 180: 6.1 Mathematical Manipulations •
- Page 181 and 182: 6.1 Mathematical Manipulations •
- Page 183 and 184:
6.2 Assumptions • 175> assume( a
- Page 185 and 186:
6.2 Assumptions • 177∞Logarithm
- Page 187 and 188:
6.2 Assumptions • 179a:nothing kn
- Page 189 and 190:
6.3 Structural Manipulations • 18
- Page 191 and 192:
6.3 Structural Manipulations • 18
- Page 193 and 194:
6.3 Structural Manipulations • 18
- Page 195 and 196:
f := (x, y) → is(x < y)6.3 Struct
- Page 197 and 198:
6.3 Structural Manipulations • 18
- Page 199 and 200:
term3 := 2 cos(x) 2 sin(x)6.3 Struc
- Page 201 and 202:
6.3 Structural Manipulations • 19
- Page 203 and 204:
6.3 Structural Manipulations • 19
- Page 205 and 206:
y := ln( sin( x * exp(cos(x)) ) );y
- Page 207 and 208:
√ z sin(z) + w6.3 Structural Mani
- Page 209 and 210:
6.3 Structural Manipulations • 20
- Page 211 and 212:
6.4 Evaluation Rules • 203> eval(
- Page 213 and 214:
6.4 Evaluation Rules • 205proc(x:
- Page 215 and 216:
6.4 Evaluation Rules • 207The seq
- Page 217 and 218:
6.4 Evaluation Rules • 2091Import
- Page 219 and 220:
6.4 Evaluation Rules • 211> q :=
- Page 221 and 222:
6.5 Conclusion • 213> sum( ’a||
- Page 223 and 224:
7 Solving Calculus ProblemsThis cha
- Page 225 and 226:
7.1 Introductory Calculus • 217>
- Page 227 and 228:
7.1 Introductory Calculus • 219In
- Page 229 and 230:
⎡⎧ ⎛1 √⎞1⎨5 − ⎩⎢a
- Page 231 and 232:
7.1 Introductory Calculus • 223en
- Page 233 and 234:
sol := solve( {err_x=0, err_xi=0},
- Page 235 and 236:
7.1 Introductory Calculus • 227If
- Page 237 and 238:
7.1 Introductory Calculus • 229>
- Page 239 and 240:
7.1 Introductory Calculus • 231{0
- Page 241 and 242:
7.1 Introductory Calculus • 233An
- Page 243 and 244:
∫ 1+ sin(x) dx27.1 Introductory C
- Page 245 and 246:
7.1 Introductory Calculus • 237r
- Page 247 and 248:
7.1 Introductory Calculus • 239fy
- Page 249 and 250:
7.2 Ordinary Differential Equations
- Page 251 and 252:
{y(x) = _C1 },7.2 Ordinary Differen
- Page 253 and 254:
Evaluate the result at values for t
- Page 255 and 256:
7.2 Ordinary Differential Equations
- Page 257 and 258:
7.2 Ordinary Differential Equations
- Page 259 and 260:
7.2 Ordinary Differential Equations
- Page 261 and 262:
odeplot( sol, [t, x(t)], -1..2 );7.
- Page 263 and 264:
7.2 Ordinary Differential Equations
- Page 265 and 266:
You must evaluate the derivatives a
- Page 267 and 268:
7.2 Ordinary Differential Equations
- Page 269 and 270:
DEplot( ode, dep-var, range, [ini-c
- Page 271 and 272:
DEplot( {eq1, eq2}, [x(t), y(t)], -
- Page 273 and 274:
7.2 Ordinary Differential Equations
- Page 275 and 276:
f := unapply( rhs( % ), t );7.2 Ord
- Page 277 and 278:
eq := diff(y(t),t) = 1-y(t)*f(t);7.
- Page 279 and 280:
7.3 Partial Differential Equations
- Page 281 and 282:
7.3 Partial Differential Equations
- Page 283 and 284:
7.3 Partial Differential Equations
- Page 285 and 286:
8 Input and OutputMaple provides co
- Page 287 and 288:
8.1 Reading Files • 279For exampl
- Page 289 and 290:
8.2 Writing Data to a File • 281W
- Page 291 and 292:
ExportVector( "vectordata.txt", V )
- Page 293 and 294:
8.2 Writing Data to a File • 285o
- Page 295 and 296:
8.3 Exporting Worksheets • 287•
- Page 297 and 298:
8.3 Exporting Worksheets • 289ali
- Page 299 and 300:
8.3 Exporting Worksheets • 291\en
- Page 301 and 302:
8.3 Exporting Worksheets • 293Exp
- Page 303 and 304:
8.3 Exporting Worksheets • 295Pla
- Page 305 and 306:
8.3 Exporting Worksheets • 2974.
- Page 307 and 308:
8.5 Conclusion • 299Graphics Suit
- Page 309 and 310:
9 Maplet User InterfaceCustomizatio
- Page 311 and 312:
9.3 How to Start the Maplets Packag
- Page 313 and 314:
9.7 How to Activate a Maplet Applic
- Page 315 and 316:
Index!, 8I ( √ −1), 14π, 12~,
- Page 317 and 318:
Index • 309combiningpowers, 37pro
- Page 319 and 320:
Index • 311integer quotient, 9int
- Page 321 and 322:
Index • 313partial, 173fsolve, 54
- Page 323 and 324:
Index • 315liesymm, 83lighting sc
- Page 325 and 326:
Index • 317graphical, 144odeplot,
- Page 327 and 328:
Index • 319lighting schemes, 126l
- Page 329 and 330:
Index • 321refining 2-D plots, 11
- Page 331 and 332:
Index • 323by total order, 60spac