<strong>Sanitation</strong> <strong>21</strong>Executive SummaryConventional approaches to sanitation <strong>planning</strong> anddesign seem to fail with depressing regularity. Indeveloping utility situations where coverage is low,the norms and approaches that are being appliedin general seem to result in too frequent failureswhich either sees the perpetuation of low accessto services, or short term failures in operation andmaintenance.Current technical <strong>planning</strong> and design practices,based as they are on logical normative technical<strong>planning</strong> approaches, seem to be failing because:• the objectives upon which decision are basedare distorted by special interests, or by apoor understanding of the real needs of thepopulation,• they result in plans which do not respond tothe rapidly changing urban context and diverseconditions which pertain in modern urbanspaces;• they fail to make a realistic assessment of shortterm inertia which impedes capital investment;and• They result in systems which place an unrealisticmanagement burden on all levels of the city.In this document we argue that improving thequality and effectiveness of sanitation investmentsis not particularly about technologies (althoughthe appropriate application of technology isimportant) rather it is about developing an explicitunderstanding of what the objectives of a systemare and then designing a system which meetsthose objectives. We should not be surprisedthat significant investments in wastewatertreatment plants often do not result in significantimprovements in access to sanitation services.Likewise we cannot expect subsidies which helppoor families to construct on-site latrines to resultin better overall sludge management in the city.The <strong>Sanitation</strong> <strong>21</strong> Task Force argues that technicalplanners and designers have to get smarter at<strong>planning</strong> systems which respond to the needs ofthe modern city. This requires a sea-change in theway technical decisions are taken, so that they canrespond better to the human and political contextin which they are made. Yet, paradoxically, whatwe are proposing is not rocket science; it’s not verynew at all. It draws on well-established principles ofgood <strong>planning</strong> and design practice from within thetechnical world and also from much thinking in thedevelopment world 1 All we are really saying is ‘let’sdo <strong>planning</strong> and design better.’We lay out an approach which:• promotes an analysis of the objectives of asanitation system across all domains of the city,including the household (other domains includethe neighbourhood, city and beyond the city)• promotes an analysis of the external drivers andcontexts which impact on behaviour in eachdomain• analyses technical options in terms which relateelements of the system to these domains• encourages a realistic assessment of themanagement requirements in each domain; andthen• Prompts the planner/ designer to ask, will it work?Are the management requirements matched bymanagement capacity throughout the system? Iswhat we are proposing fit for the purpose?We hope this publication will form the basis for areal discussion amongst practitioners, designersand planners, so that sanitation investments in thiscentury can be effective at meeting the needs ofthose who are currently unserved.1 In particular for example Albert Wright, SSP, Roland Schertenleib/ John Kalbermatten, HCES, Steven Esrey Closing the Loop etc.– –
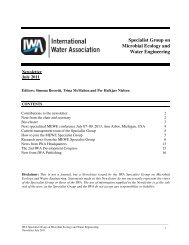
<strong>Sanitation</strong> <strong>21</strong>605040302010<strong>Sanitation</strong> <strong>21</strong>1 Background1.1 The Scale of the ProblemThe scale of the problem is enormous. This isbecause urban populations are growing, urbanareas are becoming increasingly informal andcoverage (our starting point) is extremely low,with the main challenges focused in the poorestcountries.Urbanisation: There is no doubt that one ofthe defining characteristics of the late 20th andearly <strong>21</strong>st centuries has been the rapid rate ofurbanisation. During the 20th century, the world’surban population increased more than tenfold.Today, nearly half the world’s population lives inurban centres, compared to less than 15 percent in1900 (see Table 1 and Figure 1) ).Growth of slums: Within cities themselvesexclusion and marginalization of the poorestappears not only to be deepening (the gapsbetween rich and poor widening) but alsospreading, so that an increasing percentage of theurban population is living “outside” the systems offormal service provision. UN-HABITAT estimates% of total population which is urbanOceaniaNorthern AmericaLatin America and the CaribbeanEuropeAsiaAfricaFig1 Data in Table 1 and Figure 1 are derived from United Nations2004 and cited in World Water Development Report 2005 Chapteron Water and Human Settlements (forthcoming). Figures forrural and urban populations for 1900 are drawn from Graumann,John V. (1977), “Orders of magnitude of the world’s urban andrural population in history”, United Nations Population Bulletin 8,United Nations, New York, pp. 16‐33. Data for 2000 are aggregatenational statistics, many of which draw on national censuses heldin 1999, 2000 or 2001 – but some are based on estimates orprojections from statistics drawn from censuses held around 1990.There is also a group of countries (mostly in Africa) for which thereare no census data since the 1970s or early 1980s so all figuresfor their urban (and rural) populations are based on estimates andprojections.Urban population (millions of inhabitants)Table1Region 1950 1970 1990 2000 2010Africa 33 83 199 295 417Asia 232 486 1012 1367 1770Europe 280 413 516 529 534Latin America andthe Caribbean70 163 314 393 472Northern America 110 171 <strong>21</strong>4 250 286Oceania 8 14 19 23 26World 733 1330 2273 2857 3505indicate that in 2001, 924 million people, or 31.6%of the world’s urban population, lived in slums. Indeveloping regions, slum dwellers account for 43%of the urban population. If current growth rates aremaintained, by 2030, half of humanity will be slumdwellers.Low Coverage: The percentage of this urbanpopulation which is served with improved sanitationis difficult to determine. Official data are analysedand presented by the ‘Joint Monitoring Program’(JMP) of UNICEF and WHO . A summary of thelatest data for urban sanitation coverage is shownin Table 2 and illustrates the magnitude of thechallenge; in 2002 more than a quarter of the urbanpopulation in developing countries was recordedas not having access to improved sanitation, fewerthan 40% had a house connection.Low Coverage correlates with poverty: Table 2also shows us that the situation is even morecomplicated for the least developed countries.Most observers suggest that the situation mayin fact be much worse, since coverage of urbanareas is often counted in terms of whether asettlement has a system in place sometimes withlittle attention to the status of the system, ratherthan by assessing household access to services.The correlation shows even more clearly in Figure2 which relates sanitation coverage against GDPand population. The figure indicates the generalcorrelation between low coverage and low GDP percapita. More specifically: http://www.wssinfo.org/en/welcome.html The quality andreliability of the data in the JMP data set is subject to much debateand there is no doubt that the real picture may be slightly different;but in one essential aspect JMP tells the right story; the challengeis enormous and, at least in Africa, still growing.– –