R Stata - Data and Statistical Services - Princeton University
R Stata - Data and Statistical Services - Princeton University
R Stata - Data and Statistical Services - Princeton University

You also want an ePaper? Increase the reach of your titles
YUMPU automatically turns print PDFs into web optimized ePapers that Google loves.
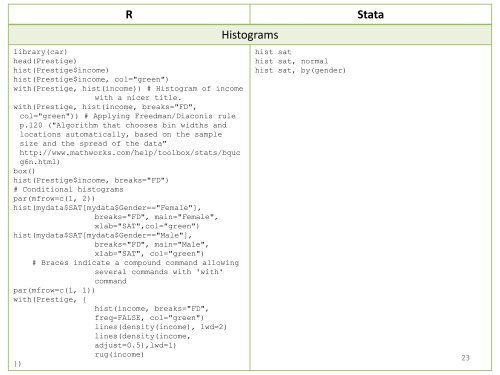
R <strong>Stata</strong><br />
library(car)<br />
head(Prestige)<br />
hist(Prestige$income)<br />
hist(Prestige$income, col="green")<br />
with(Prestige, hist(income)) # Histogram of income<br />
with a nicer title.<br />
with(Prestige, hist(income, breaks="FD",<br />
col="green")) # Applying Freedman/Diaconis rule<br />
p.120 ("Algorithm that chooses bin widths <strong>and</strong><br />
locations automatically, based on the sample<br />
size <strong>and</strong> the spread of the data"<br />
http://www.mathworks.com/help/toolbox/stats/bquc<br />
g6n.html)<br />
box()<br />
hist(Prestige$income, breaks="FD")<br />
# Conditional histograms<br />
par(mfrow=c(1, 2))<br />
hist(mydata$SAT[mydata$Gender=="Female"],<br />
breaks="FD", main="Female",<br />
xlab="SAT",col="green")<br />
hist(mydata$SAT[mydata$Gender=="Male"],<br />
breaks="FD", main="Male",<br />
xlab="SAT", col="green")<br />
# Braces indicate a compound comm<strong>and</strong> allowing<br />
several comm<strong>and</strong>s with 'with'<br />
comm<strong>and</strong><br />
par(mfrow=c(1, 1))<br />
with(Prestige, {<br />
hist(income, breaks="FD",<br />
freq=FALSE, col="green")<br />
lines(density(income), lwd=2)<br />
lines(density(income,<br />
adjust=0.5),lwd=1)<br />
rug(income)<br />
})<br />
Histograms<br />
hist sat<br />
hist sat, normal<br />
hist sat, by(gender)<br />
23