R Stata - Data and Statistical Services - Princeton University
R Stata - Data and Statistical Services - Princeton University
R Stata - Data and Statistical Services - Princeton University

Create successful ePaper yourself
Turn your PDF publications into a flip-book with our unique Google optimized e-Paper software.
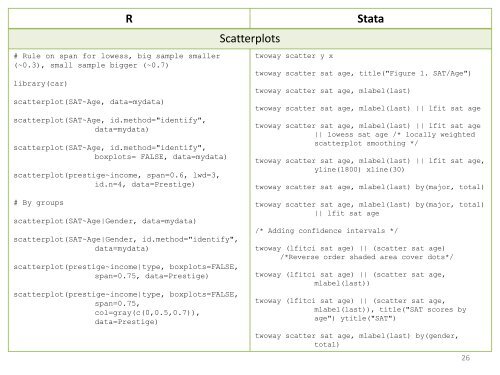
# Rule on span for lowess, big sample smaller<br />
(~0.3), small sample bigger (~0.7)<br />
library(car)<br />
scatterplot(SAT~Age, data=mydata)<br />
scatterplot(SAT~Age, id.method="identify",<br />
data=mydata)<br />
scatterplot(SAT~Age, id.method="identify",<br />
boxplots= FALSE, data=mydata)<br />
scatterplot(prestige~income, span=0.6, lwd=3,<br />
id.n=4, data=Prestige)<br />
# By groups<br />
scatterplot(SAT~Age|Gender, data=mydata)<br />
R <strong>Stata</strong><br />
scatterplot(SAT~Age|Gender, id.method="identify",<br />
data=mydata)<br />
scatterplot(prestige~income|type, boxplots=FALSE,<br />
span=0.75, data=Prestige)<br />
scatterplot(prestige~income|type, boxplots=FALSE,<br />
span=0.75,<br />
col=gray(c(0,0.5,0.7)),<br />
data=Prestige)<br />
Scatterplots<br />
twoway scatter y x<br />
twoway scatter sat age, title("Figure 1. SAT/Age")<br />
twoway scatter sat age, mlabel(last)<br />
twoway scatter sat age, mlabel(last) || lfit sat age<br />
twoway scatter sat age, mlabel(last) || lfit sat age<br />
|| lowess sat age /* locally weighted<br />
scatterplot smoothing */<br />
twoway scatter sat age, mlabel(last) || lfit sat age,<br />
yline(1800) xline(30)<br />
twoway scatter sat age, mlabel(last) by(major, total)<br />
twoway scatter sat age, mlabel(last) by(major, total)<br />
|| lfit sat age<br />
/* Adding confidence intervals */<br />
twoway (lfitci sat age) || (scatter sat age)<br />
/*Reverse order shaded area cover dots*/<br />
twoway (lfitci sat age) || (scatter sat age,<br />
mlabel(last))<br />
twoway (lfitci sat age) || (scatter sat age,<br />
mlabel(last)), title("SAT scores by<br />
age") ytitle("SAT")<br />
twoway scatter sat age, mlabel(last) by(gender,<br />
total)<br />
26