R Stata - Data and Statistical Services - Princeton University
R Stata - Data and Statistical Services - Princeton University
R Stata - Data and Statistical Services - Princeton University

You also want an ePaper? Increase the reach of your titles
YUMPU automatically turns print PDFs into web optimized ePapers that Google loves.
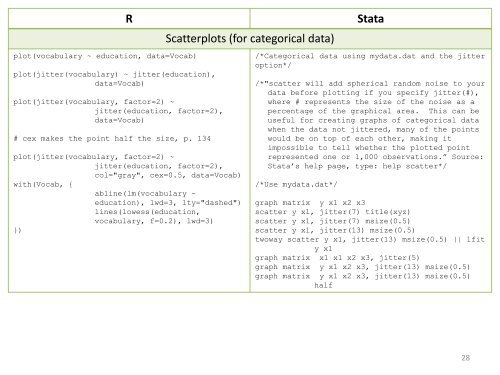
plot(vocabulary ~ education, data=Vocab)<br />
plot(jitter(vocabulary) ~ jitter(education),<br />
data=Vocab)<br />
plot(jitter(vocabulary, factor=2) ~<br />
jitter(education, factor=2),<br />
data=Vocab)<br />
# cex makes the point half the size, p. 134<br />
R <strong>Stata</strong><br />
plot(jitter(vocabulary, factor=2) ~<br />
jitter(education, factor=2),<br />
col="gray", cex=0.5, data=Vocab)<br />
with(Vocab, {<br />
abline(lm(vocabulary ~<br />
education), lwd=3, lty="dashed")<br />
lines(lowess(education,<br />
vocabulary, f=0.2), lwd=3)<br />
})<br />
Scatterplots (for categorical data)<br />
/*Categorical data using mydata.dat <strong>and</strong> the jitter<br />
option*/<br />
/*"scatter will add spherical r<strong>and</strong>om noise to your<br />
data before plotting if you specify jitter(#),<br />
where # represents the size of the noise as a<br />
percentage of the graphical area. This can be<br />
useful for creating graphs of categorical data<br />
when the data not jittered, many of the points<br />
would be on top of each other, making it<br />
impossible to tell whether the plotted point<br />
represented one or 1,000 observations.” Source:<br />
<strong>Stata</strong>’s help page, type: help scatter*/<br />
/*Use mydata.dat*/<br />
graph matrix y x1 x2 x3<br />
scatter y x1, jitter(7) title(xyz)<br />
scatter y x1, jitter(7) msize(0.5)<br />
scatter y x1, jitter(13) msize(0.5)<br />
twoway scatter y x1, jitter(13) msize(0.5) || lfit<br />
y x1<br />
graph matrix x1 x1 x2 x3, jitter(5)<br />
graph matrix y x1 x2 x3, jitter(13) msize(0.5)<br />
graph matrix y x1 x2 x3, jitter(13) msize(0.5)<br />
half<br />
28