Studio delle prestazioni di un sistema a fosfori per mammografia ...
Studio delle prestazioni di un sistema a fosfori per mammografia ...
Studio delle prestazioni di un sistema a fosfori per mammografia ...

Create successful ePaper yourself
Turn your PDF publications into a flip-book with our unique Google optimized e-Paper software.
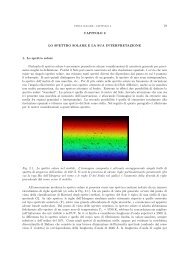
2.4.1 DQE o<strong>per</strong>ating definition.<br />
This definition can be extended to take into acco<strong>un</strong>t the spatial modulation of the input signals if<br />
we consider the spatial frequency dependence. From this point of view, the DQE is the transfer<br />
coefficient, for each spatial frequency, of the signal to noise ratio through the system. It can be<br />
compared to the MTF, which describes the modulation transfer. In order to obtain an efficient<br />
o<strong>per</strong>ating definition of the DQE, it is necessary to rely on the linearity pro<strong>per</strong>ty of the system<br />
<strong>un</strong>der investigation (see Section 2.1). Let us define the input two <strong>di</strong>mensional signal � Ü� Ý (in<br />
this case a dose <strong>di</strong>stribution) and the output of the system � Ü� Ý (which is the dose <strong>di</strong>stribution<br />
map obtained applying the inverse sensitometric curve to the image data). The correspon<strong>di</strong>ng<br />
input and output fluctuations are ¡� Ü� Ý and ¡� Ü� Ý and their respective power spectra<br />
Ï ¡� Ù� Ú and Ï ¡� Ù� Ú . The power spectrum of an ideal system, which does not generate an<br />
intrinsic noise, is related to the input power spectrum through the MTF:<br />
Ï ¡� Ù� Ú �ÅÌ� Ù� Ú ¡ Ï ¡� Ù� Ú (2.43)<br />
The DQE definition based on the average signals:<br />
¬<br />
¬<br />
¬<br />
�� �<br />
��ÇÍÌ ℄<br />
��ÁÆ℄ ¬ ��Ò �ÓÙØ can be extended so to obtain:<br />
�É� Ù� Ú � ÅÌ� Ù� Ú Ï ¡� Ù� Ú<br />
Ï ¡� Ù� Ú<br />
(2.44)<br />
(2.45)<br />
where the generic average signal has been replaced by a monochromatic wave, with spatial<br />
frequencies Ù� Ú . The input output relation is ruled by the ÅÌ� Ù� Ú coefficient, while the<br />
variance is given by the Ù� Ú component of the correspon<strong>di</strong>ng power spectra.<br />
The whole analysis is consistent since, if we introduce a signal of amplitude � Ù� Ú ,we<br />
obtain once more that the DQE is the transfer f<strong>un</strong>ction of the signal to noise ratio:<br />
ËÆÊ ÓÙØ �<br />
ËÆÊ �Ò �<br />
ÅÌ� Ù� Ú � Ù� Ú<br />
Ï ¡� Ù� Ú<br />
� Ù� Ú<br />
Ï ¡� Ù� Ú<br />
�É� Ù� Ú � ËÆÊ ÓÙØ<br />
ËÆÊ �Ò<br />
� ÅÌ� Ù� Ú Ï ¡� Ù� Ú<br />
Ï ¡� Ù� Ú<br />
29<br />
(2.46)<br />
(2.47)<br />
(2.48)