

ib-economics-quantitative
ib-economics-quantitative
ib-economics-quantitative
- No tags were found...

Create successful ePaper yourself
Turn your PDF publications into a flip-book with our unique Google optimized e-Paper software.
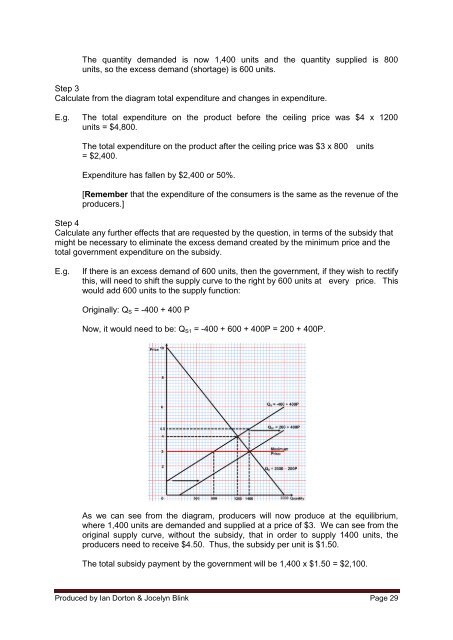
The quantity demanded is now 1,400 units and the quantity supplied is 800units, so the excess demand (shortage) is 600 units.Step 3Calculate from the diagram total expenditure and changes in expenditure.E.g. The total expenditure on the product before the ceiling price was $4 x 1200units = $4,800.The total expenditure on the product after the ceiling price was $3 x 800 units= $2,400.Expenditure has fallen by $2,400 or 50%.[Remember that the expenditure of the consumers is the same as the revenue of theproducers.]Step 4Calculate any further effects that are requested by the question, in terms of the subsidy thatmight be necessary to eliminate the excess demand created by the minimum price and thetotal government expenditure on the subsidy.E.g.If there is an excess demand of 600 units, then the government, if they wish to rectifythis, will need to shift the supply curve to the right by 600 units at every price. Thiswould add 600 units to the supply function:Originally: Q S = -400 + 400 PNow, it would need to be: Q S1 = -400 + 600 + 400P = 200 + 400P.As we can see from the diagram, producers will now produce at the equil<strong>ib</strong>rium,where 1,400 units are demanded and supplied at a price of $3. We can see from theoriginal supply curve, without the subsidy, that in order to supply 1400 units, theproducers need to receive $4.50. Thus, the subsidy per unit is $1.50.The total subsidy payment by the government will be 1,400 x $1.50 = $2,100.Produced by Ian Dorton & Jocelyn Blink Page 29