

ib-economics-quantitative
ib-economics-quantitative
ib-economics-quantitative
- No tags were found...

Create successful ePaper yourself
Turn your PDF publications into a flip-book with our unique Google optimized e-Paper software.
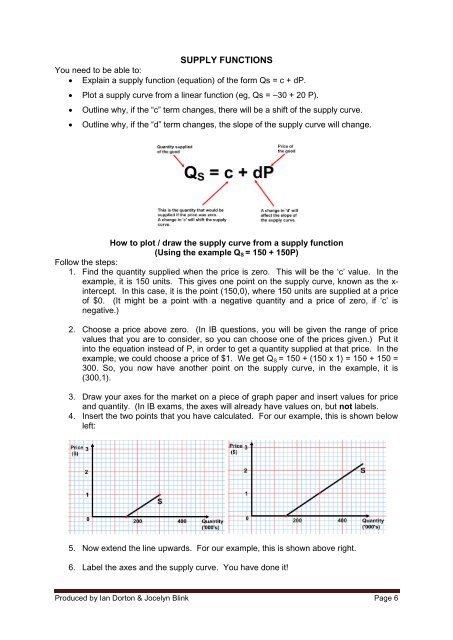
SUPPLY FUNCTIONSYou need to be able to: Explain a supply function (equation) of the form Qs = c + dP.Plot a supply curve from a linear function (eg, Qs = –30 + 20 P).Outline why, if the “c” term changes, there will be a shift of the supply curve.Outline why, if the “d” term changes, the slope of the supply curve will change.How to plot / draw the supply curve from a supply function(Using the example Q S = 150 + 150P)Follow the steps:1. Find the quantity supplied when the price is zero. This will be the „c‟ value. In theexample, it is 150 units. This gives one point on the supply curve, known as the x-intercept. In this case, it is the point (150,0), where 150 units are supplied at a priceof $0. (It might be a point with a negative quantity and a price of zero, if „c‟ isnegative.)2. Choose a price above zero. (In IB questions, you will be given the range of pricevalues that you are to consider, so you can choose one of the prices given.) Put itinto the equation instead of P, in order to get a quantity supplied at that price. In theexample, we could choose a price of $1. We get Q S = 150 + (150 x 1) = 150 + 150 =300. So, you now have another point on the supply curve, in the example, it is(300,1).3. Draw your axes for the market on a piece of graph paper and insert values for priceand quantity. (In IB exams, the axes will already have values on, but not labels.4. Insert the two points that you have calculated. For our example, this is shown belowleft:5. Now extend the line upwards. For our example, this is shown above right.6. Label the axes and the supply curve. You have done it!Produced by Ian Dorton & Jocelyn Blink Page 6