

ib-economics-quantitative
ib-economics-quantitative
ib-economics-quantitative
- No tags were found...

Create successful ePaper yourself
Turn your PDF publications into a flip-book with our unique Google optimized e-Paper software.
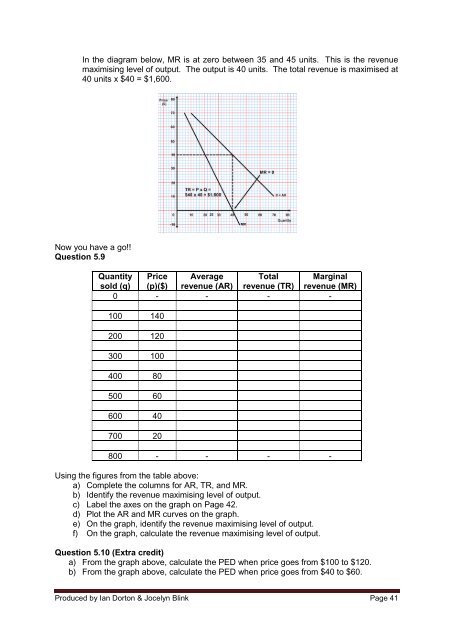
In the diagram below, MR is at zero between 35 and 45 units. This is the revenuemaximising level of output. The output is 40 units. The total revenue is maximised at40 units x $40 = $1,600.Now you have a go!!Question 5.9Quantity Price Average Total Marginalsold (q) (p)($) revenue (AR) revenue (TR) revenue (MR)0 - - - -100 140200 120300 100400 80500 60600 40700 20800 - - - -Using the figures from the table above:a) Complete the columns for AR, TR, and MR.b) Identify the revenue maximising level of output.c) Label the axes on the graph on Page 42.d) Plot the AR and MR curves on the graph.e) On the graph, identify the revenue maximising level of output.f) On the graph, calculate the revenue maximising level of output.Question 5.10 (Extra credit)a) From the graph above, calculate the PED when price goes from $100 to $120.b) From the graph above, calculate the PED when price goes from $40 to $60.Produced by Ian Dorton & Jocelyn Blink Page 41