

ib-economics-quantitative
ib-economics-quantitative
ib-economics-quantitative
SHOW LESS
- No tags were found...

Create successful ePaper yourself
Turn your PDF publications into a flip-book with our unique Google optimized e-Paper software.
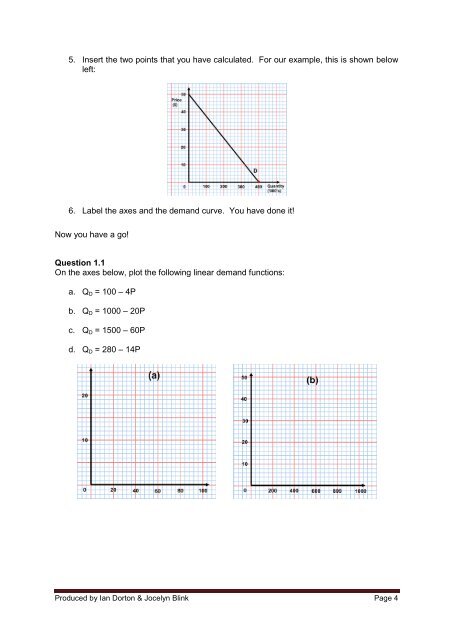
5. Insert the two points that you have calculated. For our example, this is shown belowleft:6. Label the axes and the demand curve. You have done it!Now you have a go!Question 1.1On the axes below, plot the following linear demand functions:a. Q D = 100 – 4Pb. Q D = 1000 – 20Pc. Q D = 1500 – 60Pd. Q D = 280 – 14PProduced by Ian Dorton & Jocelyn Blink Page 4